
New search
Property profile & analytics
FOR LEASE
Drive through restaurants
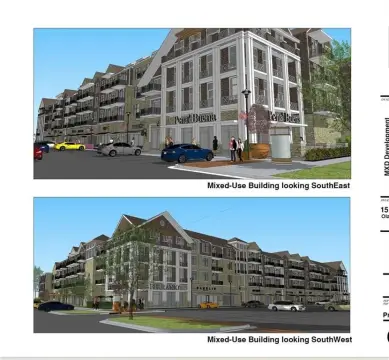
13790 S Blackbob Rd, Olathe, KS 66062
Entity Owned
Free & Clear
Property ID
US33-0947195
 For Lease
1 / 2
For Lease
1 / 2
$580,000
13790 S Blackbob Rd, Olathe, KS 66062
View Listing →
Property profile
Verified
Property type
Drive through restaurants
Use group
DRIVE-THRU RESTAURANT, FAST FOOD
Year built
2009
Construction
FRAME
Total area
2,987 SF
Lot
0.85 ac (37,017 SF)
APN
DP04270000 0029
UPID
US33-0947195
Cap rate & NOI
Priority signal for investors
Implied cap rate, NOI & suggested price
Cap rate vs submarket · NOI estimate · 3 price anchors
Implied cap rate, NOI & suggested price
Cap vs submarket · NOI estimate · 3 price anchors
Current use
Occupant on record · Public records
-
Arby's Restaurant Take-out & Catering
Value estimations
Realmo proprietary · 4 methods
AI Approach
AI
$520k
CAP Approach
CAP
by Request
Comparable Approach
Comparable
$640k
Blend (final)
Blend
$580k
Owner & transaction history
BLACKBOB INVESTORS LLC
BLACKBOB INVESTORS LLC
Zoning & alternative use
Permitted uses
Permitted uses
Allowed · conditional · prohibited
Cap rate
Implied · in-place · derived from last sale + estimated NOI
Implied Cap rate
#1
Implied · in-place · NOI ÷ last sale
In-place · derived from last sale + estimated NOI
Cap rate, NOI & submarket benchmark
Implied cap rate vs Olathe submarket · NOI estimate · Typical band, median & reading
Implied cap rate, NOI & submarket benchmark
Cap vs Olathe submarket · NOI estimate · typical band, median & reading
Refine your cap rate
8-question underwriting flow
1.
Property current status — Going-In vs Stabilized
2.
Price for denominator — asking / offer / market
3.
Leasing status & lease structure (NNN / Gross)
4.
Tenant risk profile & vacancy assumption
5.
Upload T12 / rent roll / OM (optional)
Refine in 60 seconds, get exact suggested price
T12 upload · Submarket benchmarks · Sensitivity grid
Suggested price · 3 cap rate anchors
Income approach @ 5% / 7% / 9% — aggressive / typical / conservative
Suggested price at 5% / 7% / 9% cap
Aggressive / typical / conservative · Implied $/SF per anchor · Sensitivity grid
Suggested price at 5% / 7% / 9% cap
Aggressive / typical / conservative · implied $/SF · sensitivity
Value
AI, CAP & Alternative Use estimations · Realmo proprietary blendValue Estimations
Based on Realmo’s proprietary methodology
AI Approach
Method
Estimation
Statistic approach
by Request
ML approach
$520,000
CAP Approach
CAP Return
Estimation
6%
by Request
6.5%
by Request
7%
by Request
Alternative Use
Use
Estimation
RESTAURANT
$595,000
Current use
OFFICE BUILDING
$555,000
Change: -7% · Conversion: Moderate
Blend value · Realmo final
$580k
Range $522k – $638k · ±10%
Realmo estimate · informational only.
These numbers are calculated by our models from public records and may not reflect actual market value.
Not an appraisal.
Verify with a licensed appraiser before transacting. Realmo accepts no liability for divergence from real-world outcomes.
View the full estimation — every method, every assumption
Confidence drivers & risk notes · Custom comparable set · Free for first 3 / day
Full estimation methodology
Every method · every assumption · confidence drivers
Price per SF
Sale + rent benchmarks
Subject property
$194 / SF
Submarket sale & rent benchmarks
Median sale $/SF · Asking & closed rent · Submarket vacancy
Submarket sale & rent benchmarks
Median sale $/SF · asking & closed rent · submarket vacancy
Property tax & assessments
Tax year 2023Property tax & assessments
Tax year 2023
Tax billed
$43,823
Tax year 2023
Assessed value
$374,500
Assessed 2023
Previous assessed
$324,001
+15.6% YoY
Effective rate
11.70%
On assessed value
Assessed land
$175,830
Assessed improvement
$198,670
Land market value
$703,320
Improvement market value
$794,680
Total market value
$1,498,000
Applied tax rate
612.0000
Comparables
6 recent transactions · within 1.5 miComparable in this city
6 recent transactions
Comparable in this City


Similar Nearby for Sale


Similar Nearby for Lease


Recent comparable sales
Sale price & price/SF · Sale date & distance · Adjustments & confidence
Recent comparable sales
Sale price & $/SF · sale date & distance · adjustments
Property description
Physical attributes from public recordsBuilding & lot
Public records
Property type
Drive through restaurants
Use group
DRIVE-THRU RESTAURANT, FAST FOOD
Status
For Lease
Year built
2009
Construction
FRAME
Heating
YES
Cooling
YES
Stories
1
Total area
2,987 SF
Lot
0.85 ac (37,017 SF)
APN
DP04270000 0029
UPID
US33-0947195
Jurisdiction
JOHNSON
Zoning & alternative use
Zoning · permitted uses
Permitted & conditional uses
Allowed uses · Special-permit conditions · Prohibited uses
Permitted & conditional uses
Allowed · special-permit conditions · prohibited
Alternative use value scenarios
Repositioning upside vs current use
RESTAURANT Current
Est. value
$595,000
OFFICE BUILDING
Est. value
$555,000
RESTAURANT Current
OFFICE BUILDING
Alternative use deep dive — conversion cost, permits, timeline
Conversion cost estimate · Permit path & risks · Stabilized NOI per option
Alternative use deep dive
Conversion cost · permit path · stabilized NOI per option
Building & site characteristics
From public records
Year built
2009
Construction
FRAME
Heating
YES
Cooling
Yes
Stories
1
Lot
0.85 ac
Current owner
From public records · entity-resolved
BLACKBOB INVESTORS LLC
Entity
Free & Clear · 0 yrs held
Mailing address
13790 S BLACKBOB RD, OLATHE, KS 66062-1932
Mailing matches property
Yes
Owner-occupied
Yes
Ownership since
—
Owner contacts — direct phone, email, and related entities
Decision-maker phone · Verified email · Related entities & filings
Owner contacts
Email · phone · related entities
Sales History
No recorded transactions
No recorded transactions found for this property.
Coming soon
Costs & Benchmarks
Operating expenses, capex projections, utility benchmarks, and submarket comparables — all in one view.
Coming soon
Risks
Flood, climate, environmental, title, and tenant-concentration risk — surfaced with mitigations and source citations.
Try Rey
Ask anything about this address in plain English.
“Is 15.6% cap rate sustainable?” · “Best tenant mix for BU1?” · “What’s the redev upside?”
Full reports are paid
Unlock the full Property Analytics report
Start free for 7 days — no card required. Full owner contacts, all 4 valuations with methodology, refine flow, comparable adjustments, foot-traffic deep dive, export to PDF / CSV.


