Conventional Restaurant with Two
For Sale
$1,699,000
Miami Beach, FL 33169, Miami Beach, FL 33169
Business Opportunity, Miami Beach, FL
Property Size2,750 SF
Price / SF$617.82
Days on Market292
Property Features
General Information
Property type
Commercial Sale
Property subtype
Other
Zoning description
Flood Zone
Parking
12
Parking features
On Street
Security features
Security System
Subdivision
42
Standard status
Active
Taxes and HOA fees
Tax Year
2023
Tax Annual Amount
111111111
Utilities
Sewer type
Public Sewer
Heating system
Central
Cooling system
Central Air
Water source
Public
Building Details
Flooring type
Tile, Hardwood, Wood
Building materials
Block
Listing Agency:
Optimar International Realty
(305) 947-0477
Listed By:
Ali Karan PLLC · License #3520948
(305) 527-9956
Added: Dec 29, 2025
Changed: Oct 17
Last Checked: Oct 17 at 4:06AM
MLS# A11510964
Copyright © 2026 Miami REALTORS®. All rights reserved. All information provided by the listing agent/broker is deemed reliable but is not guaranteed and should be independently verified.

Ask AI about this property
Review the available facts, identify missing information and prepare questions for the agent.
Investment Insights
Based on property information with market context.
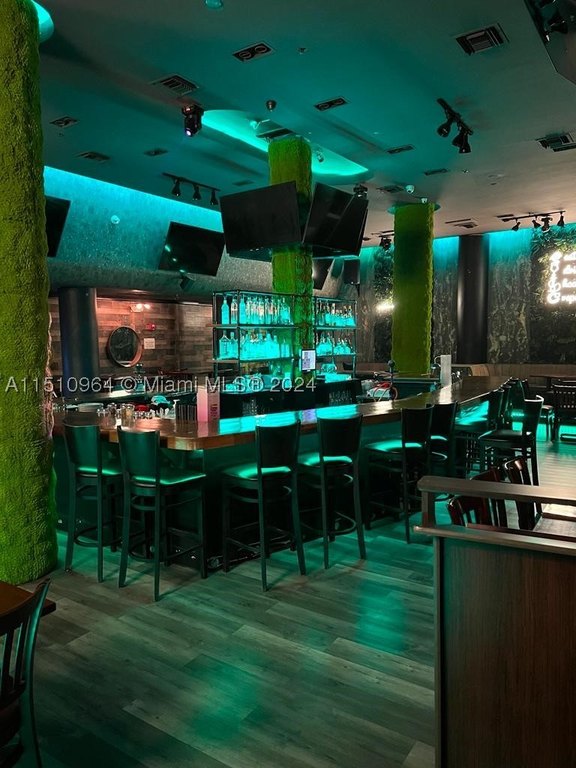
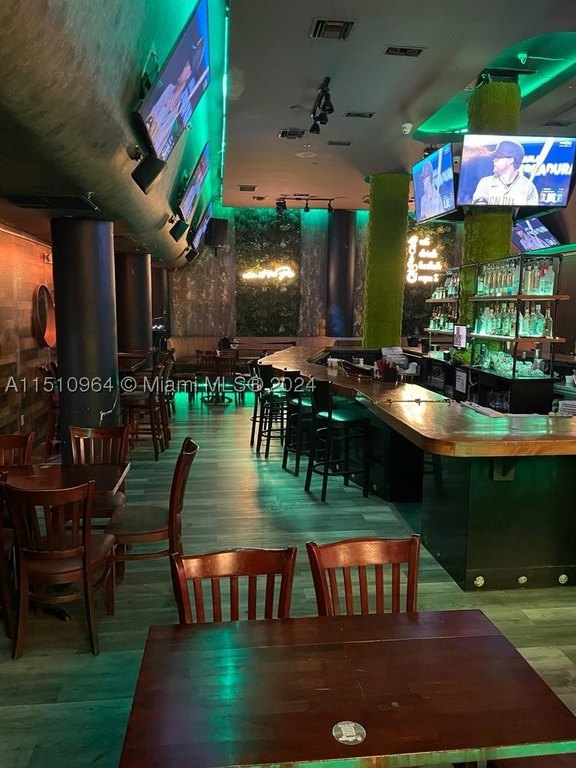
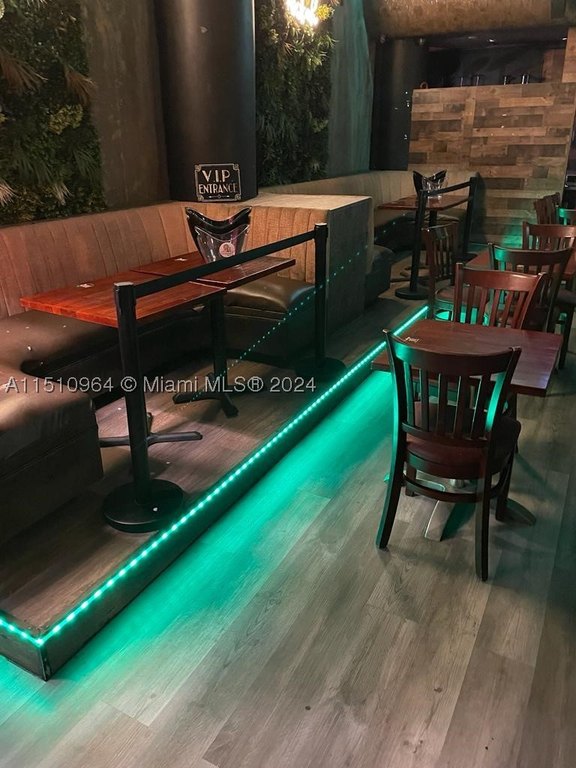
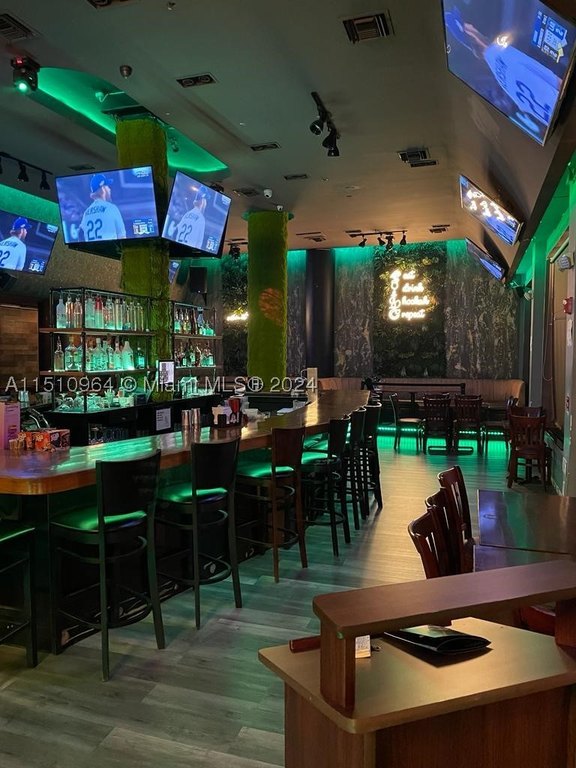
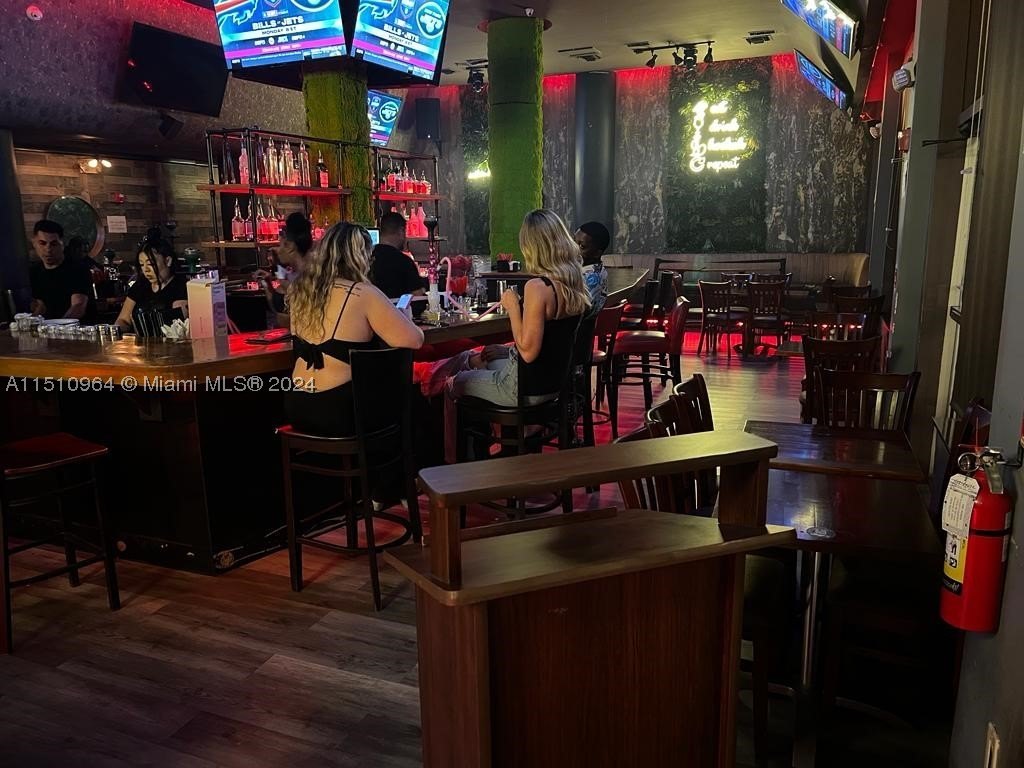
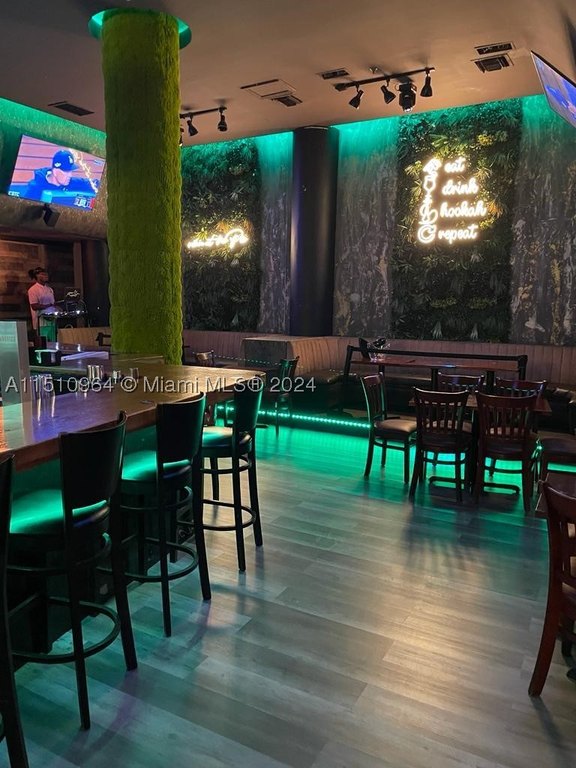
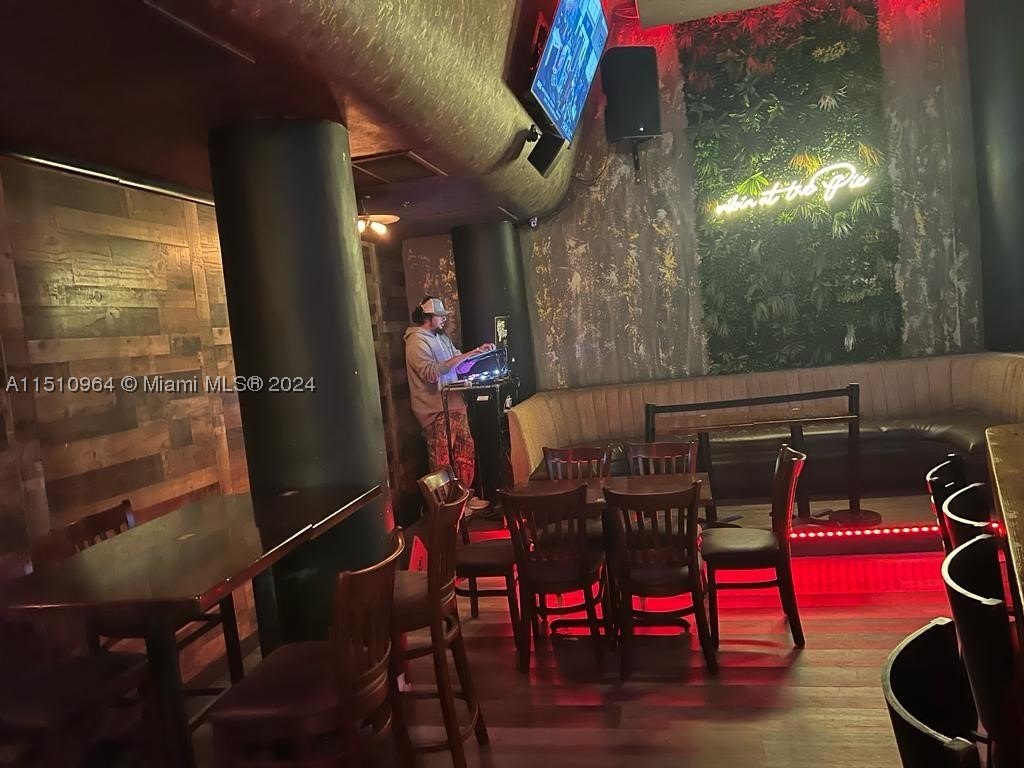
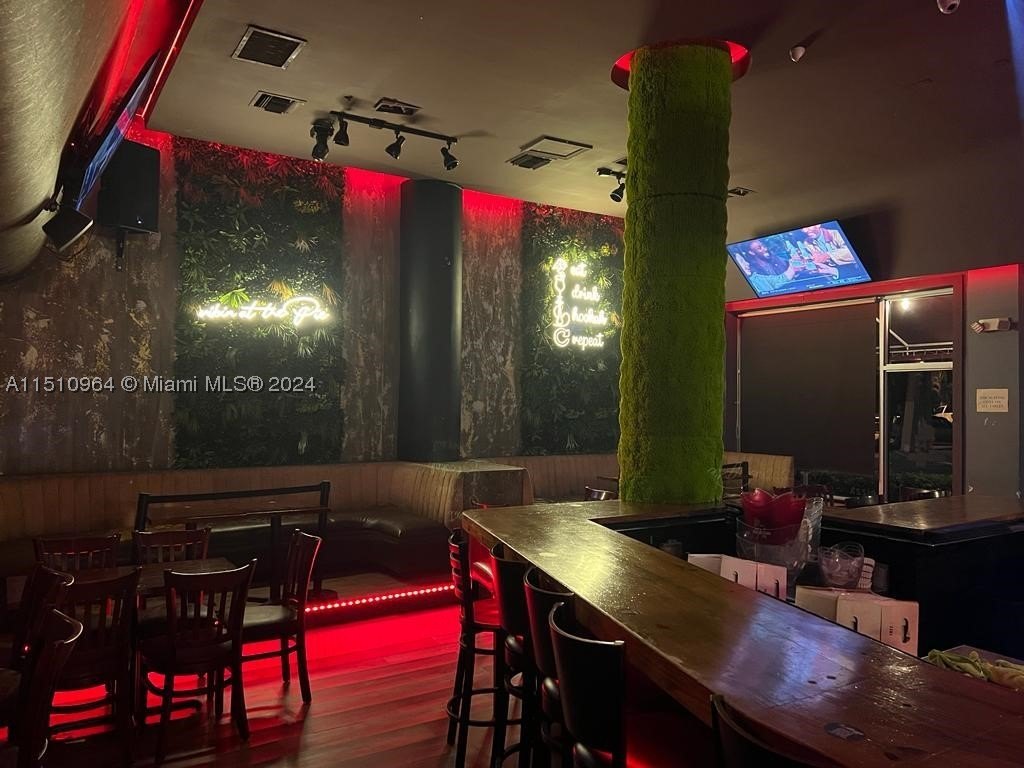
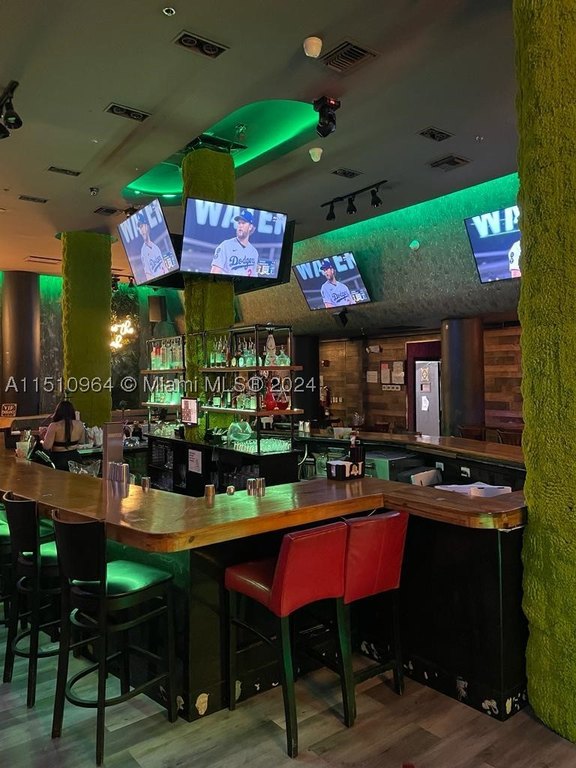
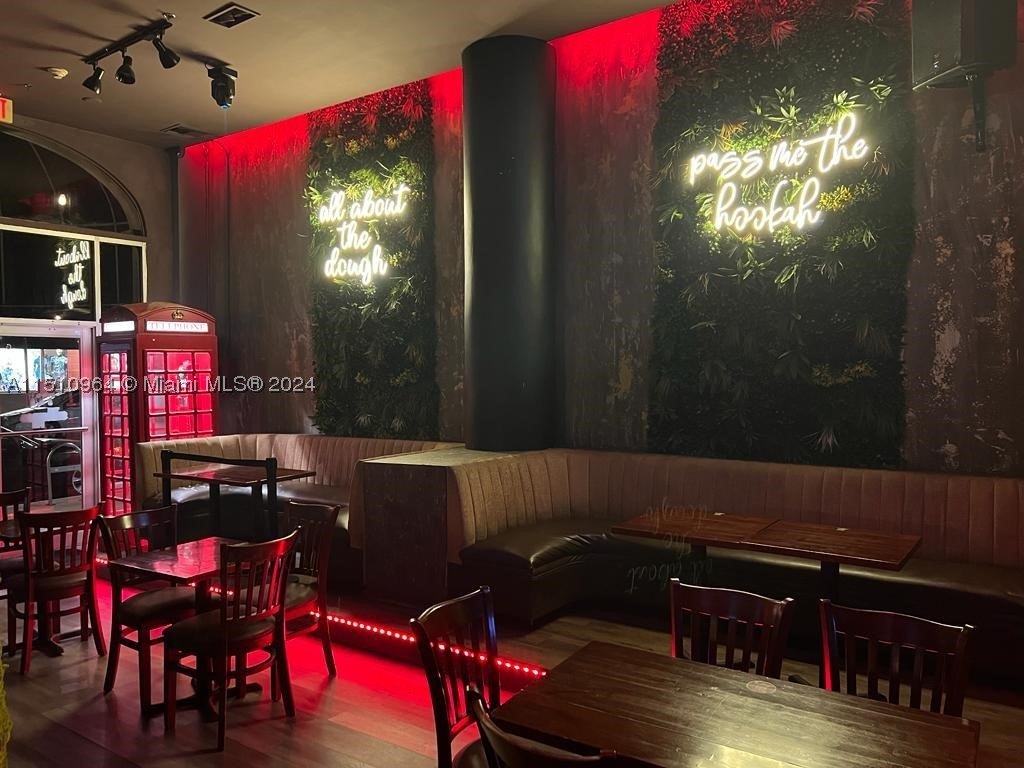
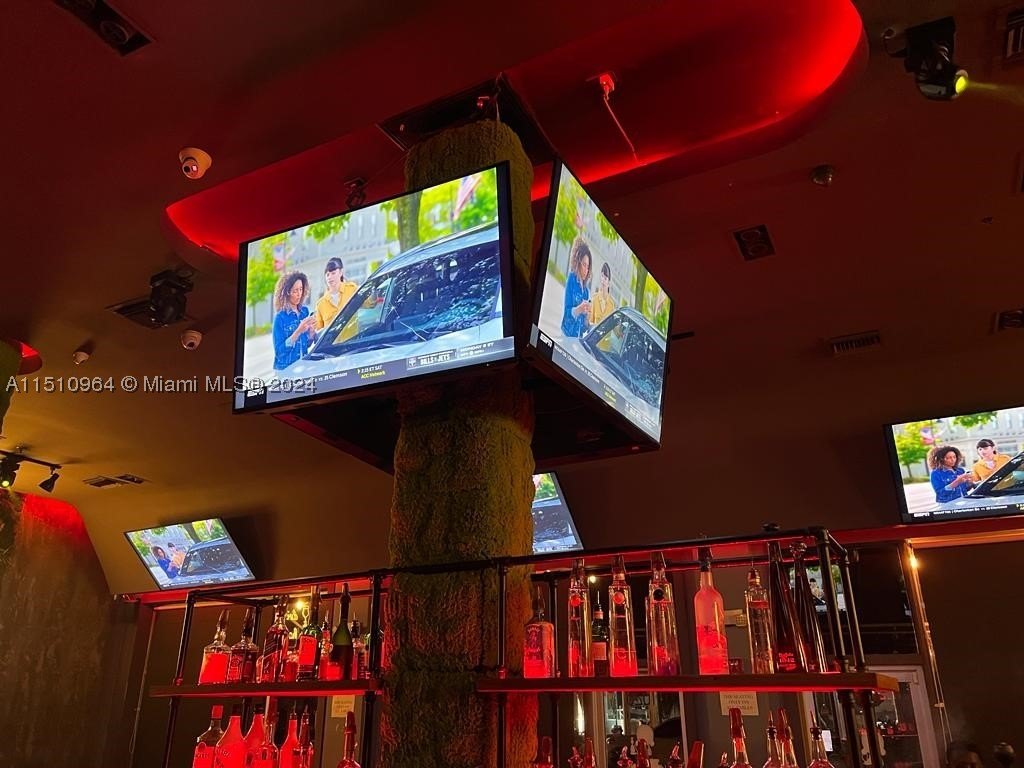
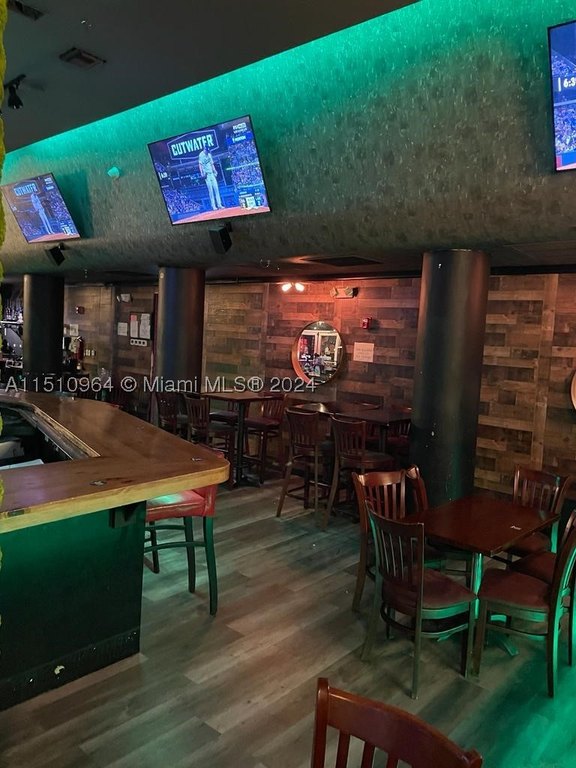
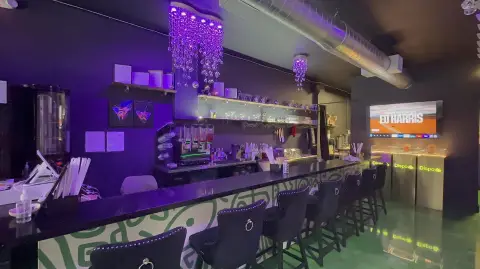
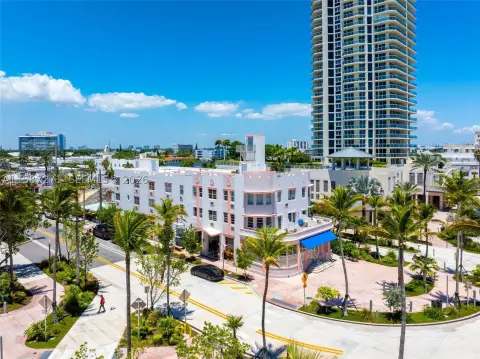
This conventional restaurant occupies 2,750 square feet on a corner along Lincoln Road in Miami Beach. The layout accommodates 122 seats and includes two bars, a fully renovated kitchen, central heating and cooling, and block construction. On-street parking and public water and sewer service are provided.
The operation holds a full liquor license and may remain open until 5 a.m., supporting a late-night restaurant and bar format. A newly opened nightclub is located nearby, and the site is positioned within South Beach’s hospitality setting. The premises also include tile and wood flooring finishes.
The operation holds a full liquor license and may remain open until 5 a.m., supporting a late-night restaurant and bar format. A newly opened nightclub is located nearby, and the site is positioned within South Beach’s hospitality setting. The premises also include tile and wood flooring finishes.
Key Highlights
- 2,750‑square‑foot restaurant with seating for 122
- Corner location on Lincoln Road in Miami Beach
- Full liquor license included
Financial Insights
Estimated NOI and Cap Rate
NOI / Yr
$52,940
Cap Rate
3.12%
Suggested Prices Based on Cap Rates
Cap Rate 5%
$1,058,800
$1.1M
Cap Rate 7%
$756,286
$756.3K
Cap Rate 9%
$588,222
$588.2K
Market Conditions
NOI Build-Up for 2,750 SF
Gross rent
$75.9K $27.60/SF
− Vacancy
−$5.3K −$1.93/SF
EGI
$70.6K $25.67/SF
− OpEx
−$17.6K −$6.42/SF
NOI
$52.9K $19.25/SF
Area
Miami-Dade County, FL
Vacancy
7.00%
Lease Rate
$27.60 /SF/Yr
Expense Ratio
25.00%
Simulate Cap Rate and NOI
Suggested Prices Based on Cap Rates
Cap Rate 5%
$1,058,800
Cap Rate 7%
$756,286
Cap Rate 9%
$588,222
Alternative Uses
Best Use
Specialty Retail
$756.3K
$661.8K – $882.3K
NOI $52,940 @ 7.0% cap · market cap 3.12%
Second Best
—
—
no second resolved use
Theoretical Best
Office A
$1.40M
$1.22M – $1.63M
NOI $97,663 @ 7.0% cap · market cap 5.75%
Zoning and permitted uses should be independently verified with authorities.
How Realmo checks its estimates
Property Analytics
Unlock full access to Insights
Subscribe to Realmo Intelligence
Open Analytics
Current Use
Lease Details
Turnkey business
Opportunity
Yes
Liquor license
Location Intelligence
Trade Area within ½ mile
2,175
Businesses Nearby
Under-served
Demand for This Use
Explore this area
Business Placement
Demographics for 33169, FL
42,308
Population
14,815
Households
2.9
Avg Household Size
37
Median Age
22%
College-Educated
85%
High-School Grad
6.8 sq mi
ZIP Area
6,222
Density / Sq Mi
$59,686
Median Household Income
$34,327
Median Earnings
$1,536
Median Rent
$352,800
Median Home Value
Check the figures for this property
Cap Rate, Value Estimation, Potential NOI and more
View Realmo Analytics
Market
Vacancy Rate% for Retail in South region





Frequently Asked Questions
What type of property is this?
Conventional restaurant - Corner hospitality venue on Lincoln Road with a renovated kitchen and late-night operating capability.
Where is this conventional restaurant located?
The property is located at Miami Beach, FL.
What is the asking price?
The asking price for this property is $1,699,000.
What are key features of this property?
This property features: 2,750‑square‑foot restaurant with seating for 122; Corner location on Lincoln Road in Miami Beach; Full liquor license included


