Turn-Key Hair Salon
For Sale
Contact for pricing
E Central Parkway 102, Cincinnati, OH 45202
Turn-key hair salon with 9 chairs, backwash sinks, and optional live-work setup in an Art-Deco building.
Property Size1,665 SF
Price / SF$195.14
Days on Market162
Property Features for E Central Parkway 102
General Information
Standard status
Active
Size
1,665 SF
Total Parking Spaces
2
Property subtype
Retail
Additional Details
Business Included
Yes
Clear Height
12 ft
Building Details
Year Built
1936
Tenancy
Single
Listing Agency:
Coldwell Banker West Shell Cincinnati
Listed By:
William Draznik · License #OH 2006001330
Source:
Crexi
Added: May 1
Changed: Sep 29
Last Checked: Oct 7 at 10:18AM
Displayed information is deemed reliable but is not guaranteed and should be independently verified. All listing content including descriptions, pricing, images are the copyrighted material of Coldwell Banker West Shell Cincinnati
Investment Insights
Based on property information with market context.
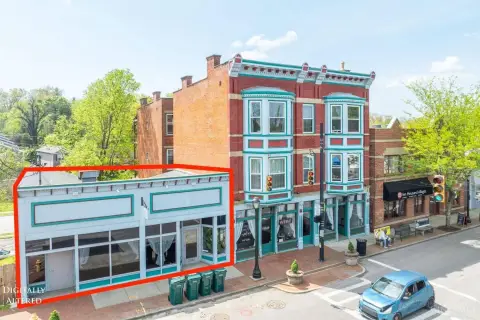
This turn-key hair salon is located in the Art-Deco American Building at 30 E. Central. The current interior layout includes 9 chairs, 3 shampoo backwash sinks, 2 dryer chairs, and 1 waxing chair. The space also has 2 washers, 1 dryer, and 2 compartment sink facilities located in a convenient first-floor storage room. Soaring 12-foot ceilings support an open feel and bring in natural light. The mezzanine level is equipped with a kitchenette and bathroom and offers potential for live/work use. Salon chairs are negotiable. The property is sold as-is, and the entry red sofa, entry mirror, and art are excluded from the sale.
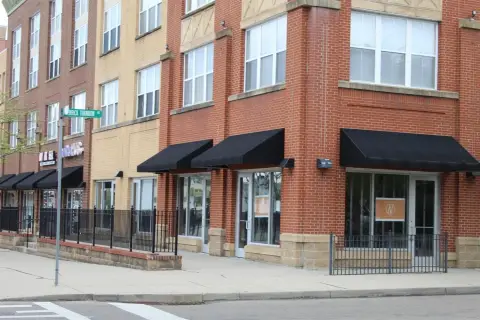
Access is provided through a storefront setting with excellent visibility, positioned at the intersection of Central Parkway and Walnut. The offering includes monthly HOA fees of $800, which covers two deeded parking spaces in the attached garage. Additional on-street and garage parking is available nearby for clients, and the property is located near north and south Streetcar lines.
For buyers, this configuration supports immediate salon operations with established workstations and built-in wash, laundry, and utility functionality. The mezzanine kitchenette and bathroom can also support flexibility for an owner-operator live/work arrangement, subject to the buyer’s intended use. Showings are scheduled for Mondays only, with notice required to avoid disrupting current business operations.
Access is provided through a storefront setting with excellent visibility, positioned at the intersection of Central Parkway and Walnut. The offering includes monthly HOA fees of $800, which covers two deeded parking spaces in the attached garage. Additional on-street and garage parking is available nearby for clients, and the property is located near north and south Streetcar lines.
For buyers, this configuration supports immediate salon operations with established workstations and built-in wash, laundry, and utility functionality. The mezzanine kitchenette and bathroom can also support flexibility for an owner-operator live/work arrangement, subject to the buyer’s intended use. Showings are scheduled for Mondays only, with notice required to avoid disrupting current business operations.
Key Highlights
- Turn‑key hair salon in the Art‑Deco American Building (30 E. Central) built in 1936
- Salon setup includes 9 chairs, 3 shampoo backwash sinks, 2 dryer chairs, and 1 waxing chair
- 12‑ft ceilings and natural light; includes 2 washers, 1 dryer, and 2‑compartment sink in a 1st‑floor storage room
Financial Insights
Estimated NOI and Cap Rate
NOI / Yr
$19,196
Cap Rate
5.91%
Suggested Prices Based on Cap Rates
Cap Rate 5%
$383,920
$383.9K
Cap Rate 7%
$274,229
$274.2K
Cap Rate 9%
$213,289
$213.3K
Market Conditions
NOI Build-Up for 1,665 SF
Gross rent
$30.0K $18.00/SF
− Vacancy
−$2.5K −$1.53/SF
EGI
$27.4K $16.47/SF
− OpEx
−$8.2K −$4.94/SF
NOI
$19.2K $11.53/SF
Area
Cincinnati, OH
Vacancy
8.50%
Lease Rate
$18.00 /SF/Yr
Expense Ratio
30.00%
Simulate Cap Rate and NOI
Suggested Prices Based on Cap Rates
Cap Rate 5%
$383,920
Cap Rate 7%
$274,229
Cap Rate 9%
$213,289
Alternative Uses
Best Use
Retail
$274.2K
$240.0K – $319.9K
NOI $19,196 @ 7.0% cap · market cap 5.91%
Second Best
—
—
no second resolved use
Theoretical Best
Office A
$331.0K
$289.6K – $386.1K
NOI $23,168 @ 7.0% cap · market cap 7.13%
Zoning and permitted uses should be independently verified with authorities.
Property Analytics
Unlock full access to Insights
Subscribe to Realmo Intelligence
Open Analytics
Current Use
Lease Details
12 ft
Clear height
Single-tenant
Tenancy
Turnkey business
Opportunity
Location Intelligence
Trade Area within ½ mile
7,340
Businesses Nearby
Under-served
Demand for This Use
Explore this area
Business Placement
Demographics for 45202, OH
16,883
Population
11,432
Households
1.5
Avg Household Size
34
Median Age
63%
College-Educated
91%
High-School Grad
2.7 sq mi
ZIP Area
6,253
Density / Sq Mi
$87,930
Median Household Income
$63,901
Median Earnings
$1,524
Median Rent
$444,000
Median Home Value
Check the figures for this property
Cap Rate, Value Estimation, Potential NOI and more
View Realmo Analytics
Market
Vacancy Rate% for Retail in Cincinnati, OH

Questions? Ask Rey
Realmo’s AI knows this listing — price, zoning, demand, history. Ask anything.




Similar Off Market Nearby
- Gronauer Florist — 1 W 4th St #120, Cincinnati, OH 45202, United States
- I Am Blossoms — 407 Vine St, Cincinnati, OH 45202
- Murrelle's Florist — 631 Main St, Cincinnati, OH 45202
- The Budding Florist — 1817 Elm St, Cincinnati, OH 45202
- Gia and the Blooms - Findlay Market — 1801 Race St, Cincinnati, OH 45202
Frequently Asked Questions
What type of property is this?
Storefront property - Turn-key hair salon with 9 chairs, backwash sinks, and optional live-work setup in an Art-Deco building.
Where is this storefront property located?
The property is located at E Central Parkway 102 Cincinnati, OH.
What is the asking price?
The asking price for this property is $324,900.
What are key features of this property?
This property features: Turn‑key hair salon in the Art‑Deco American Building (30 E. Central) built in 1936; Salon setup includes 9 chairs, 3 shampoo backwash sinks, 2 dryer chairs, and 1 waxing chair; 12‑ft ceilings and natural light; includes 2 washers, 1 dryer, and 2‑compartment sink in a 1st‑floor storage room


