Retail Showroom with Warehouse
For Sale
$895,000
Address Not Disclosed, Cocoa, FL
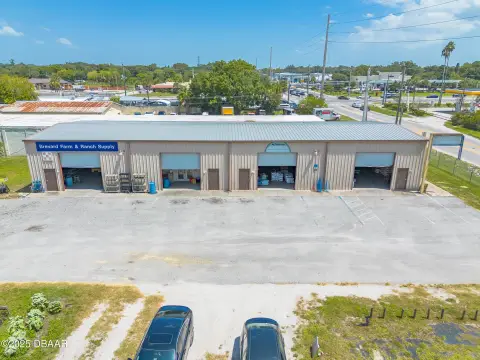
Retail showroom with warehouse, located on US-1 in Cocoa.
Property Size5,129 SF
Price / SF$174.50
Days on Market319
Property Features for Address Not Disclosed
General Information
Standard status
Active
Size
5,129 SF
Property subtype
Retail
Building Details
Building Size
5,129 SF
Year Built
1967
Listed By:
James Flint, CCIM · License #FL #BK3313539
(321) 252-9090
Source:
Sperrycga
Added: Nov 21, 2025
Changed: Sep 12
Last Checked: Oct 5 at 4:33PM
Displayed information is deemed reliable but is not guaranteed and should be independently verified. All listing content including descriptions, pricing, images are the copyrighted material of James Flint, CCIM
Investment Insights
Based on property information with market context.
This immaculately maintained retail showroom includes an 1100 square foot warehouse. Currently operating as a furniture store, the property has been at this location for 16 years. It features direct frontage on US-1, with a traffic count of 29,000 vehicles per day. The location is less than 1000 feet from the rumored Brightline Train station, where the company purchased 33 acres of land in 2022. The property includes two large showrooms, plus the warehouse which has a 14-foot roll-up door for deliveries. The building has new roofs and newer AC systems. The property is less than 1 mile from the Beachline (528) Interchange. The City of Cocoa is located in Central Brevard County, also known as the Space Coast. Cocoa is near Interstate 95, State Roads 528, 520 and 524 and within minutes of Port Canaveral, Kennedy Space Center and beaches. Cocoa is a short drive from Orlando International Airport and area attractions. Historic Cocoa Village has events taking place nearly every weekend, including family-friendly celebrations. The historic downtown shopping district offers stores and restaurants with waterfront views and historic venues. Landmarks include the Historic Cocoa Village Playhouse, Porcher House, Derby Street Chapel, and the Moore Center.
Key Highlights
- Prime US‑1 frontage with high traffic (29,000 vehicles per day).
- Proximity (less than 1000 feet) to the rumored Brightline Train station.
- Immaculately maintained showroom and warehouse totaling 5129 SF.
Financial Insights
Estimated NOI and Cap Rate
NOI / Yr
$59,132
Cap Rate
6.61%
Suggested Prices Based on Cap Rates
Cap Rate 5%
$1,182,640
$1.2M
Cap Rate 7%
$844,743
$844.7K
Cap Rate 9%
$657,022
$657.0K
Market Conditions
NOI Build-Up for 5,129 SF
Gross rent
$92.3K $18.00/SF
− Vacancy
−$7.8K −$1.53/SF
EGI
$84.5K $16.47/SF
− OpEx
−$25.3K −$4.94/SF
NOI
$59.1K $11.53/SF
Area
Brevard County, FL
Vacancy
8.50%
Lease Rate
$18.00 /SF/Yr
Expense Ratio
30.00%
Simulate Cap Rate and NOI
Suggested Prices Based on Cap Rates
Cap Rate 5%
$1,182,640
Cap Rate 7%
$844,743
Cap Rate 9%
$657,022
Alternative Uses
Best Use
Retail
$844.7K
$739.2K – $985.5K
NOI $59,132 @ 7.0% cap · market cap 6.61%
Second Best
Warehouse
$504.8K
$441.7K – $589.0K
NOI $35,339 @ 7.0% cap · market cap 3.95%
Theoretical Best
Office A
$1.35M
$1.18M – $1.58M
NOI $94,722 @ 7.0% cap · market cap 10.58%
Zoning and permitted uses should be independently verified with authorities.
Property Analytics
Current Use
Location Intelligence
Trade Area within ½ mile
499
Businesses Nearby
Under-served
Demand for This Use
Explore this area
Business Placement
Market
Vacancy Rate% for Industrial in South region

Questions? Ask Rey
Realmo’s AI knows this listing — price, zoning, demand, history. Ask anything.




Similar Off Market Nearby
- Dorothy's Ceramic Studio — 830 forrest ave, cocoa, fl 32922
Frequently Asked Questions
What type of property is this?
Showroom - Retail showroom with warehouse, located on US-1 in Cocoa.
Where is this showroom located?
The property is located at Address Not Disclosed Cocoa, FL.
What is the asking price?
The asking price for this property is $895,000.
What are key features of this property?
This property features: Prime US‑1 frontage with high traffic (29,000 vehicles per day).; Proximity (less than 1000 feet) to the rumored Brightline Train station.; Immaculately maintained showroom and warehouse totaling 5129 SF.