Endcap Retail/Office
For Sale
$399,000
C-13861 Alexandria Ln, Cedar Lake, IN
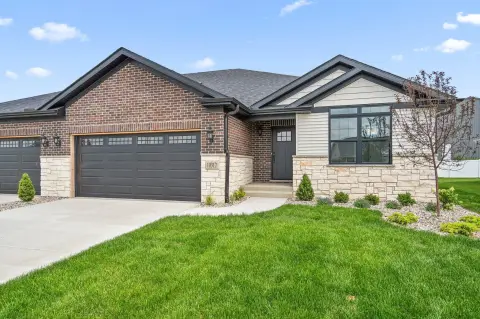
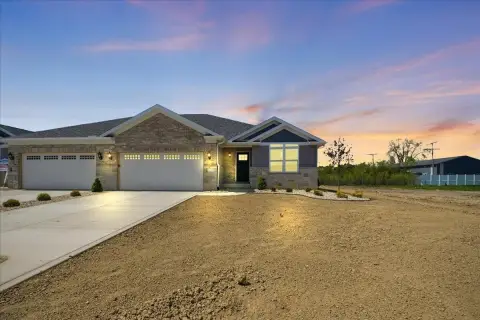
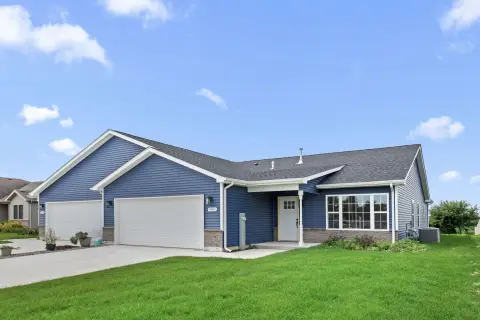
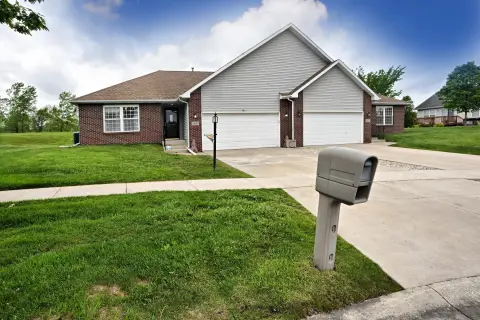
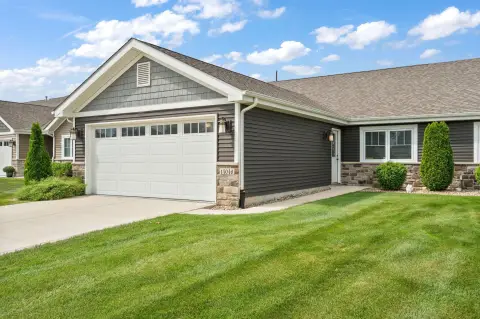
Modern four-unit building suite with drive-up windows on two end-cap faces for visibility and convenient access.
Property Size2,500 SF
Price / SF$159.60
Days on Market202
Property Features for C-13861 Alexandria Ln
General Information
Standard status
Active
Size
2,500 SF
Zoning
B3
Taxes and HOA fees
Annual Taxes
$1,200
Listing Agency:
McColly Real Estate
(219) 374-2121
Listed By:
Shelly Faber · License #RB14044470
(219) 775-1799
Source:
Exprealty
Added: Apr 2
Changed: Oct 19
Last Checked: Oct 19 at 7:52AM
Displayed information is deemed reliable but is not guaranteed and should be independently verified. All listing content including descriptions, pricing, images are the copyrighted material of McColly Real Estate

Ask AI about this property
Review the available facts, identify missing information and prepare questions for the agent.
Investment Insights
Based on property information with market context.
Located in Railside Business Park, this offering includes a 2,500-square-foot commercial space within a modern four-unit building. The suite is configured as an end-cap unit with drive-up windows on two sides, designed to support visibility and convenient, customer-friendly access.
The property is marketed as being in a fast-growing community in Northwest Indiana, with proximity to local schools and Route 41. In addition to the commercial space, six B3-zoned lots are available, providing flexibility for a range of community-focused uses.
The seller notes the B3-zoned lots may support business and professional offices, retail establishments, medical and dental facilities, restaurants and hotels, recreation and community centers, vocational and trade schools, senior centers or care facilities, and breweries.
The property is marketed as being in a fast-growing community in Northwest Indiana, with proximity to local schools and Route 41. In addition to the commercial space, six B3-zoned lots are available, providing flexibility for a range of community-focused uses.
The seller notes the B3-zoned lots may support business and professional offices, retail establishments, medical and dental facilities, restaurants and hotels, recreation and community centers, vocational and trade schools, senior centers or care facilities, and breweries.
Key Highlights
- 2,500 SF commercial space available in a modern four‑unit building for purchase or lease
- Drive‑up windows on two end‑cap faces for visibility and convenient access
- Six B3‑zoned lots available for a variety of community‑focused uses
Financial Insights
Estimated NOI and Cap Rate
NOI / Yr
$24,091
Cap Rate
6.04%
Suggested Prices Based on Cap Rates
Cap Rate 5%
$481,820
$481.8K
Cap Rate 7%
$344,157
$344.2K
Cap Rate 9%
$267,678
$267.7K
Market Conditions
NOI Build-Up for 2,500 SF
Gross rent
$36.0K $14.40/SF
− Vacancy
−$1.6K −$0.63/SF
EGI
$34.4K $13.77/SF
− OpEx
−$10.3K −$4.13/SF
NOI
$24.1K $9.64/SF
Area
Lake County, IN
Vacancy
4.40%
Lease Rate
$14.40 /SF/Yr
Expense Ratio
30.00%
Simulate Cap Rate and NOI
Suggested Prices Based on Cap Rates
Cap Rate 5%
$481,820
Cap Rate 7%
$344,157
Cap Rate 9%
$267,678
Alternative Uses
Best Use
Retail
$344.2K
$301.1K – $401.5K
NOI $24,091 @ 7.0% cap · market cap 6.04%
Second Best
—
—
no second resolved use
Theoretical Best
Specialty Retail
$697.9K
$610.7K – $814.2K
NOI $48,853 @ 7.0% cap · market cap 12.24%
Zoning and permitted uses should be independently verified with authorities.
How Realmo checks its estimates
Property Analytics
Current Use
Location Intelligence
Trade Area within ½ mile
64
Businesses Nearby
Explore this area
Business Placement
Market
Vacancy Rate% for Retail in Midwest region




Frequently Asked Questions
What type of property is this?
Retail space - Modern four-unit building suite with drive-up windows on two end-cap faces for visibility and convenient access.
Where is this retail space located?
The property is located at C-13861 Alexandria Ln Cedar Lake, IN.
What is the asking price?
The asking price for this property is $399,000.
What are key features of this property?
This property features: 2,500 SF commercial space available in a modern four‑unit building for purchase or lease; Drive‑up windows on two end‑cap faces for visibility and convenient access; Six B3‑zoned lots available for a variety of community‑focused uses


