Updated Two-Unit
For Sale
$562,500
A-4212 Se 19th Pl, Cape Coral, FL 33991
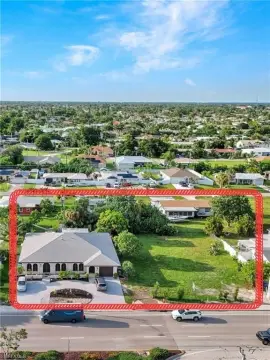
Mirror-image residences feature tiled interiors, granite counters, and stainless steel kitchen appliances.
Property Size2,588 SF
Price / SF$217.35
Days on Market111
Property Features for A-4212 Se 19th Pl
General Information
Standard status
Active
Size
2,588 SF
Property subtype
Residential Income
Units
Unit Mix
2 x 3BR/2BA
Multifamily Units
2
Taxes and HOA fees
Annual Taxes
$6,666
Listing Agency:
Home Hunters USA, Inc
(239) 939-0001
Listed By:
Katherine McCaw · License #251536436
(239) 671-3511
Source:
Exprealty
Added: Jun 30
Changed: Oct 6
Last Checked: Oct 16 at 2:40PM
Displayed information is deemed reliable but is not guaranteed and should be independently verified. All listing content including descriptions, pricing, images are the copyrighted material of Home Hunters USA, Inc

Ask AI about this property
Review the available facts, identify missing information and prepare questions for the agent.
Investment Insights
Based on property information with market context.
This duplex contains 2,588 SF with two matching residences, each offering three bedrooms and two bathrooms. Interior features include tile flooring throughout, granite kitchen countertops, and stainless steel appliances. The roof was replaced in 2023, while both bathrooms were renovated in 2025. A six-foot privacy fence separates the units.
The property is located at A-4212 SE 19th Pl in Cape Coral, just off Beach Parkway and within convenient reach of the South Cape Coral Bridge. Jaycee Park, a newly completed 11.8-acre park with a fitness station, gazebo, playground, grills, and additional amenities, is one block away.
The property is located at A-4212 SE 19th Pl in Cape Coral, just off Beach Parkway and within convenient reach of the South Cape Coral Bridge. Jaycee Park, a newly completed 11.8-acre park with a fitness station, gazebo, playground, grills, and additional amenities, is one block away.
Key Highlights
- 2,588 SF duplex with two matching 3‑bedroom, 2‑bath residences
- New roof installed in 2023
- Both bathrooms renovated in 2025
Financial Insights
Estimated NOI and Cap Rate
NOI / Yr
$34,256
Cap Rate
6.09%
Suggested Prices Based on Cap Rates
Cap Rate 5%
$685,120
$685.1K
Cap Rate 7%
$489,371
$489.4K
Cap Rate 9%
$380,622
$380.6K
Market Conditions
NOI Build-Up for 2,588 SF
Gross rent
$51.2K $19.80/SF
− Vacancy
−$2.3K −$0.89/SF
EGI
$48.9K $18.91/SF
− OpEx
−$14.7K −$5.67/SF
NOI
$34.3K $13.24/SF
Area
Cape Coral, FL
Vacancy
4.50%
Lease Rate
$19.80 /SF/Yr
Expense Ratio
30.00%
Simulate Cap Rate and NOI
Suggested Prices Based on Cap Rates
Cap Rate 5%
$685,120
Cap Rate 7%
$489,371
Cap Rate 9%
$380,622
Alternative Uses
Best Use
Multifamily LT 5
$489.4K
$428.2K – $570.9K
NOI $34,256 @ 7.0% cap · market cap 6.09%
Second Best
Apartment 5plus
$453.5K
$396.8K – $529.1K
NOI $31,745 @ 7.0% cap · market cap 5.64%
Theoretical Best
Office A
$671.5K
$587.6K – $783.4K
NOI $47,006 @ 7.0% cap · market cap 8.36%
Zoning and permitted uses should be independently verified with authorities.
How Realmo checks its estimates
Property Analytics
Current Use
Lease Details
2
Residential units
Location Intelligence
Trade Area within ½ mile
64
Businesses Nearby
Explore this area
Business Placement
Demographics for 33991, FL
26,381
Population
11,563
Households
2.3
Avg Household Size
45
Median Age
25%
College-Educated
94%
High-School Grad
12.8 sq mi
ZIP Area
2,061
Density / Sq Mi
$82,927
Median Household Income
$41,773
Median Earnings
$1,914
Median Rent
$351,100
Median Home Value
Market
Vacancy Rate% for Multifamily in South region




Frequently Asked Questions
What type of property is this?
Duplex - Mirror-image residences feature tiled interiors, granite counters, and stainless steel kitchen appliances.
Where is this duplex located?
The property is located at A-4212 Se 19th Pl Cape Coral, FL.
What is the asking price?
The asking price for this property is $562,500.
What are key features of this property?
This property features: 2,588 SF duplex with two matching 3‑bedroom, 2‑bath residences; New roof installed in 2023; Both bathrooms renovated in 2025


