Former Convenience Store on Route
For Sale
Contact for pricing
9971 NY-16, Delevan, NY 14042
1,280 sq ft building on 2.02 acres in Lime Lake.
Property Size1,280 SF
Lot Size2.02 Acres
Price / SF$105.47
Days on Market900
Property Features for 9971 NY-16
General Information
Standard status
Active
Size
1,280 SF
Class
B
Lot size
2.02 Acres
Property subtype
Retail
Zoning
Commercial
Investment Type
Value Add
Building Details
Year Built
1970
Year Renovated
2022
Buildings
1
Stories
1
Units
1
Listing Agency:
Hawley Development Corp
Listed By:
John Pastore · License #FLBO/ FSBO
Source:
Crexi
Added: Apr 30, 2024
Changed: Oct 15
Last Checked: Oct 16 at 6:42AM
Displayed information is deemed reliable but is not guaranteed and should be independently verified. All listing content including descriptions, pricing, images are the copyrighted material of Hawley Development Corp

Ask AI about this property
Review the available facts, identify missing information and prepare questions for the agent.
Investment Insights
Based on property information with market context.
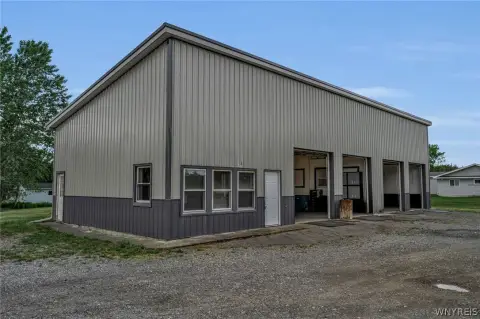
This 1,280 sq. ft. building, formerly a convenience store, is located on Route 16 in Lime Lake. Situated on 2.02 acres, the property is approximately 8 miles north of the village of Franklinville and 4 miles south of the village of Delevan, within the Lime Lake cottage district. Capital improvements were made in 2022, including a new Heil 2 stage forced air furnace, a water filtration system, and exterior facade upgrades. The building includes walk-in coolers, a 3-bay sink, a utility room, a bathroom, and a sales area. The fuel canopy and equipment have been removed from the site. The property also features a 0.66-acre pond. Electric and gas services are available on-site, along with a water well and a public sewer system. The daily traffic count is approximately 5,000 cars.
Key Highlights
- High‑traffic location on Route 16 with approximately 5,000 cars daily.
- Large 2.02‑acre lot featuring a 0.66‑acre pond.
- Recent (2022) capital improvements including a new Heil 2‑stage forced air furnace, water filtration system, and exterior facade upgrades.
Financial Insights
Estimated NOI and Cap Rate
NOI / Yr
$11,612
Cap Rate
8.60%
Suggested Prices Based on Cap Rates
Cap Rate 5%
$232,240
$232.2K
Cap Rate 7%
$165,886
$165.9K
Cap Rate 9%
$129,022
$129.0K
Market Conditions
NOI Build-Up for 1,280 SF
Gross rent
$18.4K $14.40/SF
− Vacancy
−$1.8K −$1.44/SF
EGI
$16.6K $12.96/SF
− OpEx
−$5.0K −$3.89/SF
NOI
$11.6K $9.07/SF
Area
Cattaraugus County, NY
Vacancy
10.00%
Lease Rate
$14.40 /SF/Yr
Expense Ratio
30.00%
Simulate Cap Rate and NOI
Suggested Prices Based on Cap Rates
Cap Rate 5%
$232,240
Cap Rate 7%
$165,886
Cap Rate 9%
$129,022
Alternative Uses
Best Use
Specialty Retail
$236.5K
$206.9K – $275.9K
NOI $16,554 @ 7.0% cap · market cap 12.26%
Second Best
Retail
$165.9K
$145.2K – $193.5K
NOI $11,612 @ 7.0% cap · market cap 8.60%
Theoretical Best
Healthcare Medical
$253.0K
$221.4K – $295.2K
NOI $17,709 @ 7.0% cap · market cap 13.12%
Zoning and permitted uses should be independently verified with authorities.
How Realmo checks its estimates
Property Analytics
Current Use
Location Intelligence
Trade Area within ½ mile
10
Businesses Nearby
Well-served
Demand for This Use
Explore this area
Business Placement
Demographics for 14042, NY
3,891
Population
2,052
Households
1.9
Avg Household Size
40
Median Age
17%
College-Educated
86%
High-School Grad
46.7 sq mi
ZIP Area
83
Density / Sq Mi
$50,625
Median Household Income
$32,900
Median Earnings
$865
Median Rent
$105,800
Median Home Value
Market
Vacancy Rate% for Retail in Northeast region

Frequently Asked Questions
What type of property is this?
Grocery and convenience store - 1,280 sq ft building on 2.02 acres in Lime Lake.
Where is this grocery and convenience store located?
The property is located at 9971 NY-16 Delevan, NY.
What is the asking price?
The asking price for this property is $135,000.
What are key features of this property?
This property features: High‑traffic location on Route 16 with approximately 5,000 cars daily.; Large 2.02‑acre lot featuring a 0.66‑acre pond.; Recent (2022) capital improvements including a new Heil 2‑stage forced air furnace, water filtration system, and exterior facade upgrades.


