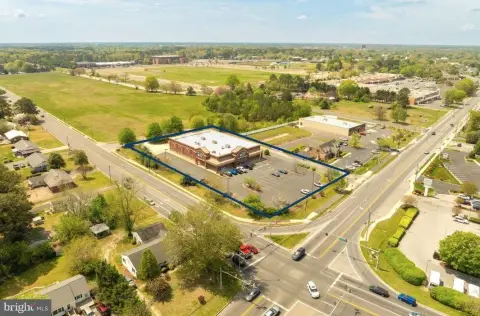
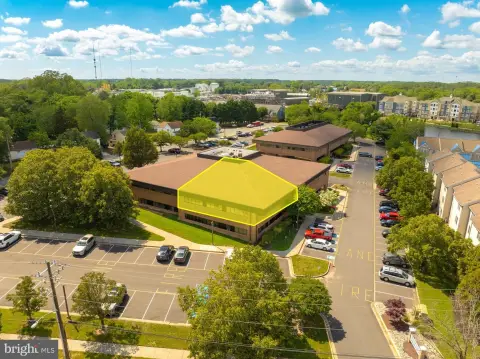
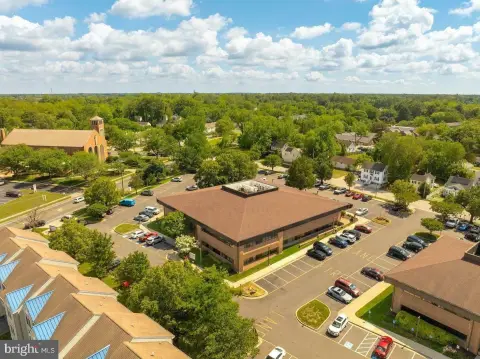
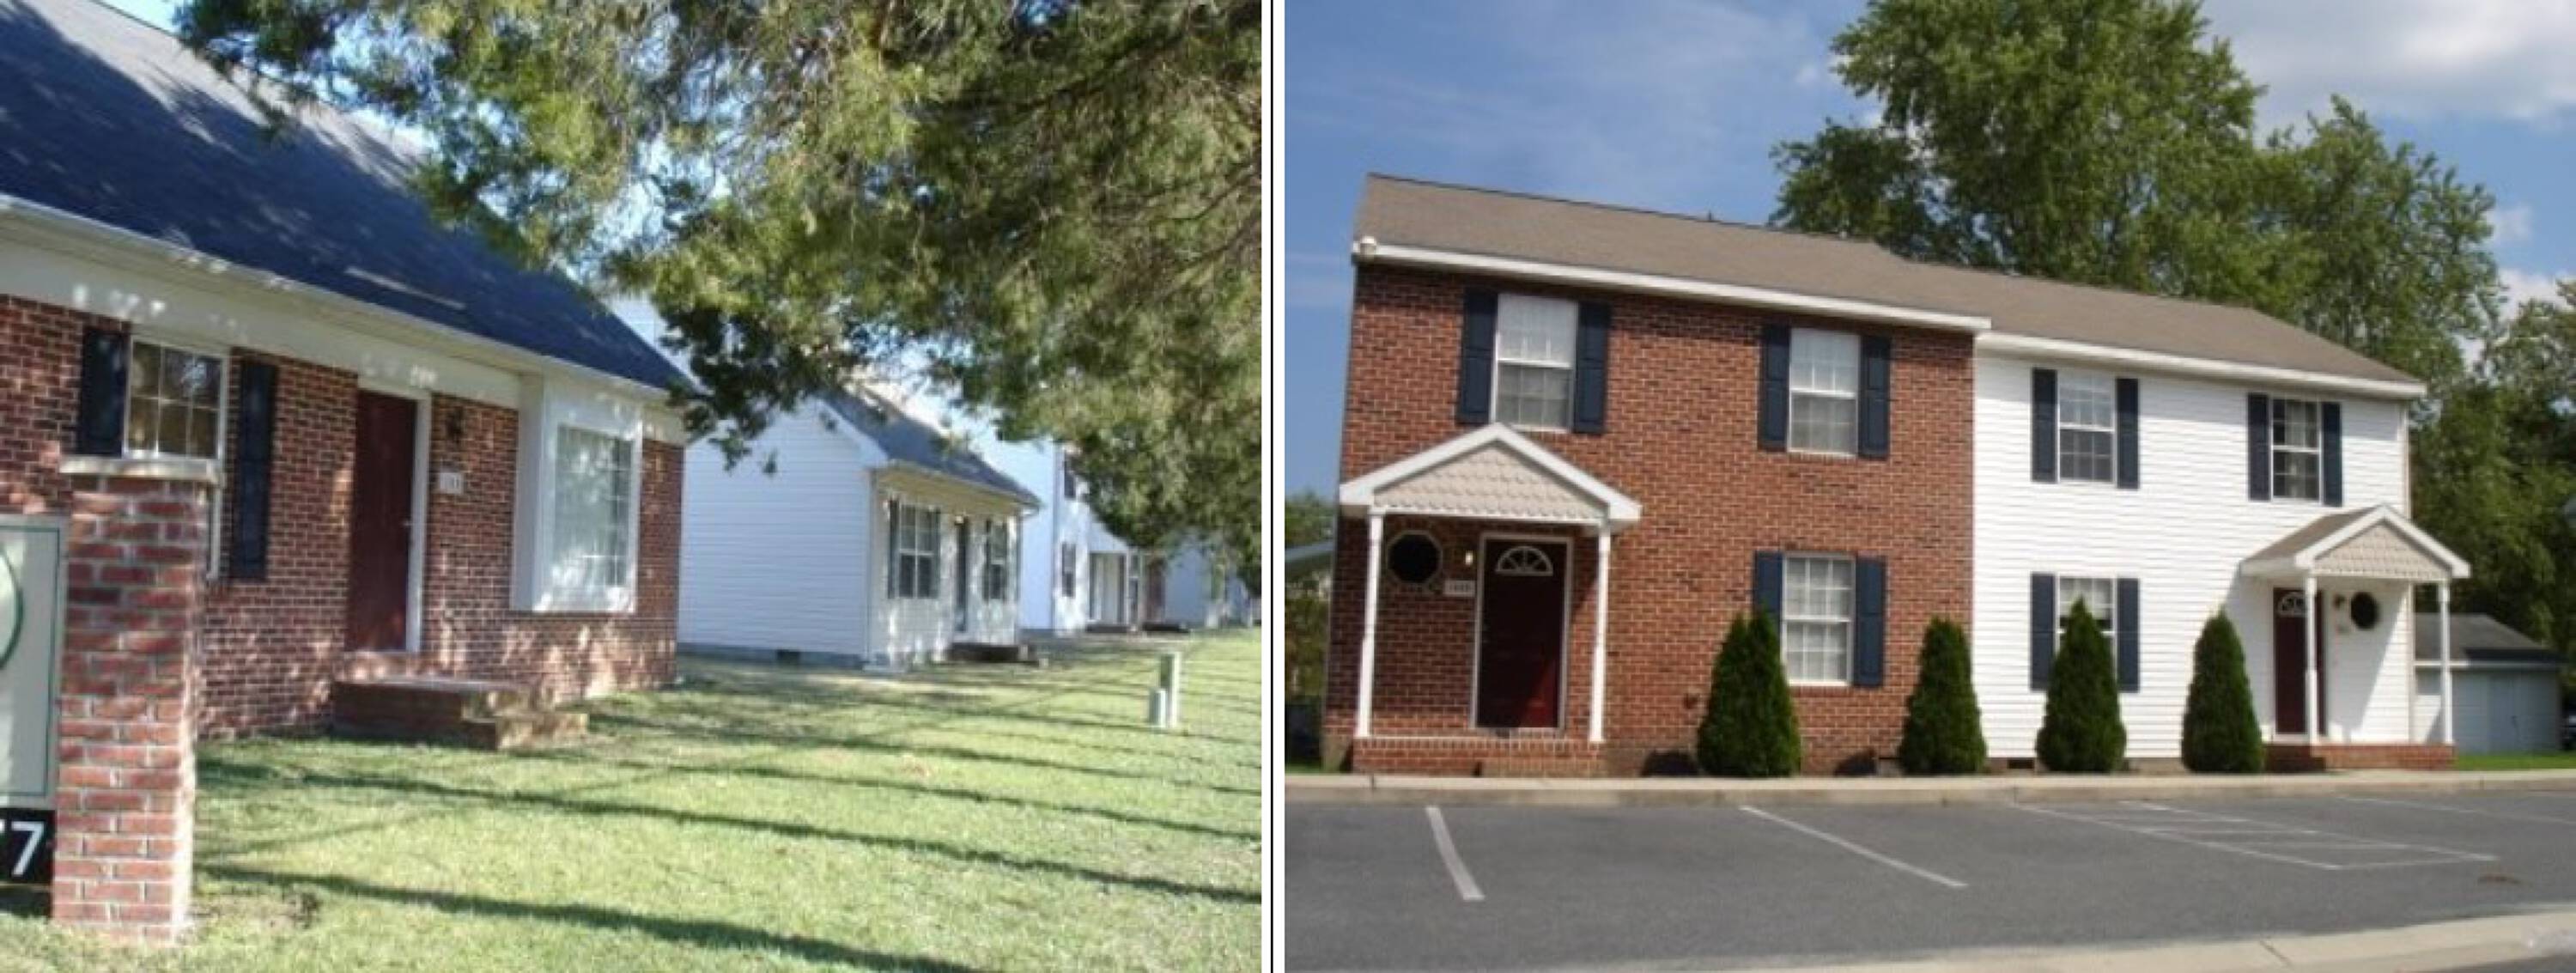
100 Cedar Crossing Rd, Salisbury, MD 21804
58 units, 228 bedrooms near Salisbury University campus.
- Added:
- Feb 10, 2023
- Days on Market:
- 1242
- Last Refresh:
- Jun 28 at 3:20 am
Property Features for 100 Cedar Crossing Rd
General Information
- Standard status
- Active
- Property subtype
- Multifamily

Listing office Rinnier Development Company
Listing date Feb 10, 2023
Source Crexi
Displayed information is deemed reliable but is not guaranteed and should be independently verified.
All listing content including descriptions, pricing, images are the copyrighted material of Rinnier Development Company
HighLights
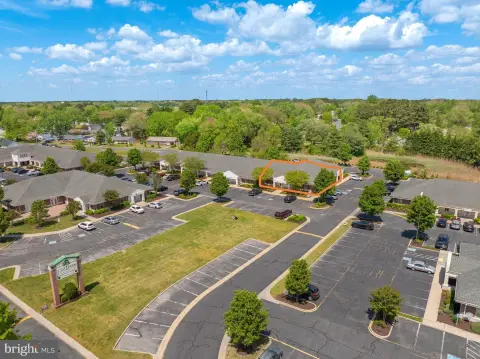
- Portfolio of 58 individual units with 228 bedrooms.
- Walking distance to Salisbury University campus and sports fields.
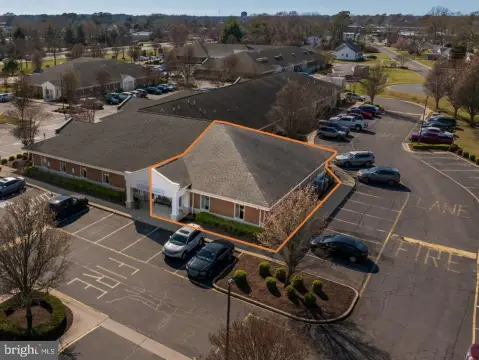
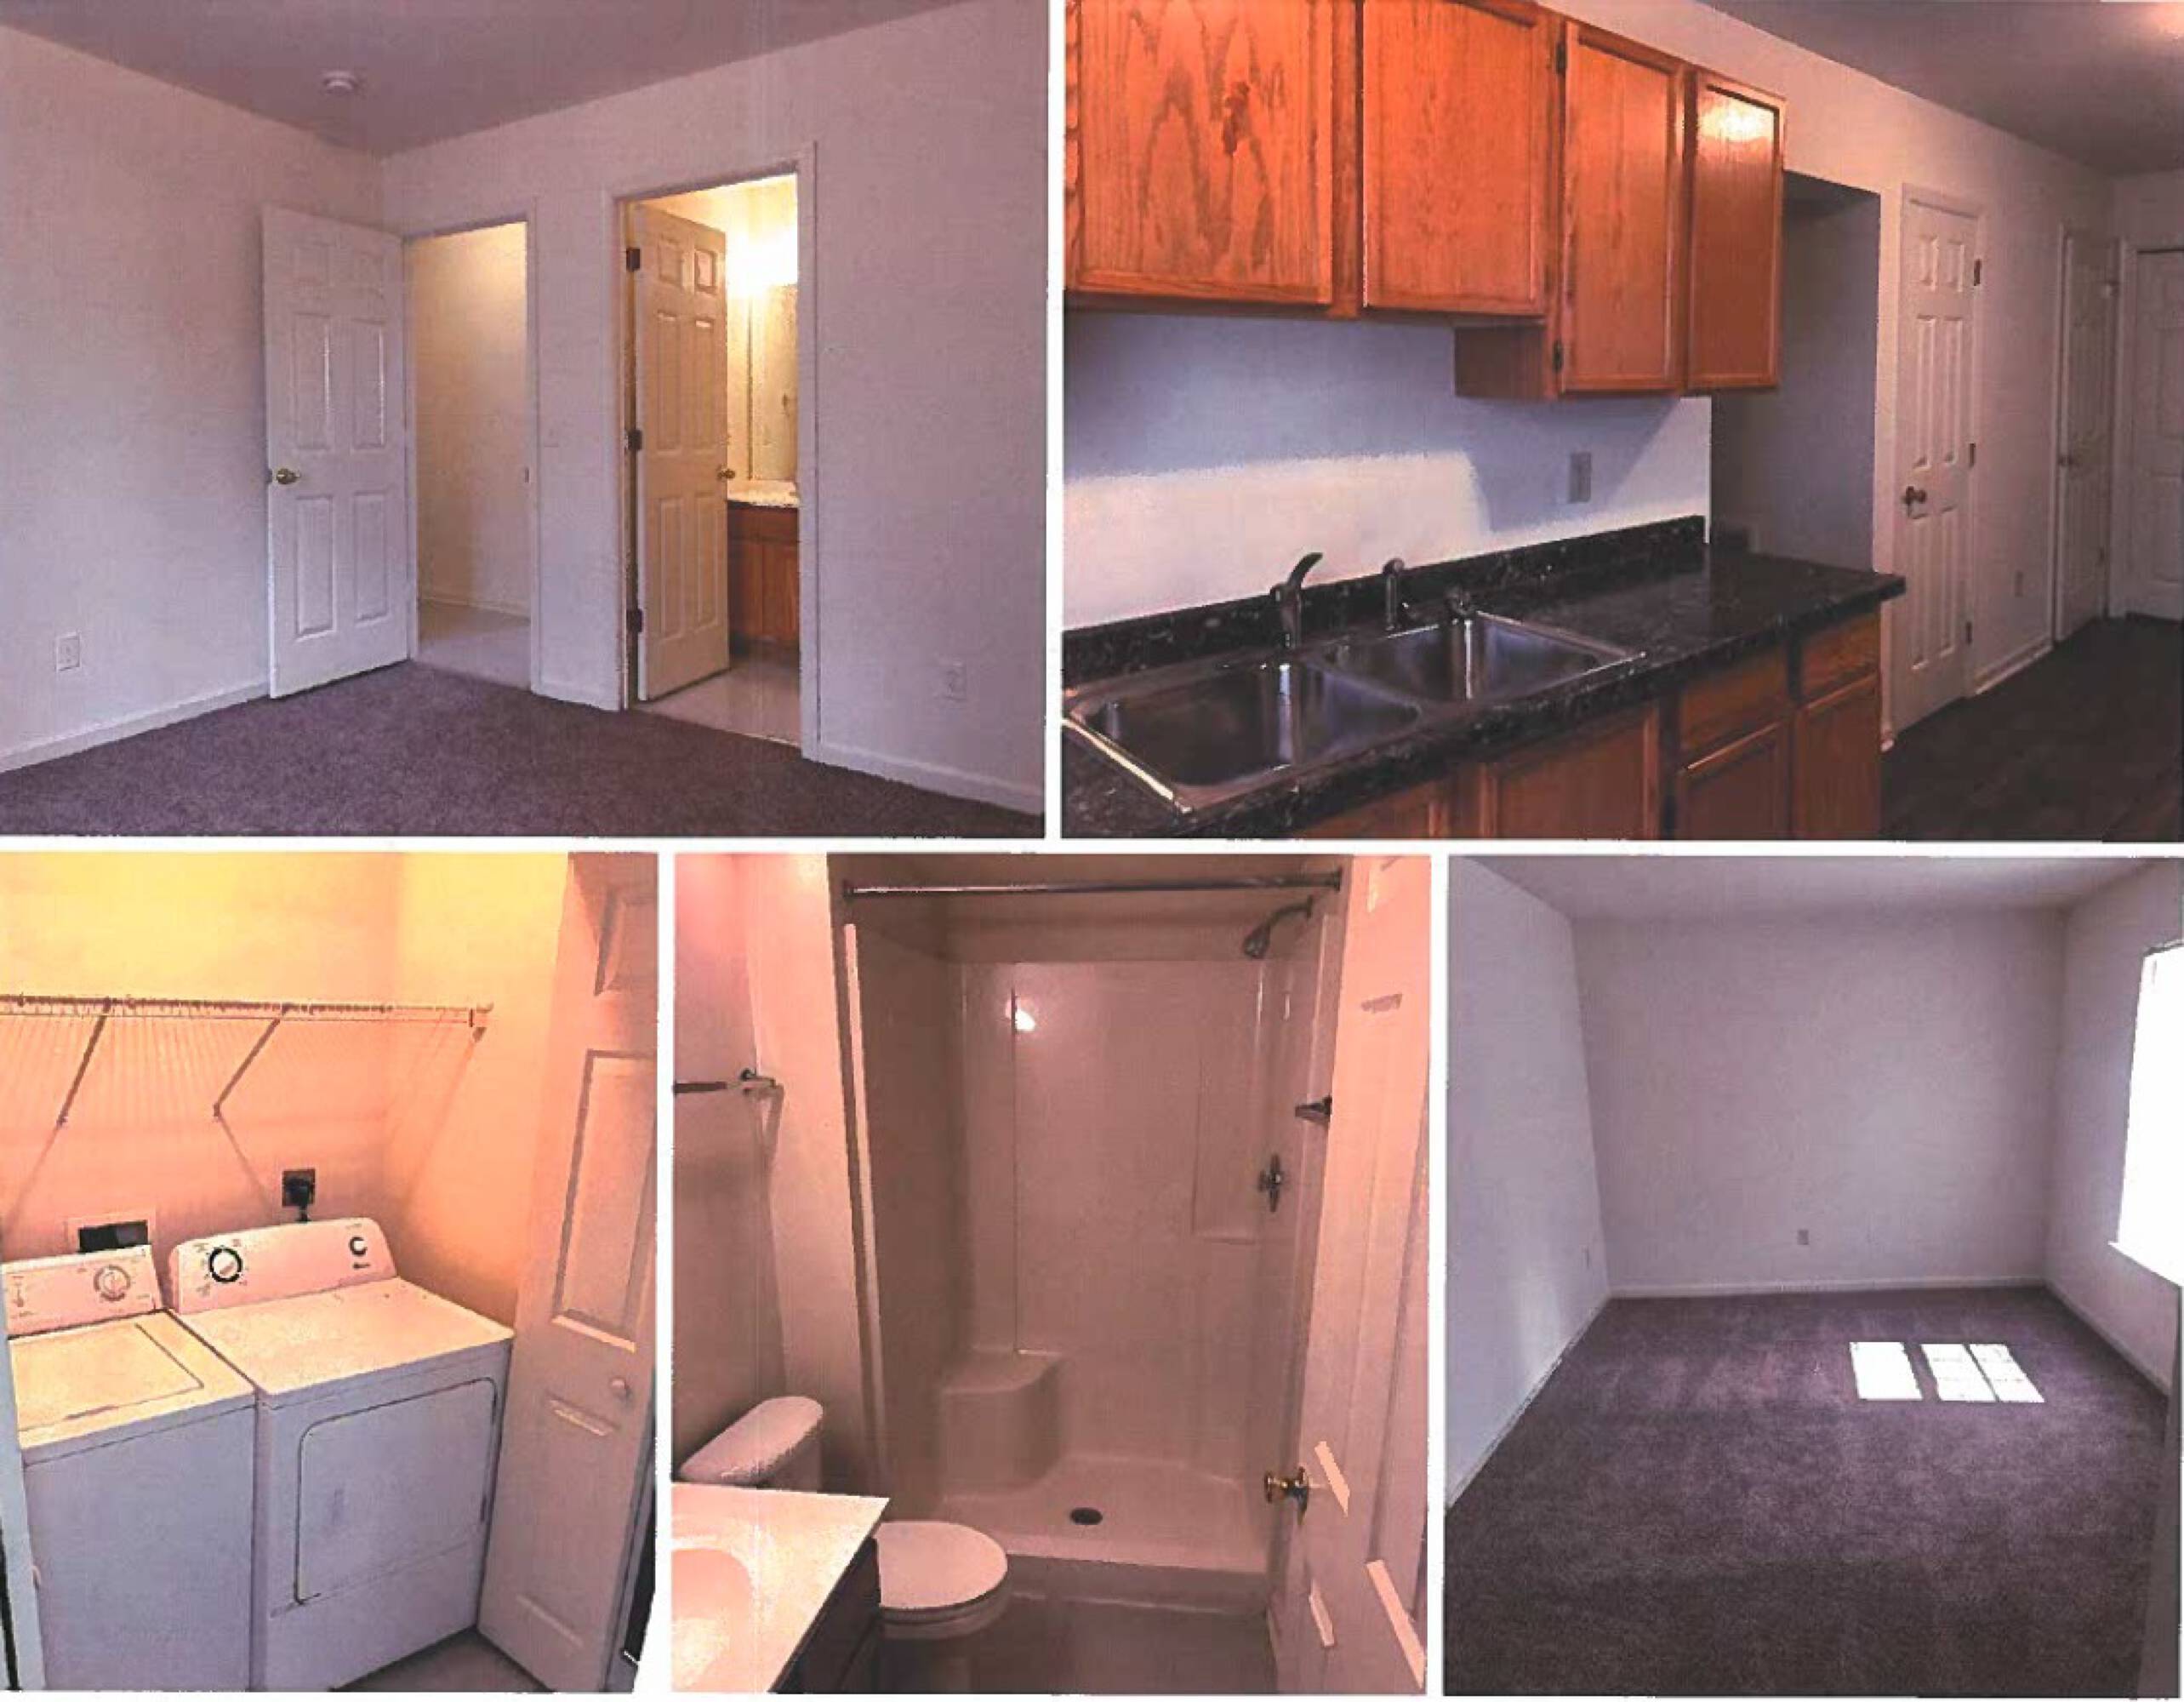
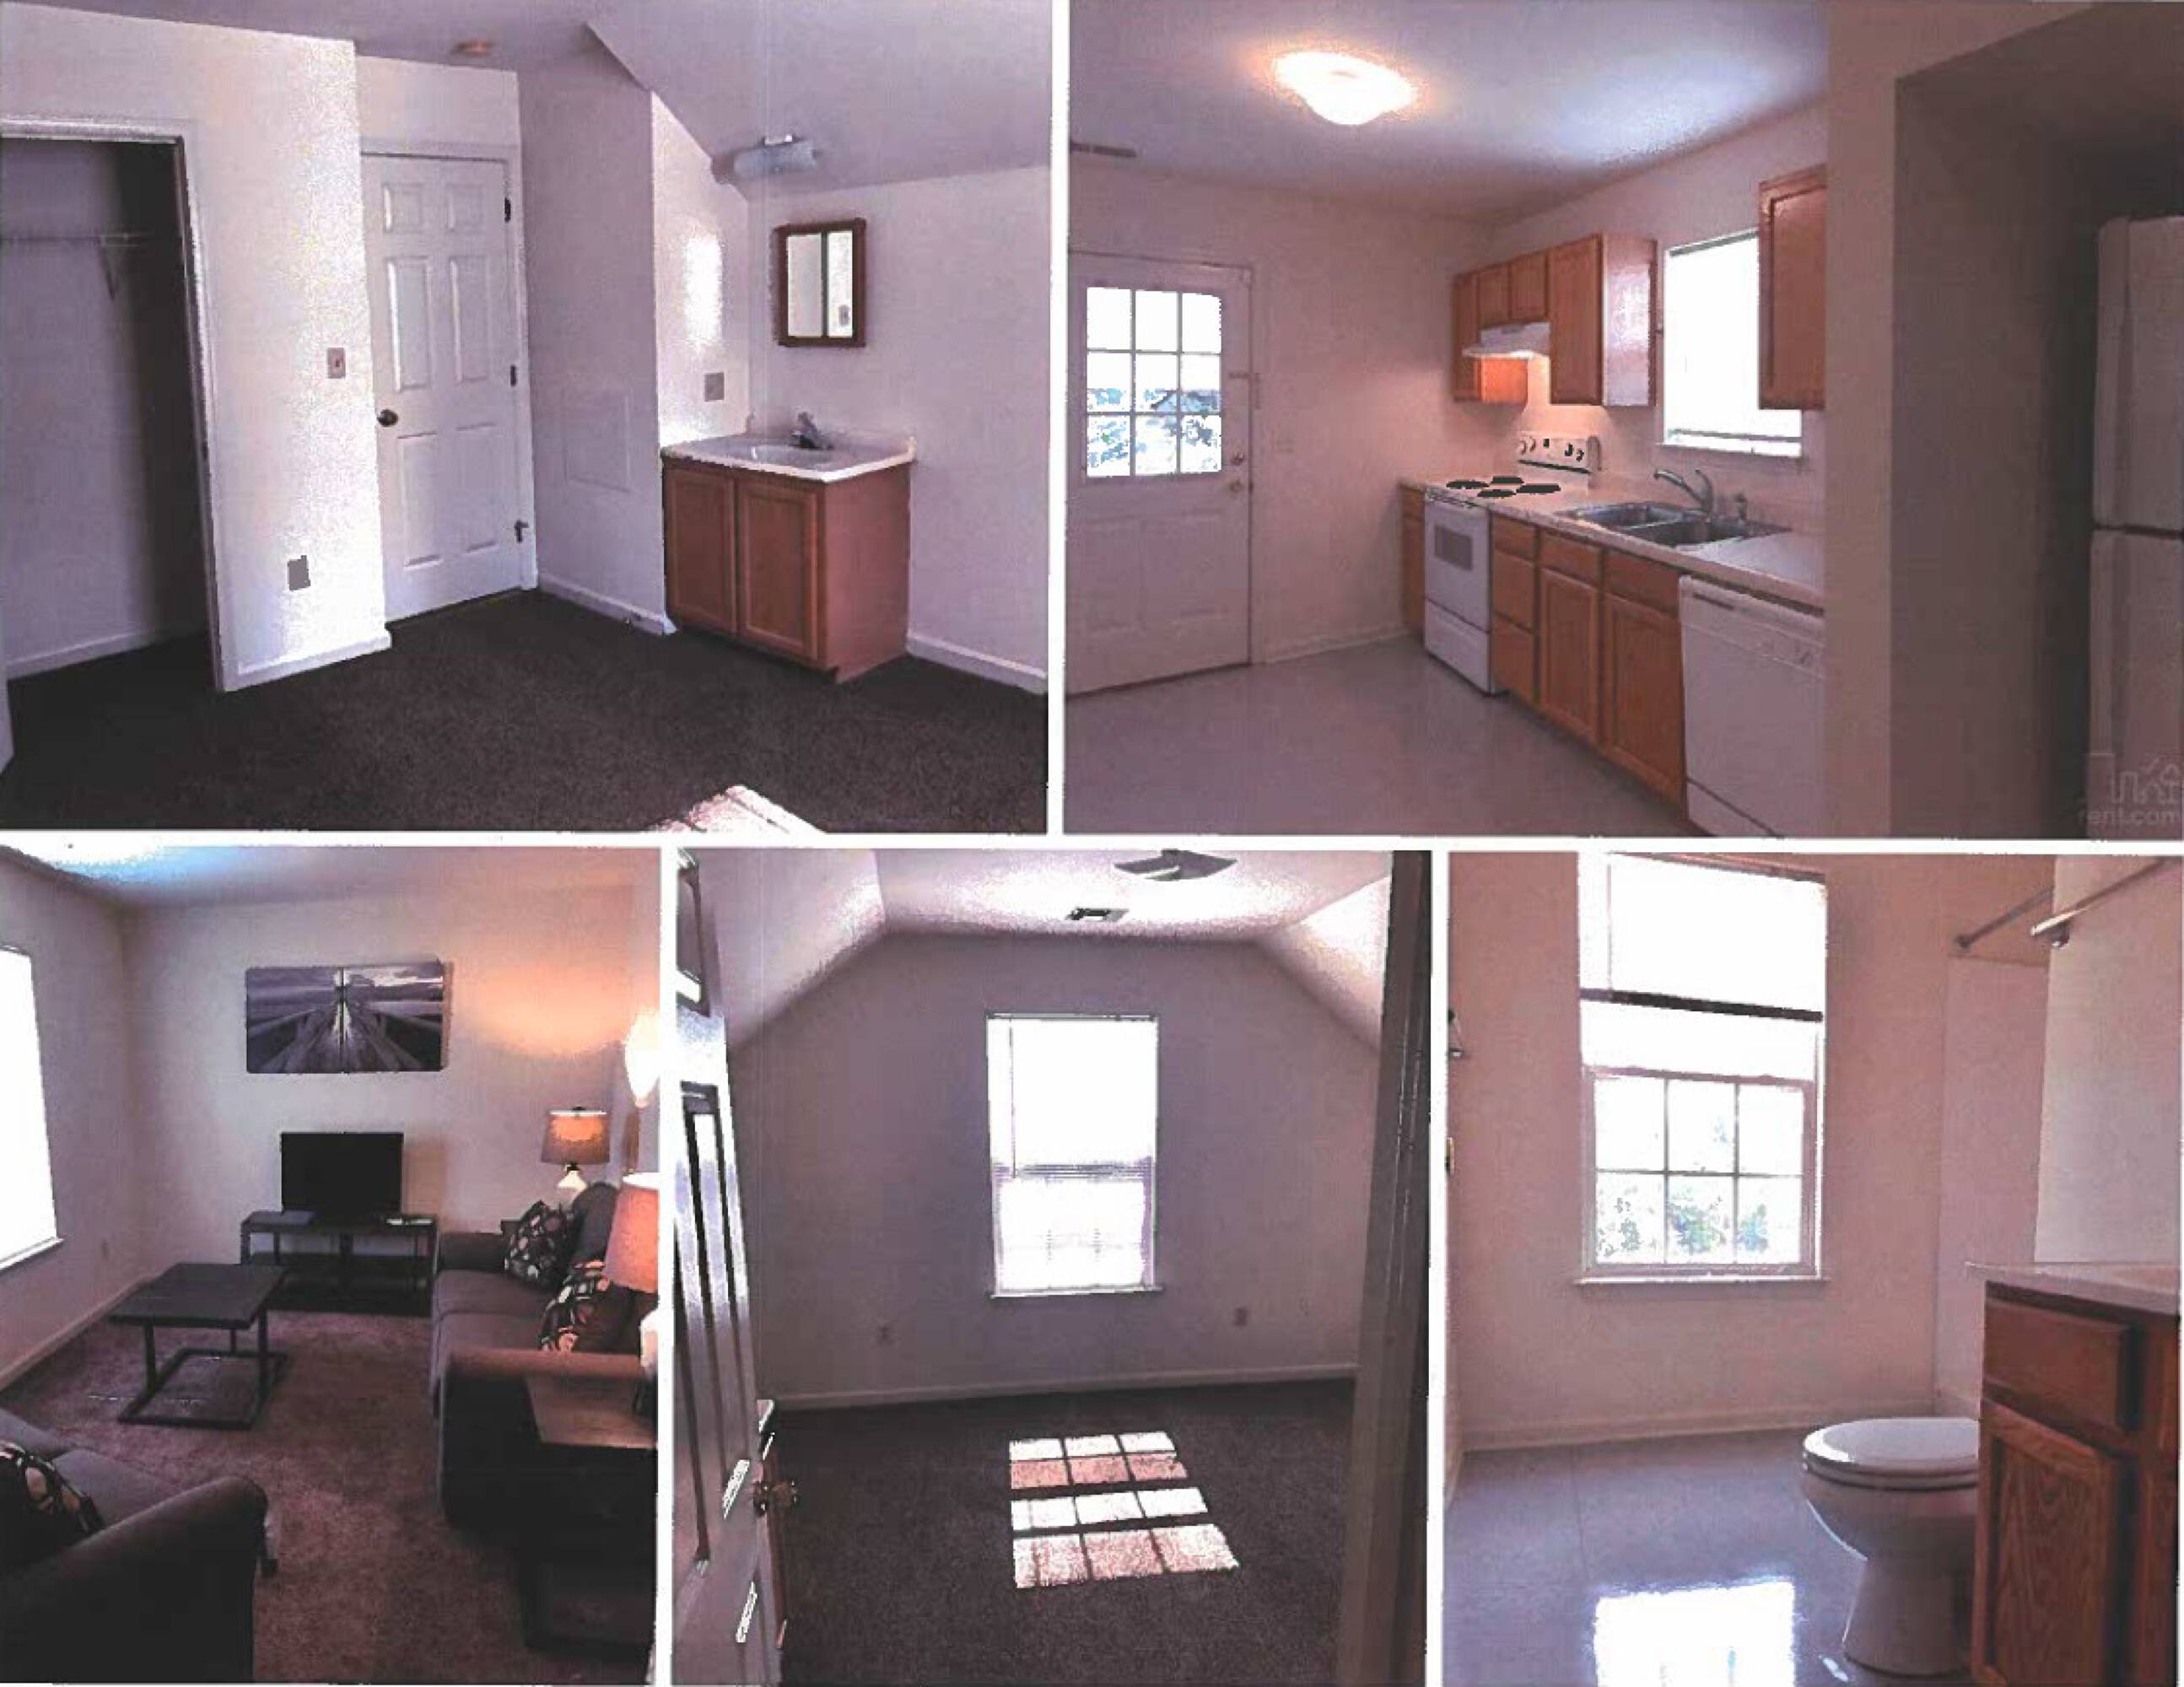
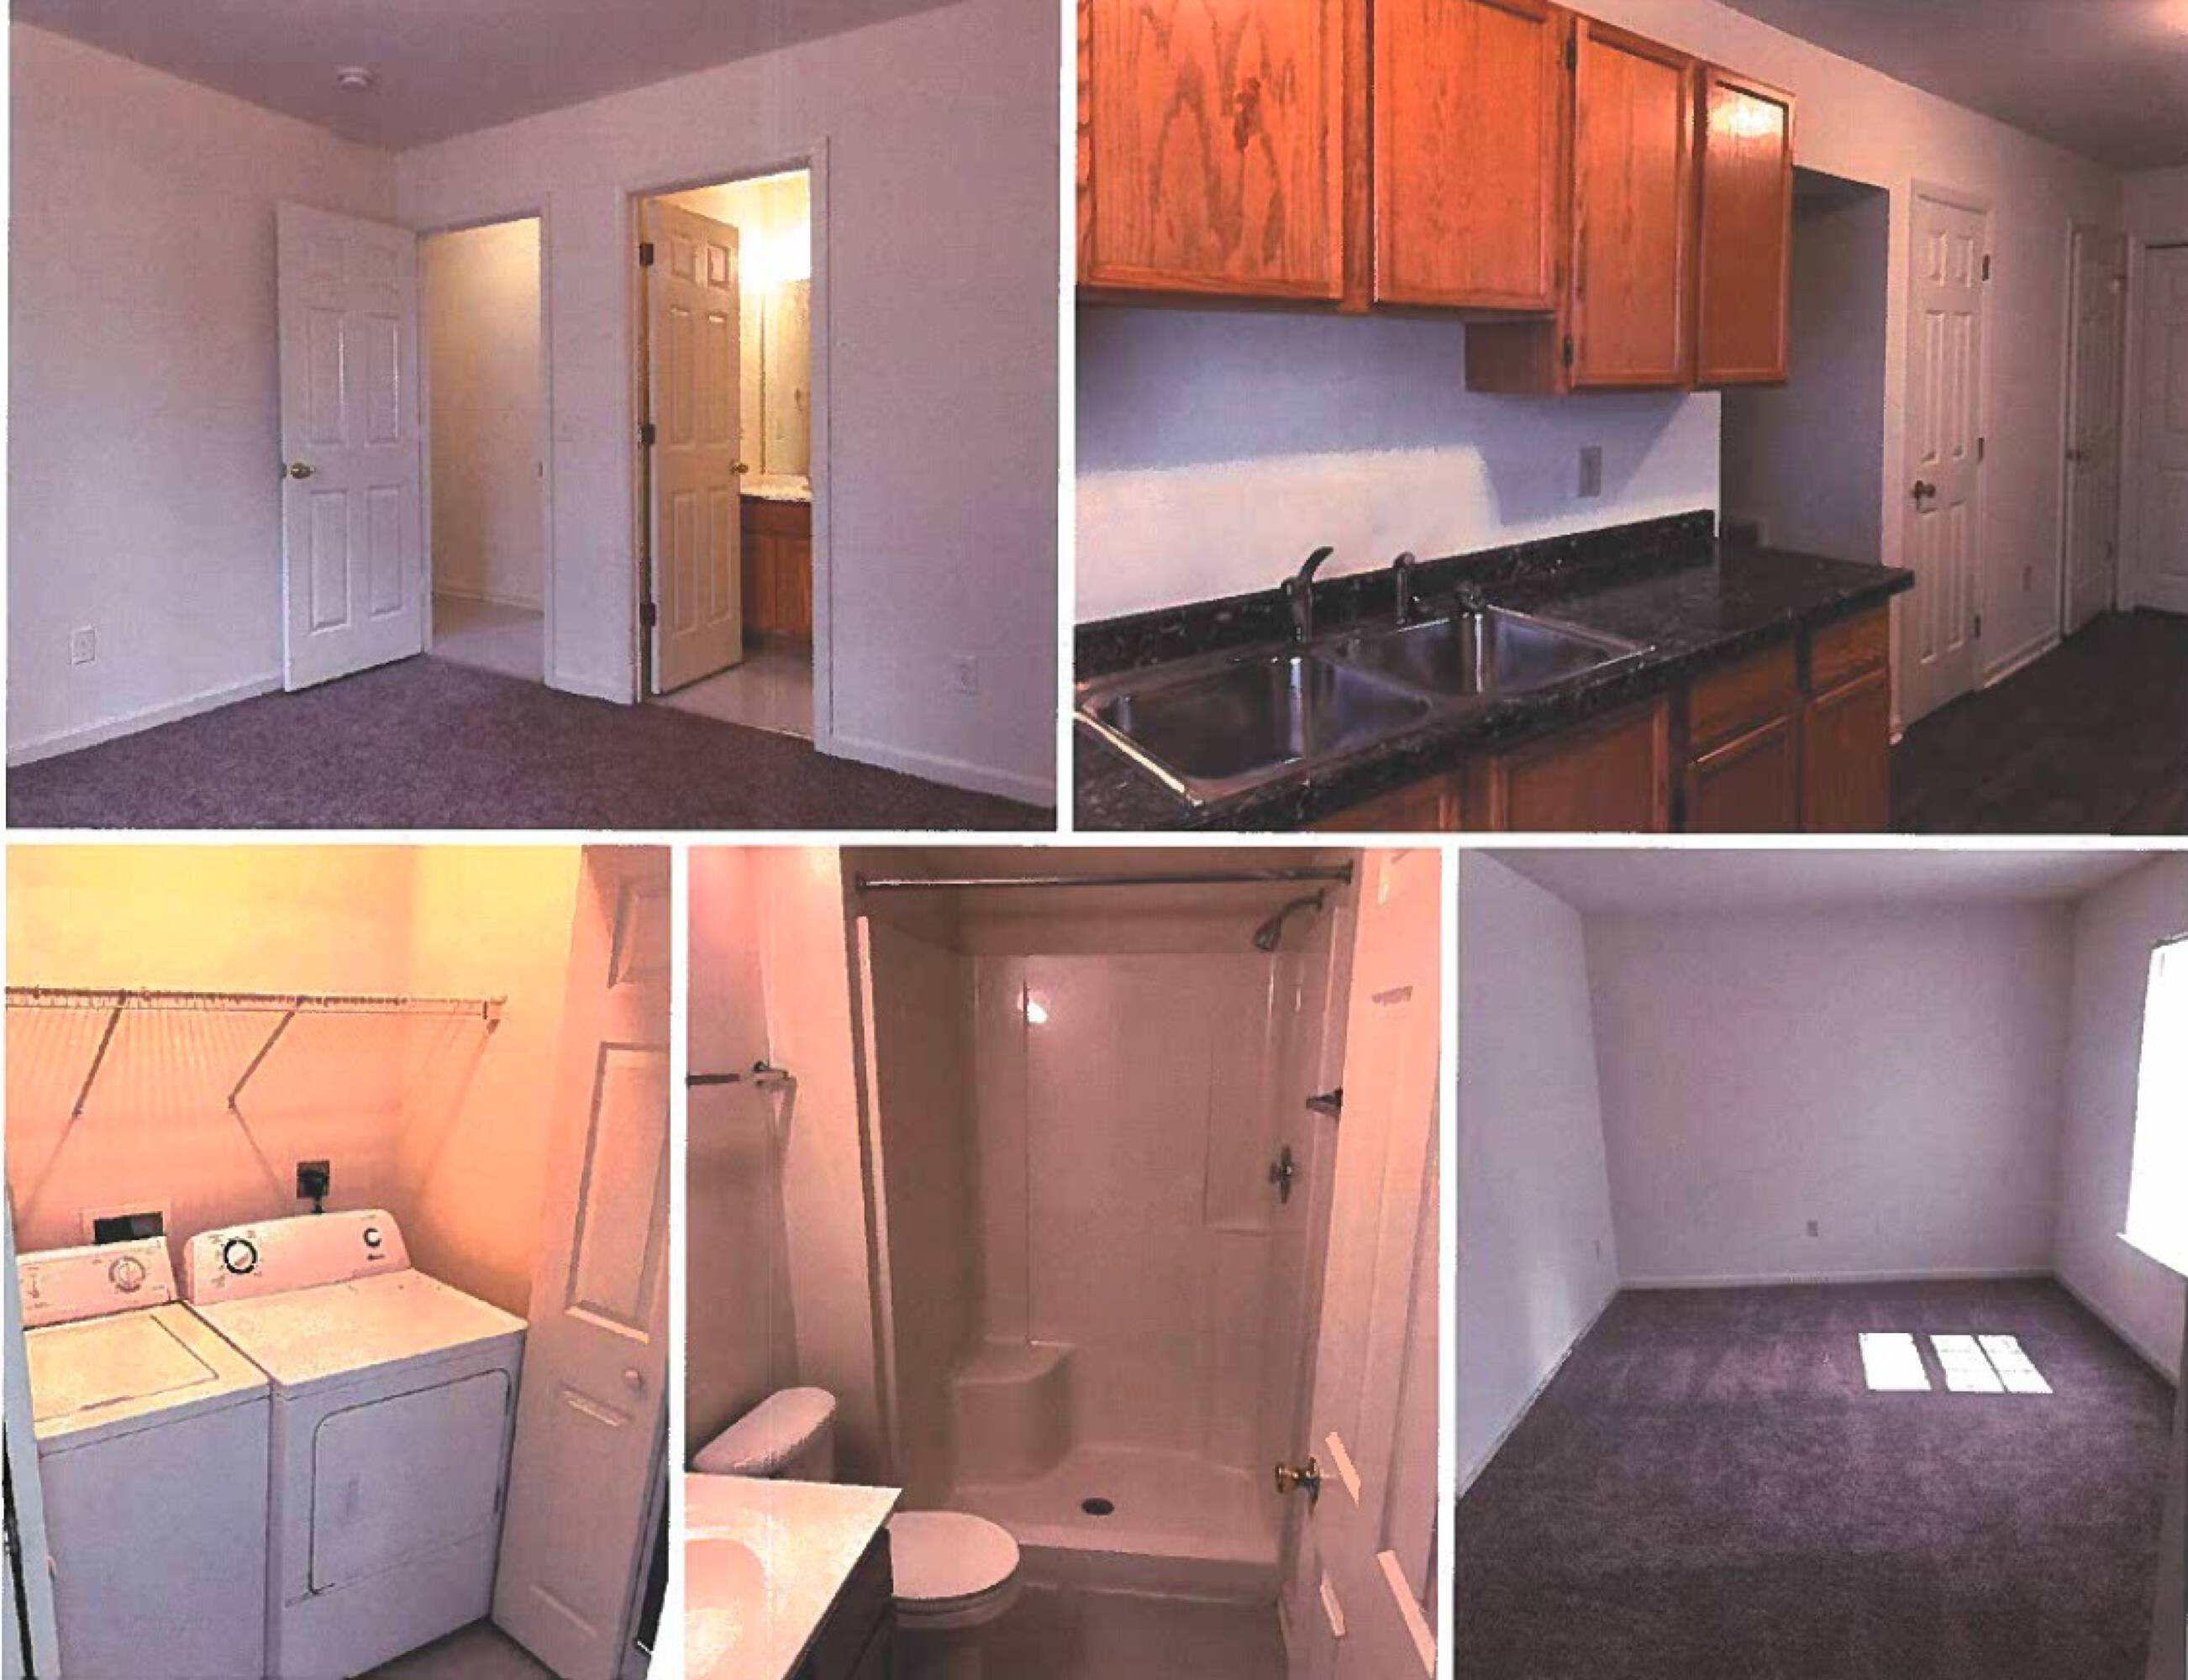
- All units include washers and dryers.
- Built new in 1999.
- Kitchens complete with refrigerator, dishwasher, and stove.
- Potential to increase rental rates and add amenities.
Overview
Current Use by Public Records
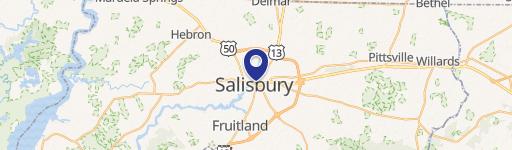
Location Insight
- Map
- Local Demand
- City
- Salisbury
- County
- Wicomico
- State
- Maryland
- Longitude
- -75.5705
- Latitude
- 38.3596