Shopping Center Ground
For Sale
Contact for pricing
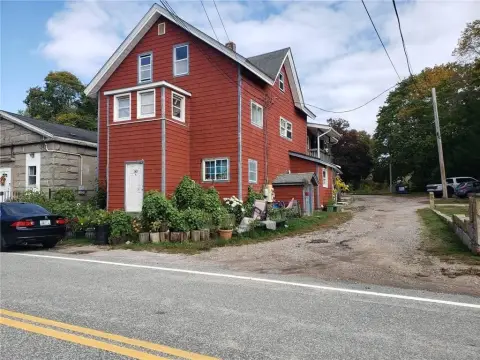
96 Cross Street, Westerly, RI 06770
Ground lease includes 10 years remaining and participation in subtenant gross rents.
Property Size5,476 SF
Price / SF$273.92
Days on Market61
Property Features for 96 Cross Street
General Information
Standard status
Active
Size
5,476 SF
Property subtype
Retail
Zoning
Highway Commercial Zone
Lease Type
NNN
Listing Agency:
Sweeney Real Estate
Listed By:
Eric Schultheis
Source:
Crexi
Added: Aug 7
Changed: Sep 8
Last Checked: Oct 5 at 7:22PM
Displayed information is deemed reliable but is not guaranteed and should be independently verified. All listing content including descriptions, pricing, images are the copyrighted material of Sweeney Real Estate
Investment Insights
Based on property information with market context.
This shopping center property is located within Granite Street Shopping Center at 96 Cross Street in Westerly, RI. The asset is subject to a ground lease with 10 years remaining in its current term.
In addition to ground rent, ownership receives 30% of gross rents generated by property sub-tenants. The property information also identifies redevelopment or additional development as a consideration following expiration of the ground lease.
In addition to ground rent, ownership receives 30% of gross rents generated by property sub-tenants. The property information also identifies redevelopment or additional development as a consideration following expiration of the ground lease.
Key Highlights
- Located within Granite Street Shopping Center at 96 Cross Street, Westerly, RI 06770
- Ground lease has 10 years remaining in the term
- Owner collects 30% of gross rents from all property sub‑tenants
Financial Insights
Estimated NOI and Cap Rate
NOI / Yr
$55,524
Cap Rate
3.70%
Suggested Prices Based on Cap Rates
Cap Rate 5%
$1,110,480
$1.1M
Cap Rate 7%
$793,200
$793.2K
Cap Rate 9%
$616,933
$616.9K
Market Conditions
NOI Build-Up for 5,476 SF
Gross rent
$82.8K $15.12/SF
− Vacancy
−$3.5K −$0.64/SF
EGI
$79.3K $14.48/SF
− OpEx
−$23.8K −$4.35/SF
NOI
$55.5K $10.14/SF
Area
Washington County, RI
Vacancy
4.20%
Lease Rate
$15.12 /SF/Yr
Expense Ratio
30.00%
Simulate Cap Rate and NOI
Suggested Prices Based on Cap Rates
Cap Rate 5%
$1,110,480
Cap Rate 7%
$793,200
Cap Rate 9%
$616,933
Alternative Uses
Best Use
Retail
$793.2K
$694.1K – $925.4K
NOI $55,524 @ 7.0% cap · market cap 3.70%
Second Best
—
—
no second resolved use
Theoretical Best
Healthcare Medical
$1.09M
$957.3K – $1.28M
NOI $76,587 @ 7.0% cap · market cap 5.11%
Zoning and permitted uses should be independently verified with authorities.
Property Analytics
Unlock full access to Insights
Subscribe to Realmo Intelligence
Open Analytics
Current Use
Location Intelligence
Trade Area within ½ mile
348
Businesses Nearby
95k
Monthly Visits Nearby
Under-served
Demand for This Use
Explore this area
Business Placement
Foot Traffic Nearby
Dining 49%
Shops & Services 48%
Home Improvements & Furnishings 2%
Electronics 1%
Cumberland Farms
Shops & Services
19,769 visits/mo
0.4 miles
McDonald's
Dining
16,670 visits/mo
0.3 miles
Dunkin' Donuts
Dining
13,213 visits/mo
0.4 miles
Starbucks
Dining
11,234 visits/mo
0.3 miles
Mobil
Shops & Services
8,424 visits/mo
0.4 miles
Check the figures for this property
Cap Rate, Value Estimation, Potential NOI and more
View Realmo Analytics
Market
Vacancy Rate% for Retail in Northeast region

Questions? Ask Rey
Realmo’s AI knows this listing — price, zoning, demand, history. Ask anything.




Similar Off Market Nearby
- Franklin Shopping Plaza — 100 Franklin St, Westerly, RI 02891
- Coin Cloud Bitcoin ATM — 1 East Ave, Westerly, RI 02891
- Granite Street Shopping Center — 116 Granite St, Westerly, RI 02891
Frequently Asked Questions
What type of property is this?
Shopping center - Ground lease includes 10 years remaining and participation in subtenant gross rents.
Where is this shopping center located?
The property is located at 96 Cross Street Westerly, RI.
What is the asking price?
The asking price for this property is $1,500,000.
What are key features of this property?
This property features: Located within Granite Street Shopping Center at 96 Cross Street, Westerly, RI 06770; Ground lease has 10 years remaining in the term; Owner collects 30% of gross rents from all property sub‑tenants



