Restaurant with Commercial
For Sale
$215,000
Pending
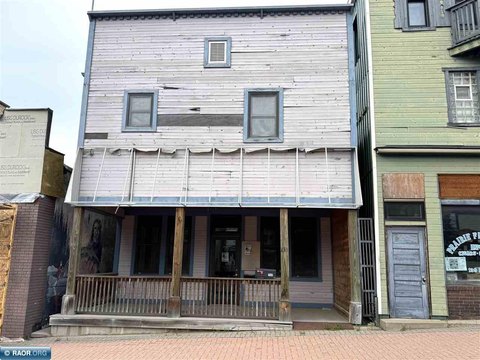
955 E Sheridan St, Ely, MN 55731
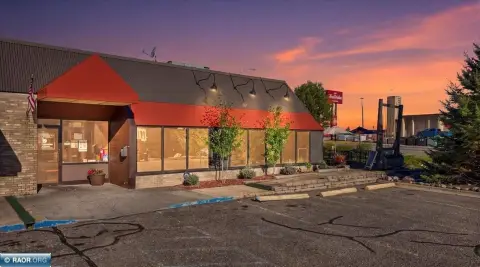
Open-concept dining space features a fireplace, outdoor deck, and landscaped seating area.
Property Size1,900 SF
Days on Market123
Property Features for 955 E Sheridan St
General Information
Standard status
Pending
Size
1,900 SF
Additional Details
Patio
Yes
Taxes and HOA fees
Annual Taxes
$3,698
Amenities
fireplace
landscaping
seasonal flowers
Building Details
Construction
half-log siding
Listing Agency:
Bear Island Realty LLC
(218) 365-2800
Listed By:
Kate Davies · License #40403900
(218) 343-9173
Source:
Exprealty
Added: Jun 5
Changed: Oct 5
Last Checked: Oct 4 at 4:54PM
Displayed information is deemed reliable but is not guaranteed and should be independently verified. All listing content including descriptions, pricing, images are the copyrighted material of Bear Island Realty LLC
Investment Insights
Based on property information with market context.
Located at 955 E Sheridan St in Ely, this restaurant property includes a full commercial kitchen and an open-concept interior arranged for dining use. The building features half-log siding, a fireplace, and finished spaces that retain a distinct Northwoods character. The property measures 1,900 SF.
An outdoor deck extends the guest area and is bordered by landscaping and seasonal flowers. Customer access and parking are provided, while the existing layout may also accommodate continued restaurant use or other commercial concepts. The property is currently operating as a restaurant and includes the possibility of on-site owner quarters or rental income.
An outdoor deck extends the guest area and is bordered by landscaping and seasonal flowers. Customer access and parking are provided, while the existing layout may also accommodate continued restaurant use or other commercial concepts. The property is currently operating as a restaurant and includes the possibility of on-site owner quarters or rental income.
Key Highlights
- Current restaurant operation with full commercial kitchen
- 1,900 SF property in Ely, MN
- Open‑concept interior with fireplace and half‑log siding
Financial Insights
Estimated NOI and Cap Rate
NOI / Yr
$7,515
Cap Rate
3.50%
Suggested Prices Based on Cap Rates
Cap Rate 5%
$150,300
$150.3K
Cap Rate 7%
$107,357
$107.4K
Cap Rate 9%
$83,500
$83.5K
Market Conditions
NOI Build-Up for 1,900 SF
Gross rent
$11.2K $5.88/SF
− Vacancy
−$436 −$0.23/SF
EGI
$10.7K $5.65/SF
− OpEx
−$3.2K −$1.70/SF
NOI
$7.5K $3.96/SF
Area
St. Louis County, MN
Vacancy
3.90%
Lease Rate
$5.88 /SF/Yr
Expense Ratio
30.00%
Simulate Cap Rate and NOI
Suggested Prices Based on Cap Rates
Cap Rate 5%
$150,300
Cap Rate 7%
$107,357
Cap Rate 9%
$83,500
Alternative Uses
Best Use
Specialty Retail
$737.0K
$644.9K – $859.9K
NOI $51,593 @ 7.0% cap · market cap 24.00%
Second Best
Industrial
$107.4K
$93.9K – $125.3K
NOI $7,515 @ 7.0% cap · market cap 3.50%
Theoretical Best
—
—
same as Best Use
Zoning and permitted uses should be independently verified with authorities.
Property Analytics
Unlock full access to Insights
Subscribe to Realmo Intelligence
Open Analytics
Current Use
Location Intelligence
Trade Area within ½ mile
244
Businesses Nearby
Under-served
Demand for This Use
Explore this area
Business Placement
Demographics for 55731, MN
5,494
Population
4,954
Households
1.1
Avg Household Size
54
Median Age
41%
College-Educated
94%
High-School Grad
1,606.7 sq mi
ZIP Area
3
Density / Sq Mi
$62,900
Median Household Income
$31,840
Median Earnings
$641
Median Rent
$202,900
Median Home Value
Check the figures for this property
Cap Rate, Value Estimation, Potential NOI and more
View Realmo Analytics
Market
Vacancy Rate% for Retail in Midwest region

Questions? Ask Rey
Realmo’s AI knows this listing — price, zoning, demand, history. Ask anything.





Frequently Asked Questions
What type of property is this?
Conventional restaurant - Open-concept dining space features a fireplace, outdoor deck, and landscaped seating area.
Where is this conventional restaurant located?
The property is located at 955 E Sheridan St Ely, MN.
What is the asking price?
The asking price for this property is $215,000.
What are key features of this property?
This property features: Current restaurant operation with full commercial kitchen; 1,900 SF property in Ely, MN; Open‑concept interior with fireplace and half‑log siding


