Biwabik Mixed-Use Investment
For Sale
Contact for pricing
400 Main Street S, Biwabik, MN 55708
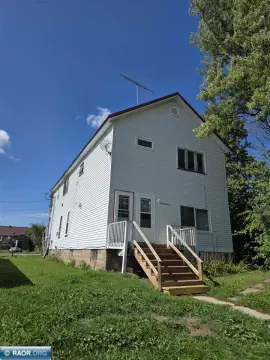
Updated mixed-use property with apartments and commercial spaces in Biwabik, MN.
Property Size3,304 SF
Price / SF$287.53
Days on Market723
Property Features for 400 Main Street S
General Information
Standard status
Active
Size
3,304 SF
Property subtype
Special Purpose
Zoning
Business/Commercial
Occupancy
75%
Building Details
Year Built
1920
Year Renovated
2019
Buildings
2
Stories
2
Units
3
Tenancy
Multi
Listing Agency:
Better Homes and Gardens Real Estate First Choice
Listed By:
Tammy Schotzko · License #40893997
(218) 751-2511
Source:
Crexi
Added: Oct 13, 2024
Changed: Oct 5
Last Checked: Oct 4 at 9:03AM
Displayed information is deemed reliable but is not guaranteed and should be independently verified. All listing content including descriptions, pricing, images are the copyrighted material of Better Homes and Gardens Real Estate First Choice
Investment Insights
Based on property information with market context.
Located on Main Street in Biwabik, Minnesota, just miles from Giants Ridge Golf and Ski Resort, this updated mixed-use property presents an investment opportunity. The building features three revenue-generating apartments suitable for short-term rentals or long-term tenants, and two commercial spaces ideal for retail or office use. Additional amenities include a laundry center and a private outdoor hardscape patio. Recent upgrades encompass new plumbing (supply and drain), electrical service, heat distribution system, windows, whole-building ventilation, spray foam insulation, and solar panels. The apartments feature refinished hardwood flooring, new kitchen cabinetry with quartz countertops, stainless-steel appliances, tiled bathrooms, and wood trim. Furnishings are included in the sale. The property includes a professionally designed 750 square foot coffee shop space with a walk-up window, new commercial appliances, and pending installation of equipment, countertops, and cabinetry. Final work remains on the bathroom, utility room, and electrical/plumbing connections. The 1000 square foot detached commercial space has been extensively upgraded with a new roof installed in 2022, a solar PV system with a 200-amp electrical service and grid tie, radiant floor heating, polished concrete floors, and roughed-in water, sewer, bathroom, and utility room connections. It also features an Arctic Heat Pump system, new windows, LED lighting, and spray foam insulation. An on-site laundry center includes three washers, three dryers, and storage space. A four-car parking pad is located adjacent to an easily accessible alley. The location is near a grocery store, gas station, and a city park across the street. The seller is willing to separate the property into two parcels and would retain the parcel with the second commercial space.
Key Highlights
- Prime location on Main Street in Biwabik, MN, near Giants Ridge, offering high visibility and traffic (4400 cars/day).
- Versatile mixed‑use property with 3 updated apartments (including furnishings) and 2 commercial spaces, providing multiple income streams.
- Extensive recent upgrades including new plumbing, electrical, heat distribution, windows, ventilation, insulation, and solar panels, ensuring energy efficiency and reduced maintenance.
Financial Insights
Estimated NOI and Cap Rate
NOI / Yr
$74,764
Cap Rate
7.87%
Suggested Prices Based on Cap Rates
Cap Rate 5%
$1,495,280
$1.5M
Cap Rate 7%
$1,068,057
$1.1M
Cap Rate 9%
$830,711
$830.7K
Market Conditions
NOI Build-Up for 3,304 SF
Gross rent
$137.2K $41.52/SF
− Vacancy
−$17.6K −$5.31/SF
EGI
$119.6K $36.21/SF
− OpEx
−$44.9K −$13.58/SF
NOI
$74.8K $22.63/SF
Area
St. Louis County, MN
Vacancy
12.80%
Lease Rate
$41.52 /SF/Yr
Expense Ratio
37.50%
Simulate Cap Rate and NOI
Suggested Prices Based on Cap Rates
Cap Rate 5%
$1,495,280
Cap Rate 7%
$1,068,057
Cap Rate 9%
$830,711
Alternative Uses
Best Use
Mixed Use
$1.07M
$934.6K – $1.25M
NOI $74,764 @ 7.0% cap · market cap 7.87%
Second Best
Apartment 5plus
$386.5K
$338.2K – $451.0K
NOI $27,057 @ 7.0% cap · market cap 2.85%
Theoretical Best
Specialty Retail
$1.28M
$1.12M – $1.50M
NOI $89,717 @ 7.0% cap · market cap 9.44%
Zoning and permitted uses should be independently verified with authorities.
Property Analytics
Unlock full access to Insights
Subscribe to Realmo Intelligence
Open Analytics
Current Use
Location Intelligence
Trade Area within ½ mile
105
Businesses Nearby
Explore this area
Business Placement
Demographics for 55708, MN
917
Population
425
Households
2.2
Avg Household Size
47
Median Age
32%
College-Educated
98%
High-School Grad
4.8 sq mi
ZIP Area
191
Density / Sq Mi
$68,859
Median Household Income
$48,000
Median Earnings
$736
Median Rent
$107,700
Median Home Value
Check the figures for this property
Cap Rate, Value Estimation, Potential NOI and more
View Realmo Analytics
Market
Vacancy Rate% for Multifamily in Midwest region

Questions? Ask Rey
Realmo’s AI knows this listing — price, zoning, demand, history. Ask anything.

Frequently Asked Questions
What type of property is this?
Mixed-use property - Updated mixed-use property with apartments and commercial spaces in Biwabik, MN.
Where is this mixed-use property located?
The property is located at 400 Main Street S Biwabik, MN.
What is the asking price?
The asking price for this property is $950,000.
What are key features of this property?
This property features: Prime location on Main Street in Biwabik, MN, near Giants Ridge, offering high visibility and traffic (4400 cars/day).; Versatile mixed‑use property with 3 updated apartments (including furnishings) and 2 commercial spaces, providing multiple income streams.; Extensive recent upgrades including new plumbing, electrical, heat distribution, windows, ventilation, insulation, and solar panels, ensuring energy efficiency and reduced maintenance.



