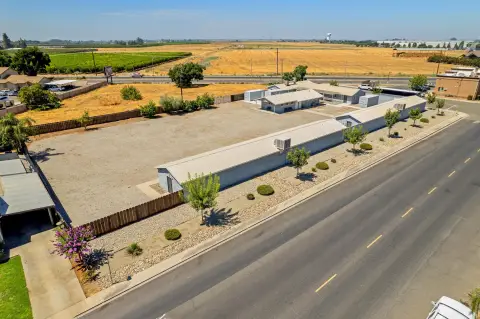
Commercial Retail Development Land
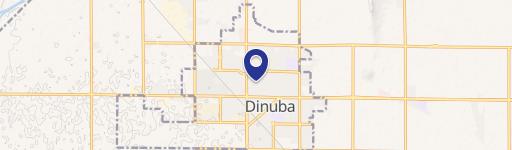
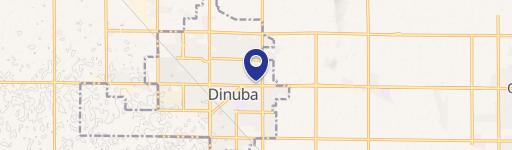
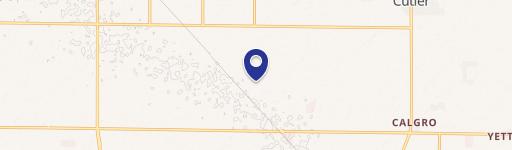
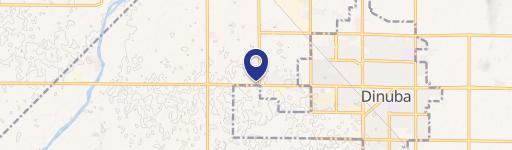
NWC Alta Ave & Surabian Dr Dinuba, CA 93618
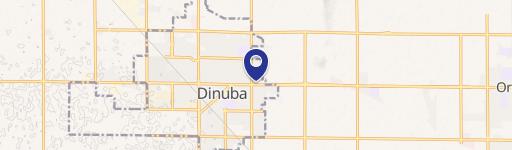
NWC Alta Ave & Surabian Dr, Dinuba, CA, 93618
Contact for pricing
For Sale
Contact for pricing
Prime commercial land for retail development with high traffic visibility.
Lot Size2.15 Acres
Days on Market2051
Property Features for NWC Alta Ave & Surabian Dr
General Information
- Standard status
- Active
- Lot size
- 2.15 Acres
- Property subtype
- Land
Listing Agency
C21 Commercial
(559) 359-4035
Listed by
Kevin Land · License #CA 01516541
Source
Crexi
Added: Dec 4, 2020 Checked: Jul 16 at 10:04 am
Displayed information is deemed reliable but is not guaranteed and should be independently verified. All listing content including descriptions, pricing, images are the copyrighted material of C21 Commercial
Investment Insights
Based on property information with market context.
This property features approximately 2.15 acres of commercial retail development land, situated off Alta Avenue, just south of El Monte Way. The location offers high visibility and convenient access from Alta Avenue, with substantial frontage on Surabian Drive. Positioned east of Walmart Supercenter and north of Ruiz Foods, Inc., the parcel benefits from existing access from both Surabian Drive and Alta Avenue. The roads are designed to handle current capacity, aligning with local policies to prevent traffic congestion, making the site shovel-ready. Strategically located south of Dinuba's primary commercial corridor, El Monte Avenue, the site benefits from substantial traffic flow, with approximately 150,493 cars per day on El Monte Avenue. Alta Avenue sees approximately 13,931 cars northbound and 11,036 cars southbound. The flexible commercial zoning allows for various uses, including convenience stores, car washes, hotels, conference centers, quick-service and sit-down restaurants, food markets, retail strip centers, and professional offices. All necessary wet and dry utilities are available at the site.
Key Highlights
- ±2.15 Acres of Commercial Retail Development Land
- Highly Visible Location with Easy Access off Alta Ave
- Strategically Positioned South of Dinuba's Main Commercial Thoroughfare (El Monte Ave) with High Traffic Volume (±50,493 Cars Per Day)
Property Analytics
Location Intelligence
Current Use by Public Records
Commercial land
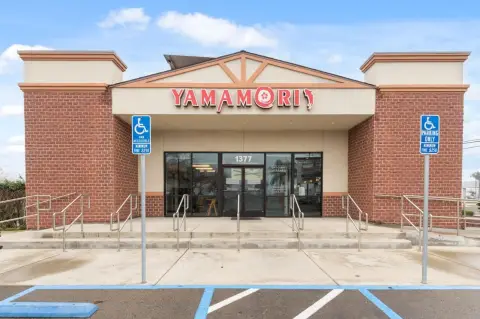
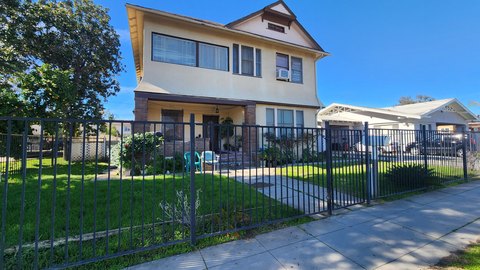
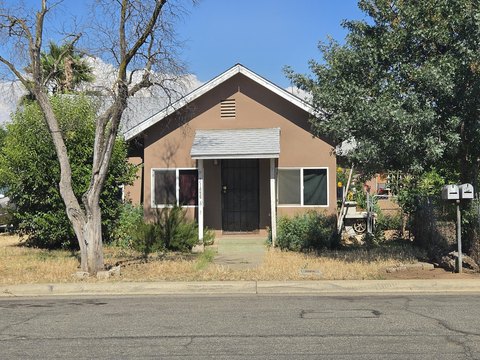
Similar For Sale Nearby


FAQs
What type of property is this?
Commercial land - Prime commercial land for retail development with high traffic visibility.
Where is this commercial land located?
The property is located at NWC Alta Ave & Surabian Dr Dinuba, CA.
What is the asking price?
The asking price for this property is $1,685,772.
What are key features of this property?
This property features: ±2.15 Acres of Commercial Retail Development Land; Highly Visible Location with Easy Access off Alta Ave; Strategically Positioned South of Dinuba's Main Commercial Thoroughfare (El Monte Ave) with High Traffic Volume (±50,493 Cars Per Day)