Massive Four-Unit Multifamily
For Sale
Contact for pricing
250 S 18th Street, Columbus, OH 43205
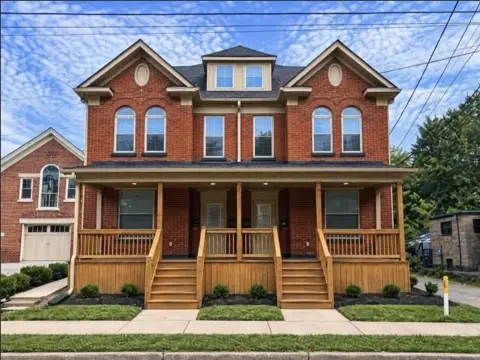
Four-unit property with high ceilings, natural light, and oversized garage.
Property Size6,345 SF
Price / SF$141.84
Days on Market766
Property Features for 250 S 18th Street
General Information
Standard status
Active
Size
6,345 SF
Total Parking Spaces
4
Property subtype
Multifamily
Net Operating Income
$80,618
Building Details
Year Built
1904
Year Renovated
2023
Units
4
Listing Agency:
Investor Broker Realty
Listed By:
Sheryl Reitter · License #2009004313
(614) 296-4321
Source:
Crexi
Added: Sep 16, 2024
Changed: Oct 4
Last Checked: Oct 20 at 9:35PM
Displayed information is deemed reliable but is not guaranteed and should be independently verified. All listing content including descriptions, pricing, images are the copyrighted material of Investor Broker Realty

Ask AI about this property
Review the available facts, identify missing information and prepare questions for the agent.
Investment Insights
Based on property information with market context.
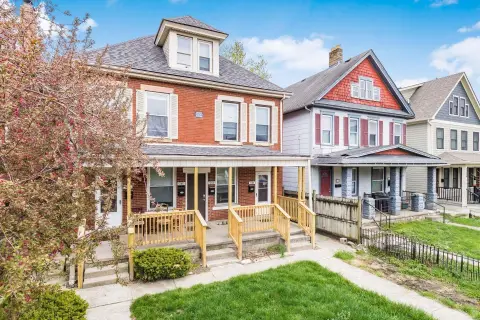
This four-unit property features curb appeal and is situated blocks from Downtown, the Conservatory, shops, and restaurants. The building includes open concept floor plans, soaring 10 to 16 ft ceilings, and natural light. An oversized four-car garage is included. The property is set on a large lot with the potential to parcel off and sell the back for additional units. There are two large three- or four-bedroom, one-bathroom units, one of which is fully renovated and vacant with an estimated rent of $2,599. The other is rented for $1,775 with a long-term tenant. There is one fully renovated two-bedroom, one-bathroom unit rented for $1,675, and one large one-bedroom plus den, one-bathroom unit rented for $1,475. The actual square footage is 6,345.
Key Highlights
- Massive 4‑unit property with high cash flow potential.
- Prime location: close to Downtown, Conservatory, shops, and restaurants.
- Potential to parcel off the large lot for additional units (2‑4).
Financial Insights
Estimated NOI and Cap Rate
NOI / Yr
$54,028
Cap Rate
6.00%
Suggested Prices Based on Cap Rates
Cap Rate 5%
$1,080,560
$1.1M
Cap Rate 7%
$771,829
$771.8K
Cap Rate 9%
$600,311
$600.3K
Market Conditions
NOI Build-Up for 6,345 SF
Gross rent
$83.0K $13.08/SF
− Vacancy
−$5.8K −$0.92/SF
EGI
$77.2K $12.16/SF
− OpEx
−$23.2K −$3.65/SF
NOI
$54.0K $8.52/SF
Area
Columbus, OH
Vacancy
7.00%
Lease Rate
$13.08 /SF/Yr
Expense Ratio
30.00%
Simulate Cap Rate and NOI
Suggested Prices Based on Cap Rates
Cap Rate 5%
$1,080,560
Cap Rate 7%
$771,829
Cap Rate 9%
$600,311
Alternative Uses
Best Use
Multifamily LT 5
$771.8K
$675.4K – $900.5K
NOI $54,028 @ 7.0% cap · market cap 6.00%
Second Best
Apartment 5plus
$620.9K
$543.3K – $724.4K
NOI $43,462 @ 7.0% cap · market cap 4.83%
Theoretical Best
Office A
$1.32M
$1.16M – $1.54M
NOI $92,563 @ 7.0% cap · market cap 10.28%
Zoning and permitted uses should be independently verified with authorities.
How Realmo checks its estimates
Property Analytics
Contact the owner directly
Get the owner's phone numbers and email
Open Analytics
Location Intelligence
Trade Area within ½ mile
3,619
Businesses Nearby
Explore this area
Business Placement
Demographics for 43205, OH
12,044
Population
7,303
Households
1.6
Avg Household Size
35
Median Age
41%
College-Educated
89%
High-School Grad
2.4 sq mi
ZIP Area
5,018
Density / Sq Mi
$54,214
Median Household Income
$41,219
Median Earnings
$1,050
Median Rent
$290,800
Median Home Value
Check the figures for this property
Cap Rate, Value Estimation, Potential NOI and more
View Realmo Analytics
Market
Vacancy Rate% for Multifamily in Midwest region






Frequently Asked Questions
What type of property is this?
Quadplex - Four-unit property with high ceilings, natural light, and oversized garage.
Where is this quadplex located?
The property is located at 250 S 18th Street Columbus, OH.
What is the asking price?
The asking price for this property is $899,999.
What are key features of this property?
This property features: Massive 4‑unit property with high cash flow potential.; Prime location: close to Downtown, Conservatory, shops, and restaurants.; Potential to parcel off the large lot for additional units (2‑4).


