Office and Warehouse Flex
9404 Margo Lane Munster, IN 46321
For Sale
$3,200,000
COMMERCIAL - Munster, IN
Property Size14,534 SF
Lot Size2.33 Acres
Price / SF$220.17
Days on Market192
Property Features for 9404 Margo Lane
General Information
- Property type
- Commercial Sale
- Property subtype
- Office
- Zoning
- COMMR
- Standard status
- Active
- APN
- 450625300013000027
- Lot size
- 2.33 Acres
Taxes and HOA fees
- Tax Year
- 2024
- Tax Annual Amount
- 78510
Utilities
- Utilities
- Natural Gas Available
- Cooling system
- Central Air
Building Details
- Year built
- 2017
- Floors in Building
- 1
- Number of units
- 1
- Flooring type
- Vinyl, Carpet
- Building materials
- Brick, Steel Siding
- Roof type
- Metal
Listing Agency:
Realty Executives Premier Illinois
(630) 668-1199
Listed By:
Bill Port
(219) 405-3647
Added: Jan 16
Changed: Jul 12
Last Checked: Jul 27 at 2:06AM
MLS# 12548552
Copyright © 2026 Midwest Real Estate Data, LLC. All rights reserved. All information provided by the listing agent/broker is deemed reliable but is not guaranteed and should be independently verified.
Investment Insights
Based on property information with market context.
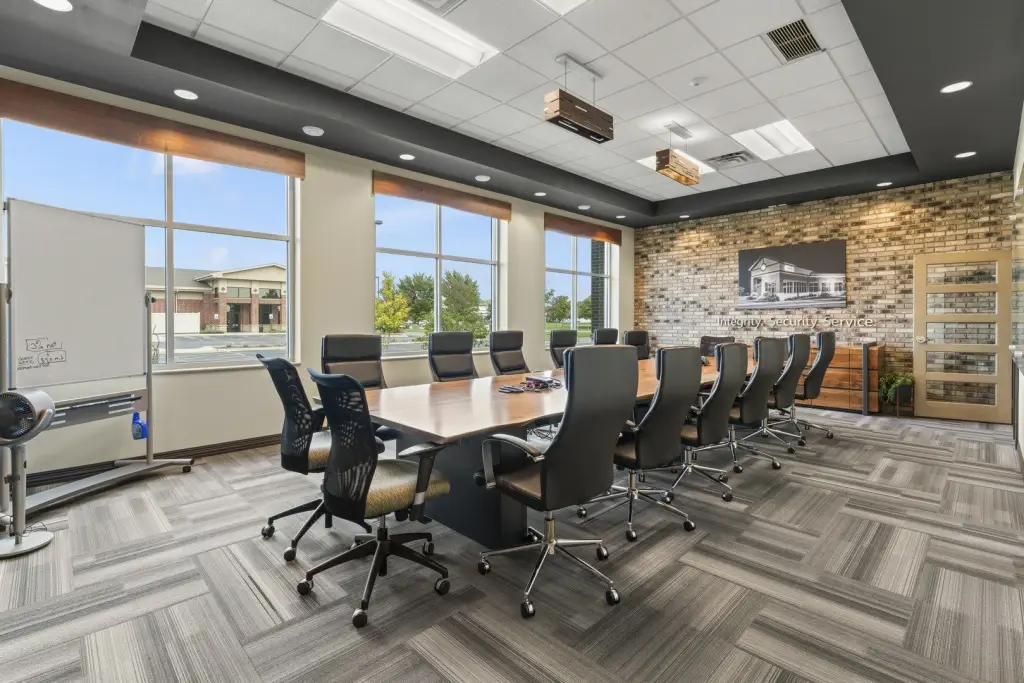
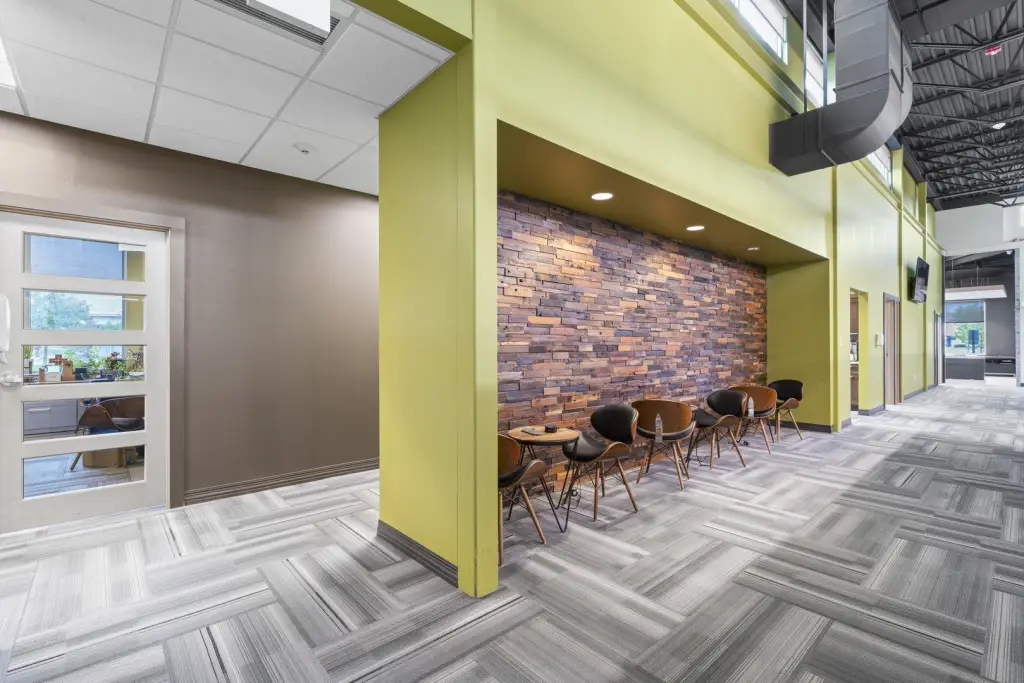
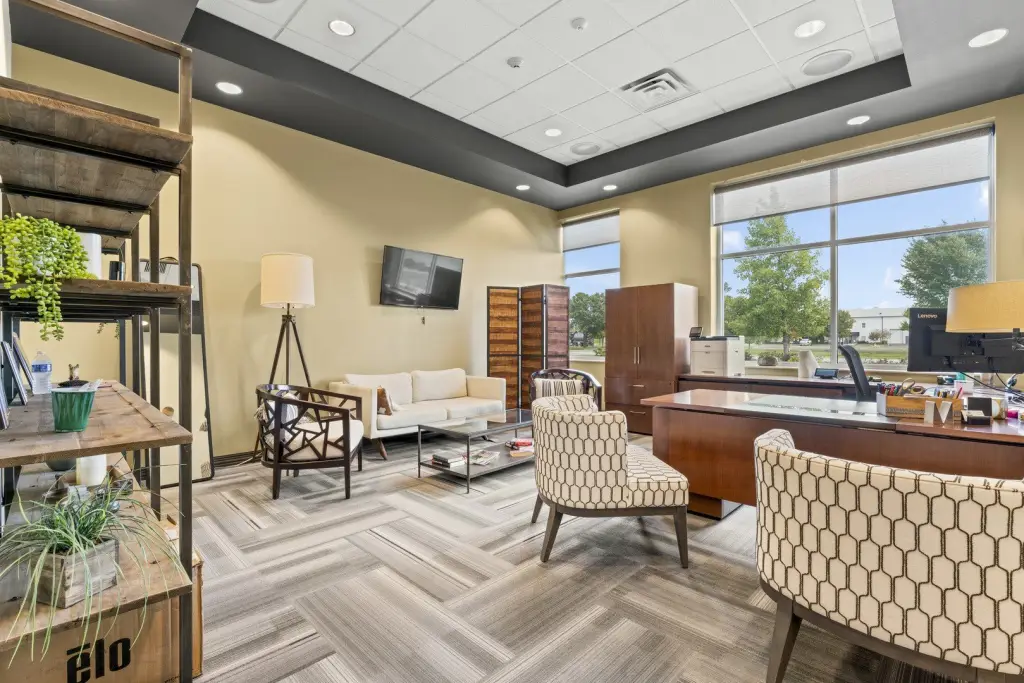
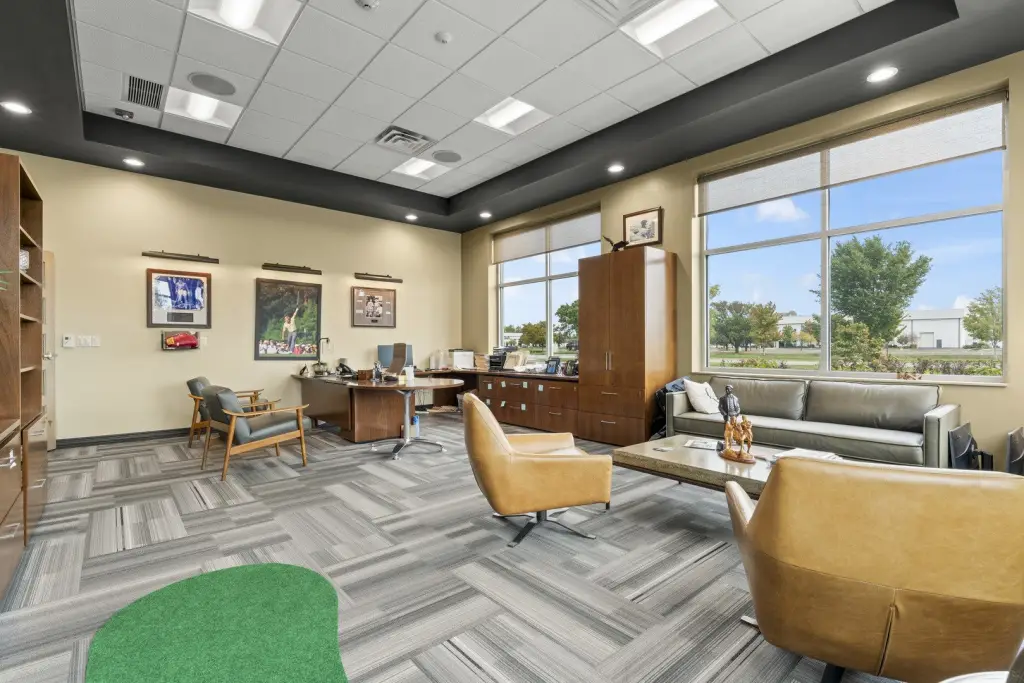
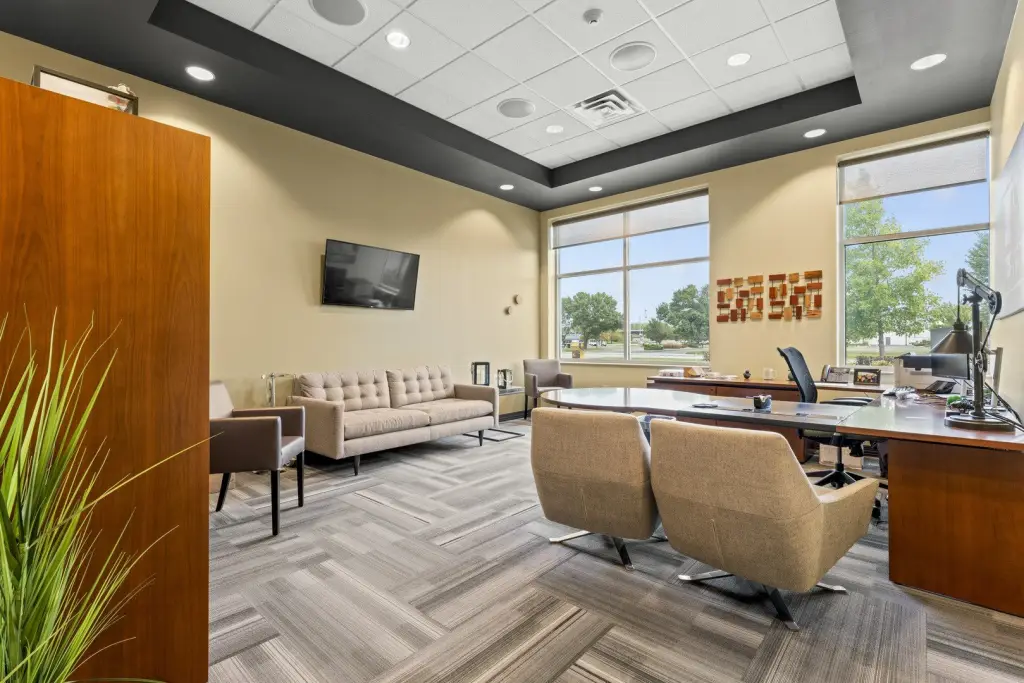
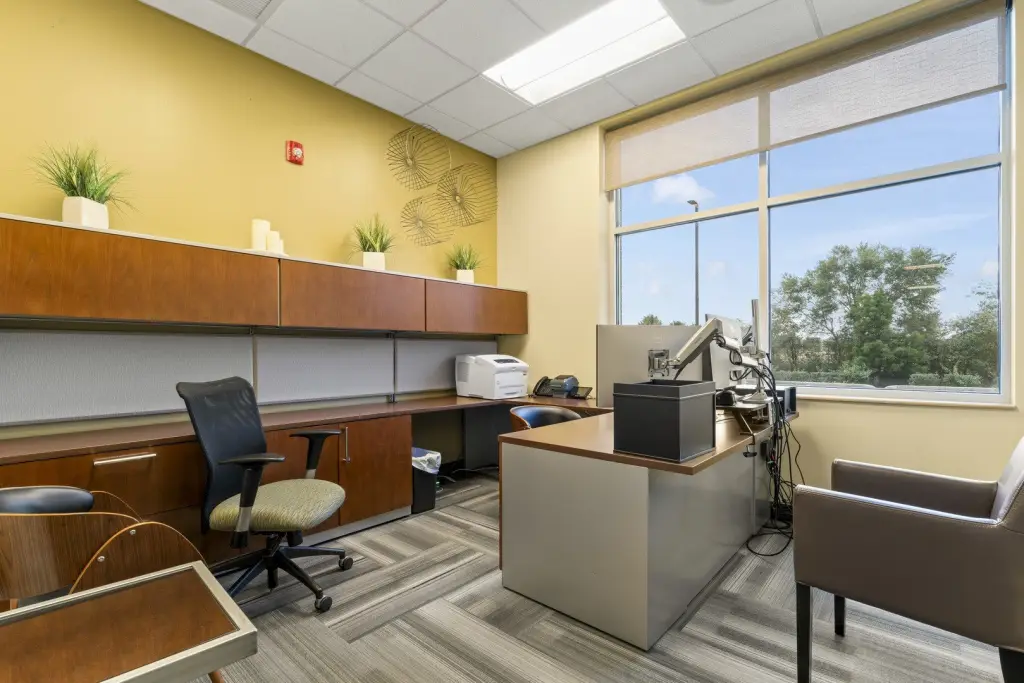
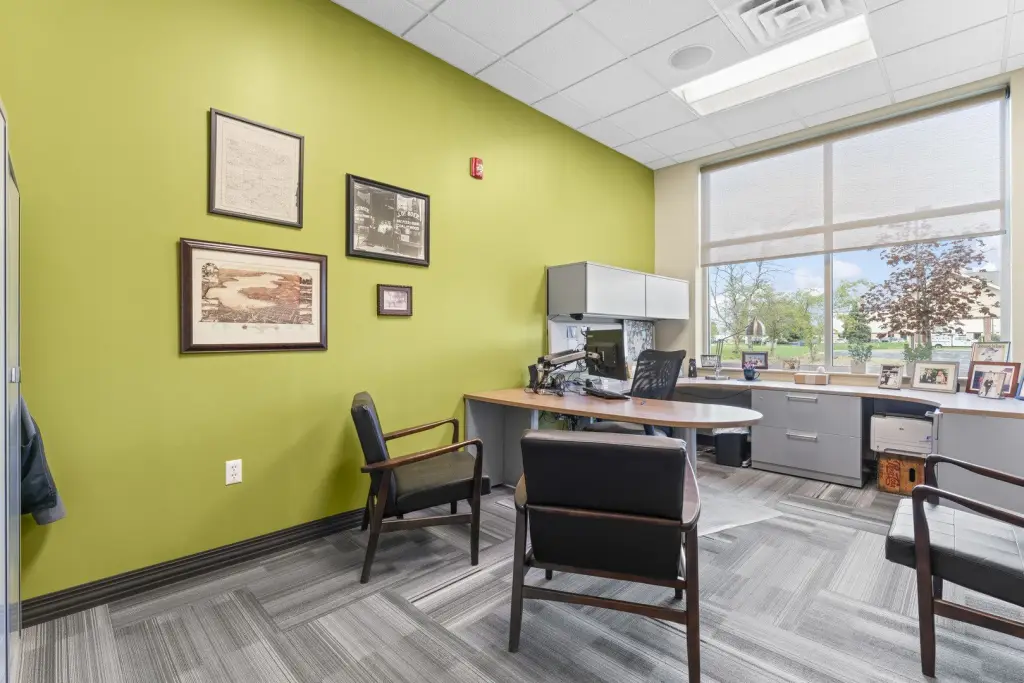
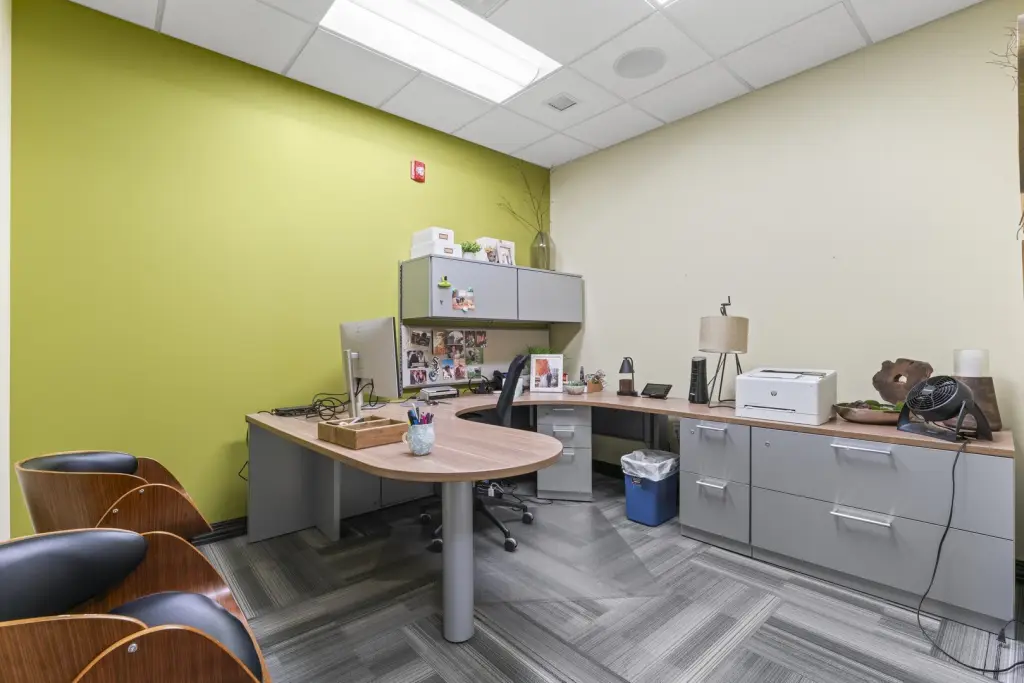
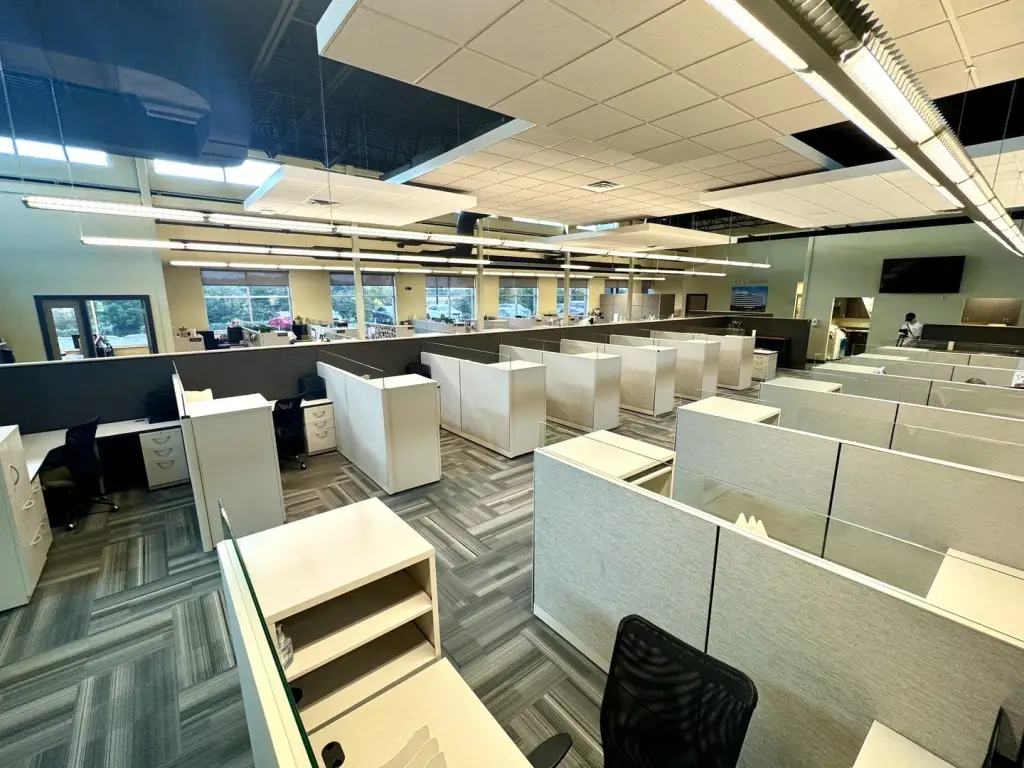
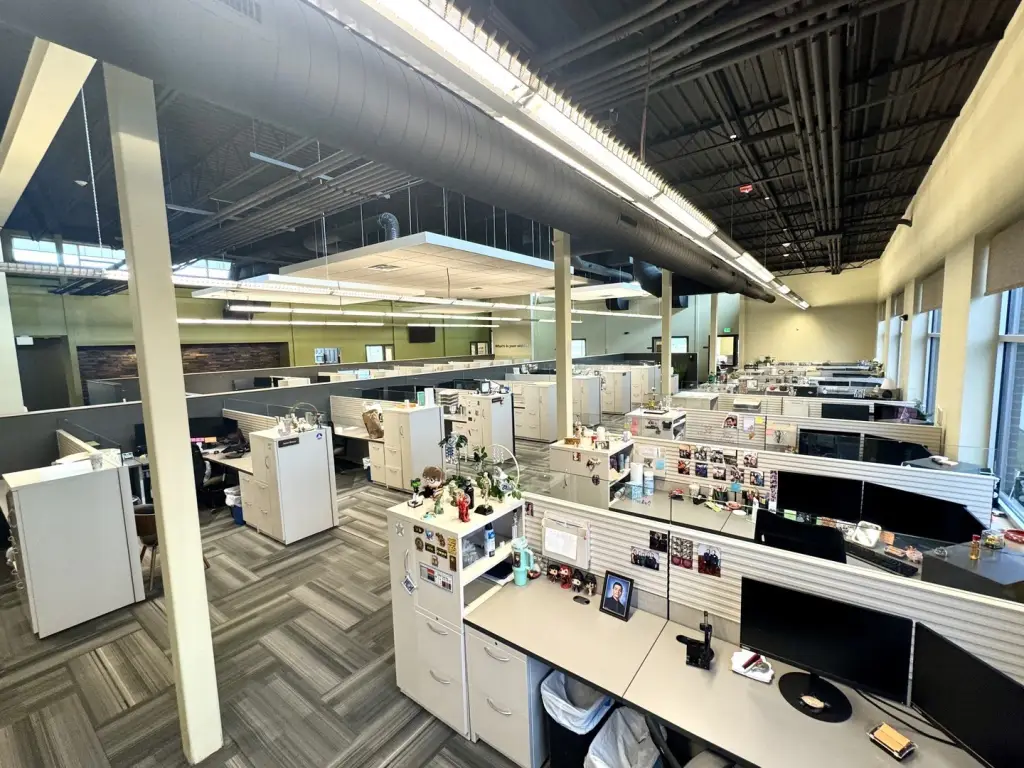
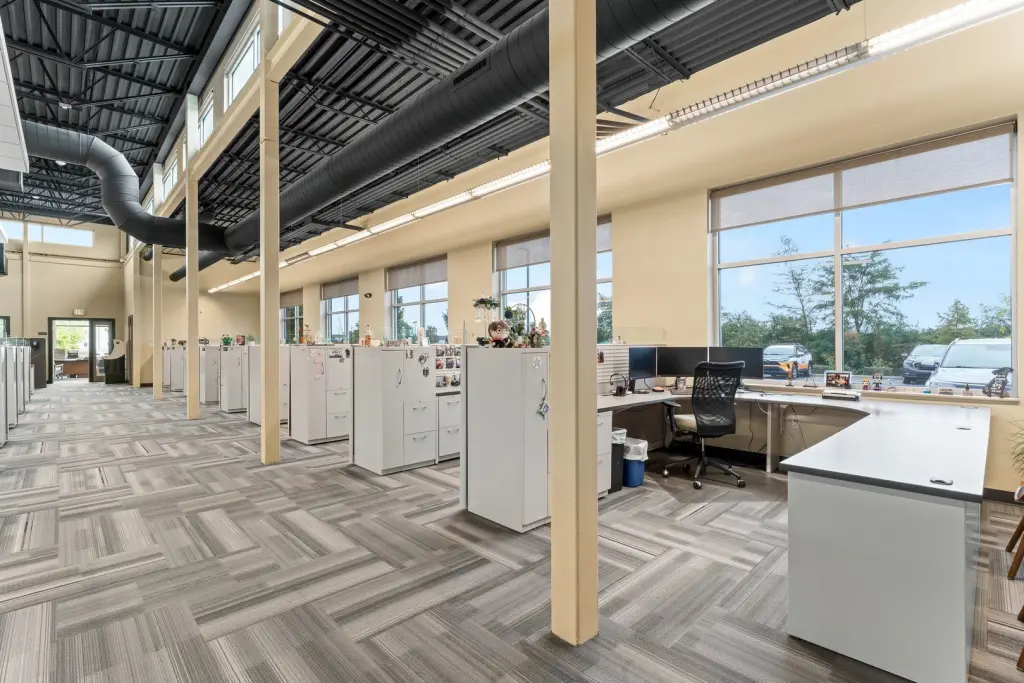
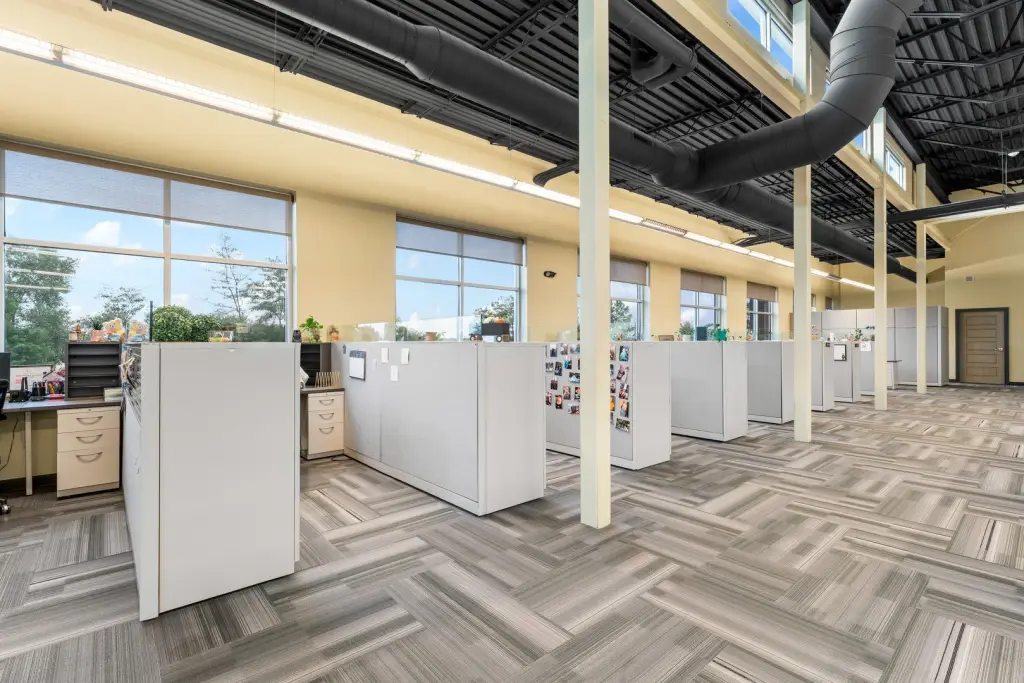
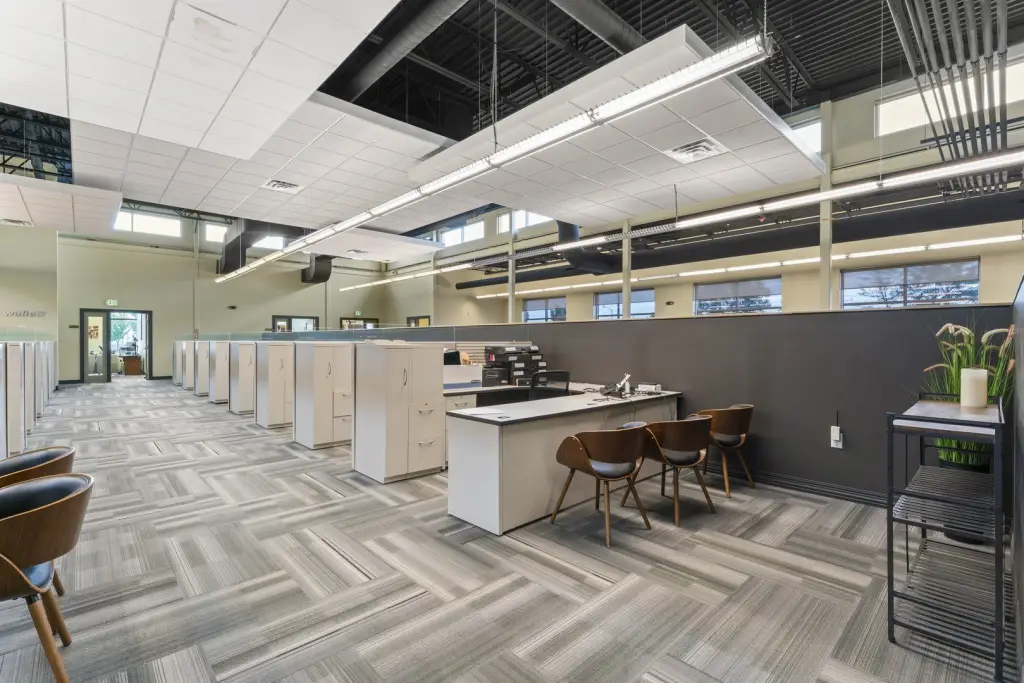
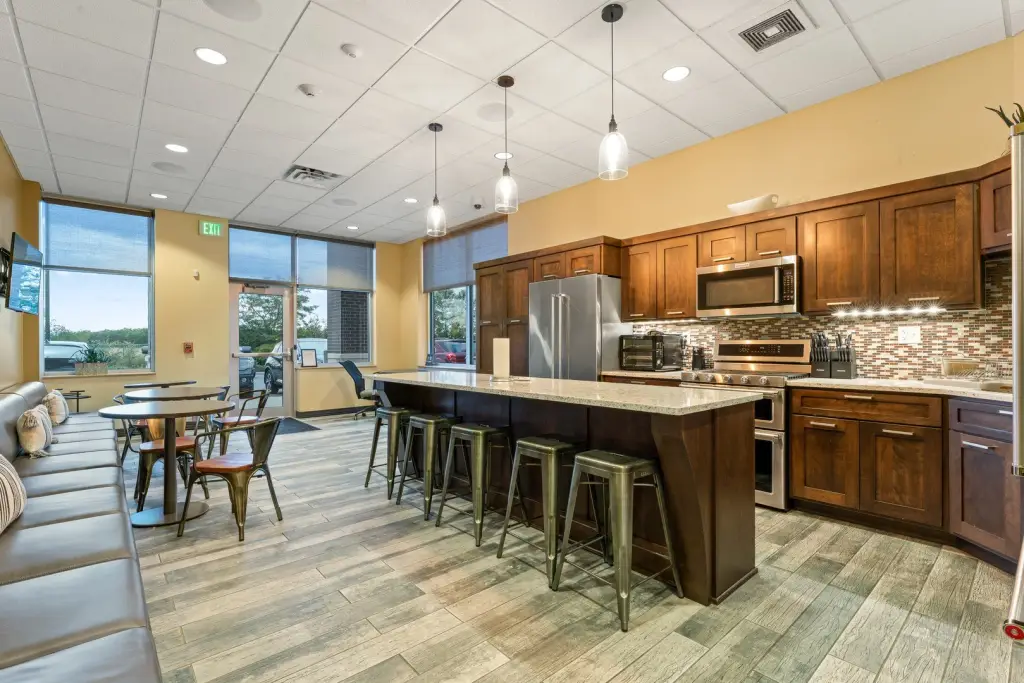
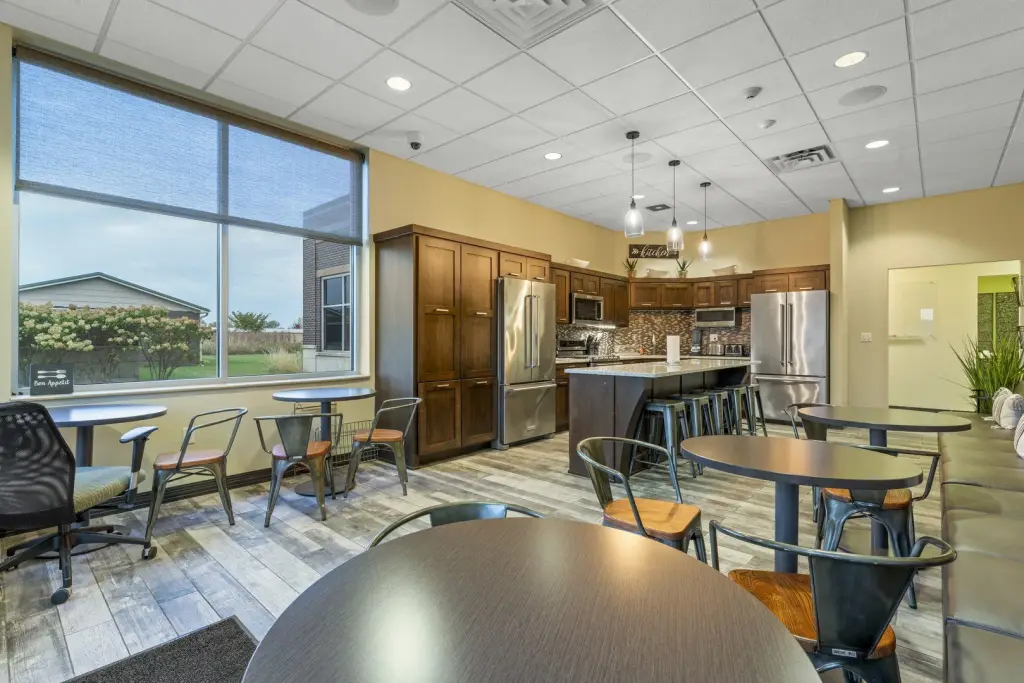
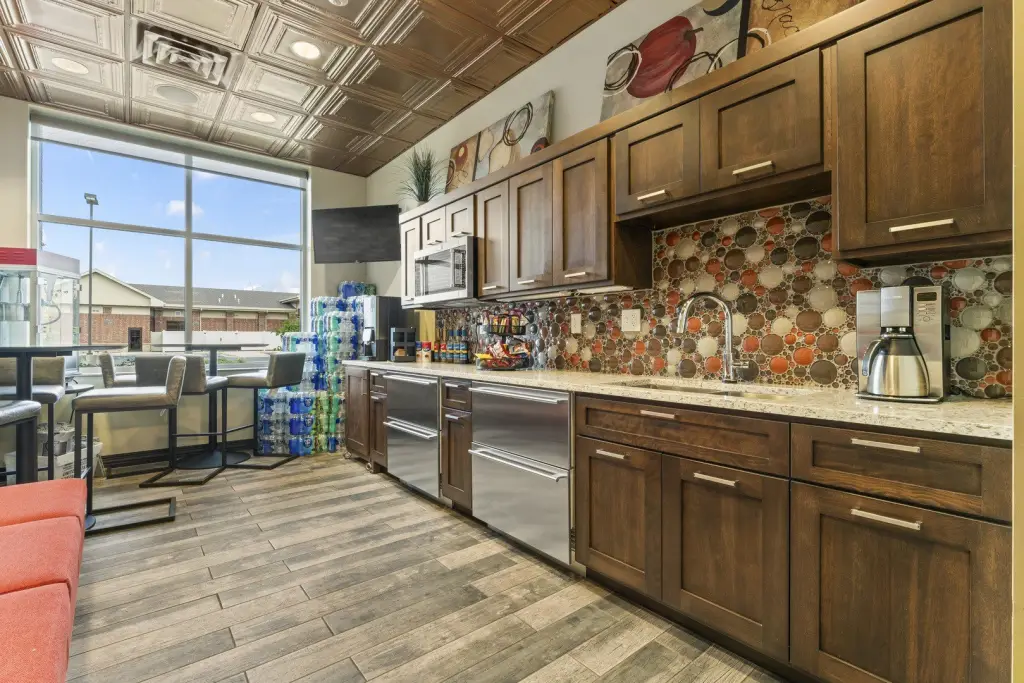
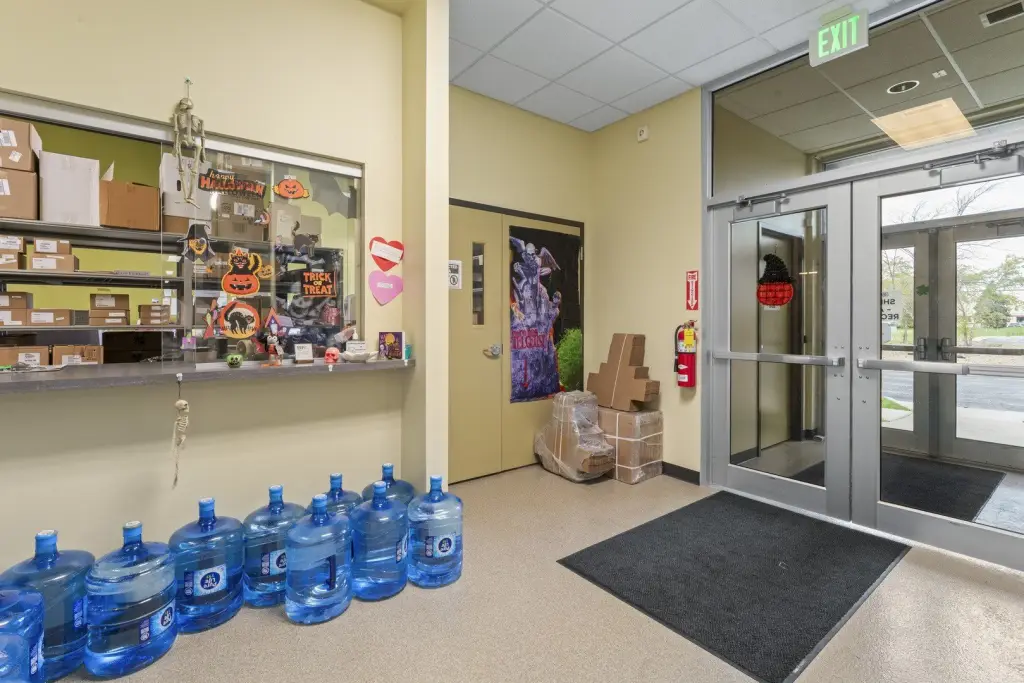
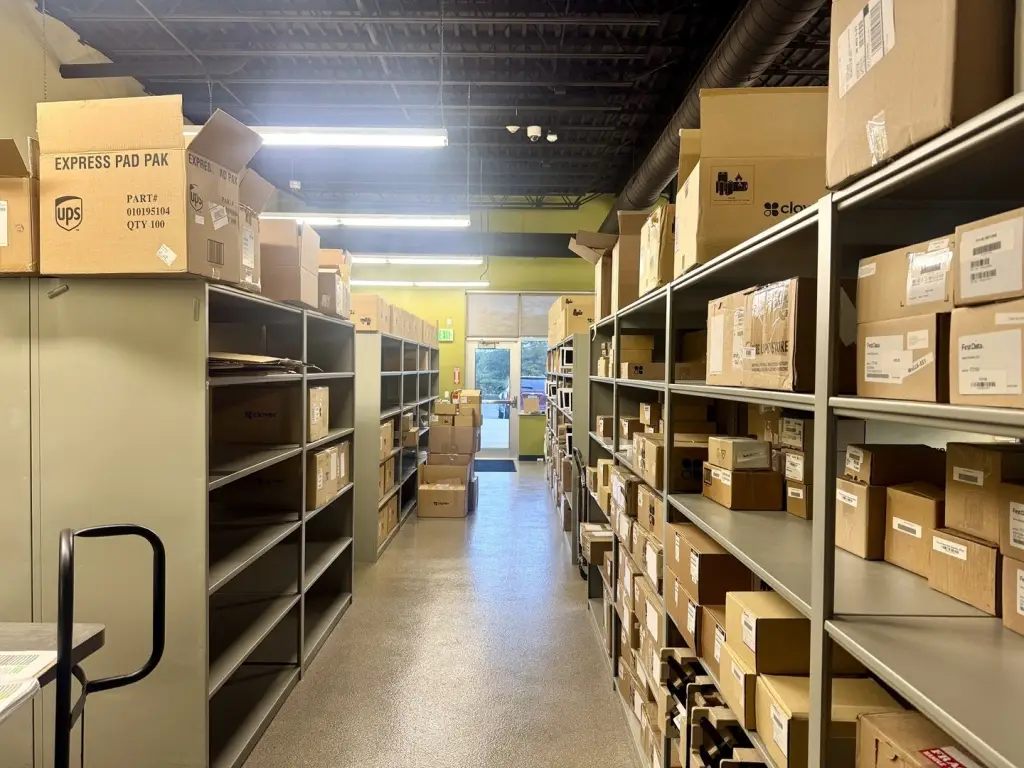
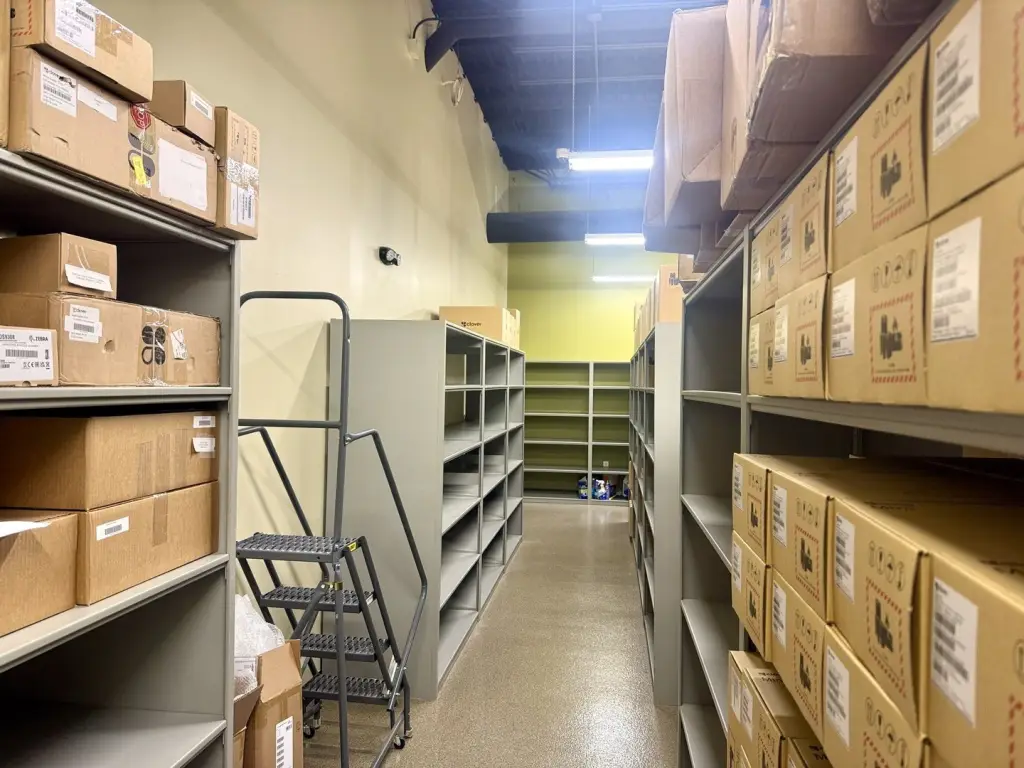
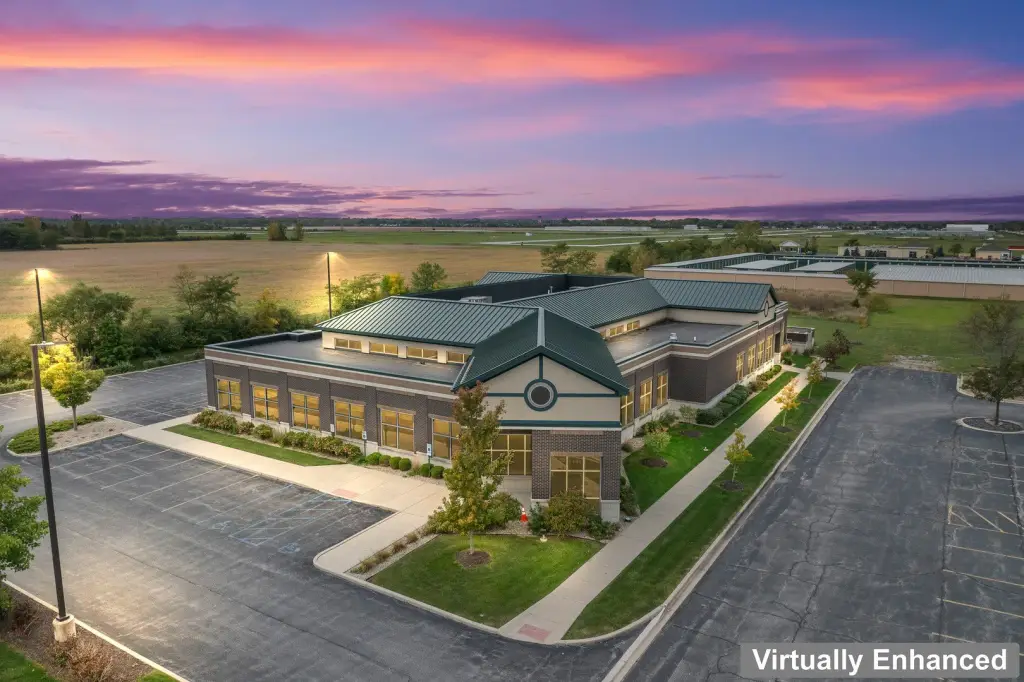
This built-out premium office or medical flex facility includes a reception and waiting area, a conference room that seats 16, and a modern break area. The office perimeter is lined with 11 private executive offices, and the open work area provides more than 50 workstations plus a copy room. Multiple restrooms and an additional employee break room with a full kitchen support day-to-day operations. Behind the offices is a shipping and warehouse area, and the property is offered with furnishings, desks, chairs, cabinetry, and workstations included.
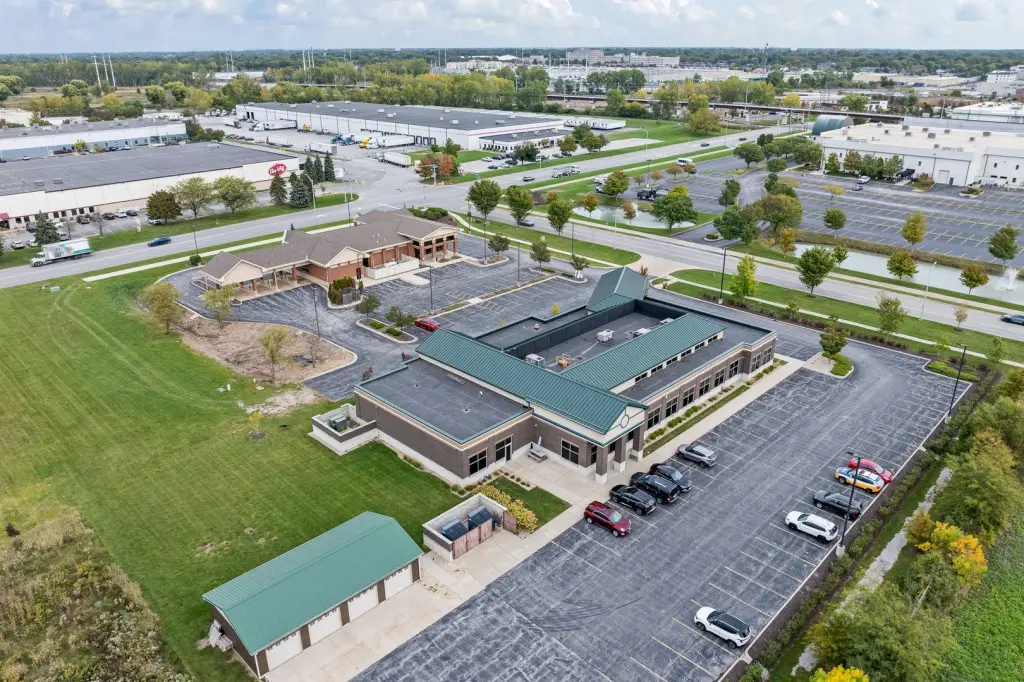
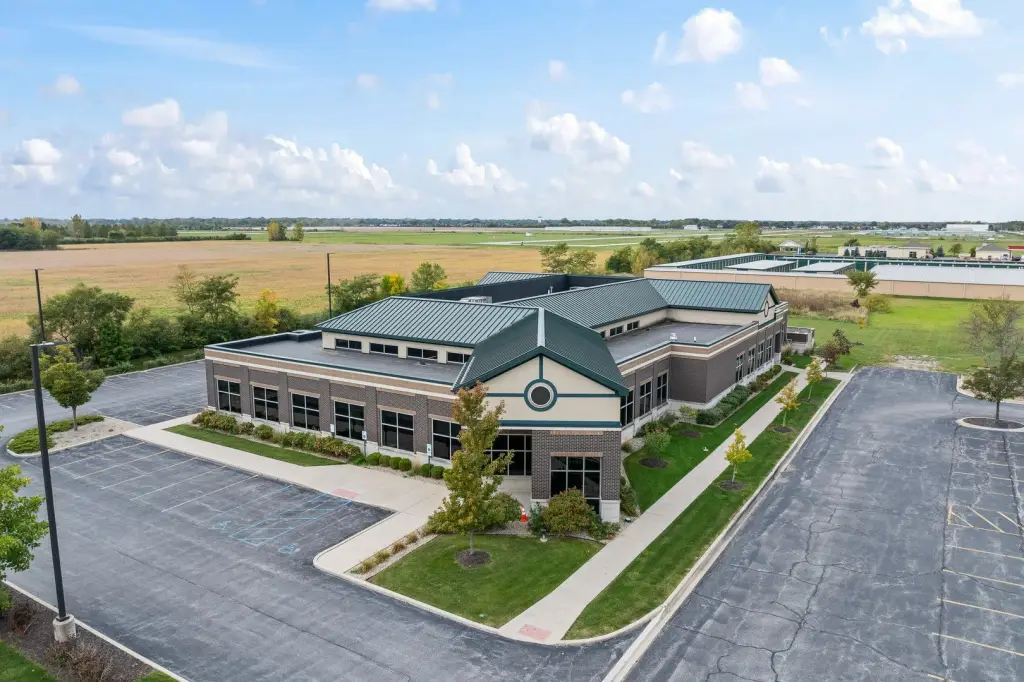
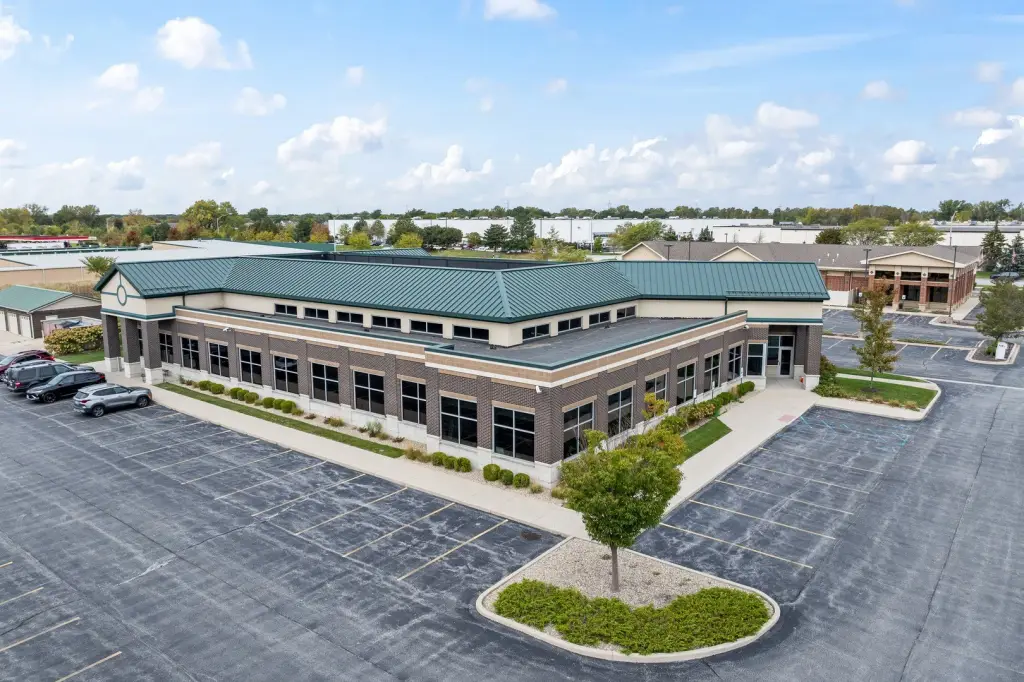
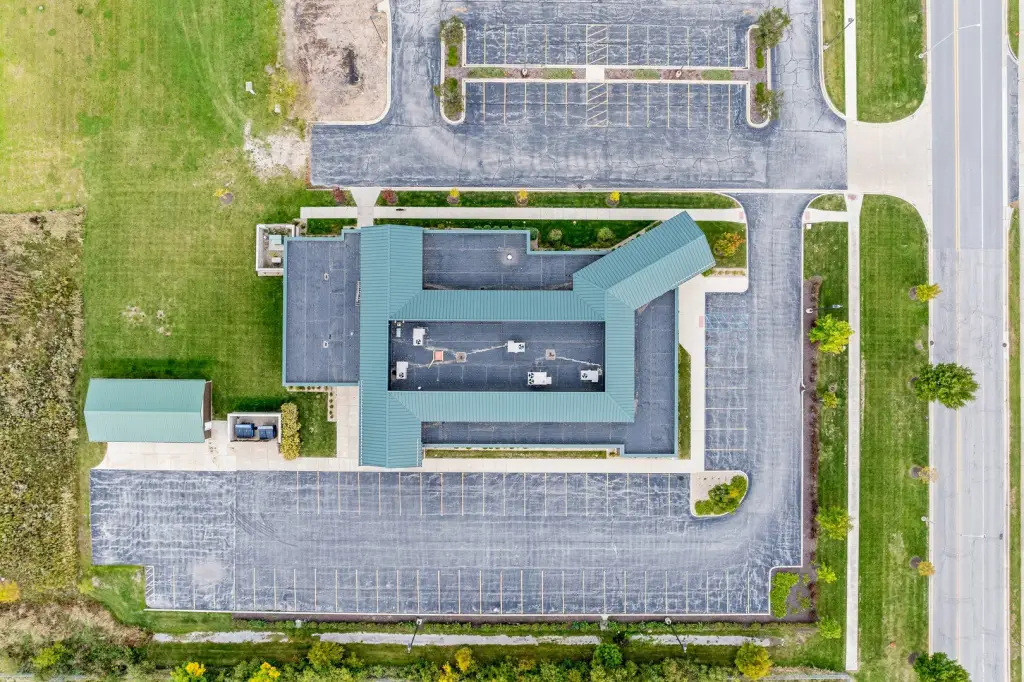
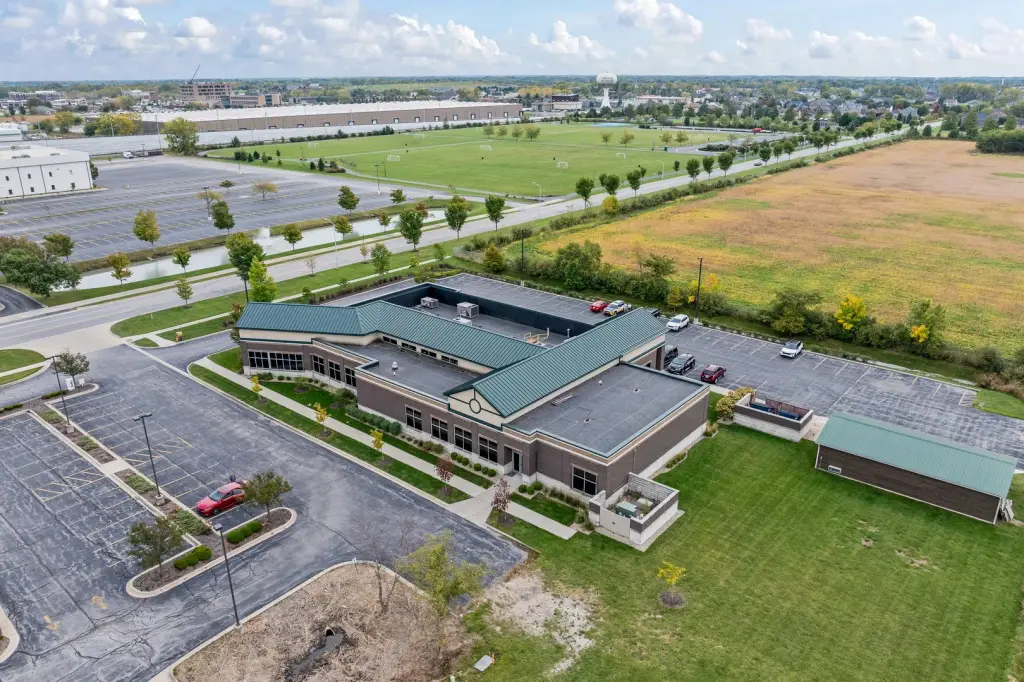
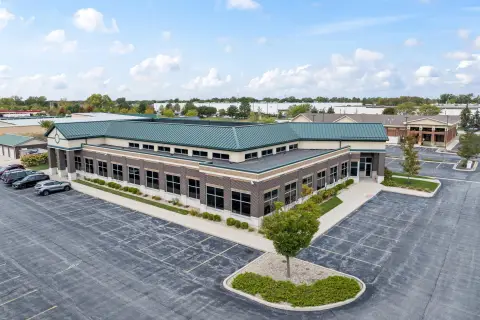
The property includes a 13,382-square-foot office building and an additional 48' x 24' (4-car) garage, adding 1,152 square feet of storage for a total of 14,534 square feet. Built in 2017, it offers 63 parking spaces plus 4 garage spaces and is zoned CD-4B for office, medical, mixed use, and civic uses. The building footprint takes up only half of the usable lot, leaving room for future development.
The location is adjacent to 45th Street and Margo Lane, the entrance to West Lakes subdivision, minutes from three area hospitals. The new South Shore commuter train is nearly complete, with the Dyer station about 3 miles away and the Munster station less than 3 miles away. The Lansing, IL Municipal Airport is about 1 mile from the property.
The property includes a 13,382-square-foot office building and an additional 48' x 24' (4-car) garage, adding 1,152 square feet of storage for a total of 14,534 square feet. Built in 2017, it offers 63 parking spaces plus 4 garage spaces and is zoned CD-4B for office, medical, mixed use, and civic uses. The building footprint takes up only half of the usable lot, leaving room for future development.
The location is adjacent to 45th Street and Margo Lane, the entrance to West Lakes subdivision, minutes from three area hospitals. The new South Shore commuter train is nearly complete, with the Dyer station about 3 miles away and the Munster station less than 3 miles away. The Lansing, IL Municipal Airport is about 1 mile from the property.
Key Highlights
- 14,534 SF office/medical building built in 2017 with central air and metal roof
- Zoned CD‑4B (Office/Medical/Mixed Use/Civic) and fully built out with office furnishings, desks, chairs, cabinetry, and workstations
- Space includes 11 private executive offices plus 50 additional workspaces, with multiple restrooms and an employee break room with full kitchen
Financial Insights For Office B
Simulate Cap Rate and NOI
NOI Build-Up
- Vacancy
- income lost from leasable area expected to sit empty during the year — subtracted from gross rent.
- EGI (Effective Gross Income)
- gross rent minus vacancy losses — the realistic income before paying operating costs.
- OpEx (Operating Expenses)
- recurring costs to operate the property (property tax, insurance, utilities, maintenance, management) — excludes financing and capital improvements.
- NOI (Net Operating Income)
- income a property generates after operating costs but before financing and taxes.
| Component | $ | $/SF |
|---|---|---|
| Gross rent | $313.9k | $21.60 |
| − Vacancy | −$68.1k | −$4.69 |
| EGI | $245.8k | $16.91 |
| − OpEx | −$61.5k | −$4.23 |
| NOI | $184.4k | $12.68 |
14,534 SF · lease $21.60/SF/yr · vacancy 21.70% · expense 25.00%
Alternative Uses
Best Use
Office B
$2.63M
$2.30M – $3.07M
NOI $184,358 @ 7.0% cap · market cap 5.76%
Second Best
Warehouse
$1.46M
$1.28M – $1.71M
NOI $102,387 @ 7.0% cap · market cap 3.20%
Theoretical Best
Specialty Retail
$4.06M
$3.55M – $4.73M
NOI $284,013 @ 7.0% cap · market cap 8.88%
Zoning and permitted uses should be independently verified with local authorities.
Property Analytics
Property Profile
Location Intelligence
Current Use by Public Records
Payroc
Corporate Office


FAQs
What type of property is this?
Flex space - Turn-key office/warehouse property with executive offices, more than 50 workspaces, and additional garage storage.
Where is this flex space located?
The property is located at 9404 Margo Lane Munster, IN.
What is the asking price?
The asking price for this property is $3,200,000.
What are key features of this property?
This property features: 14,534 SF office/medical building built in 2017 with central air and metal roof; Zoned CD‑4B (Office/Medical/Mixed Use/Civic) and fully built out with office furnishings, desks, chairs, cabinetry, and workstations; Space includes 11 private executive offices plus 50 additional workspaces, with multiple restrooms and an employee break room with full kitchen


