Medical Center
For Sale
$1,600,000
94 June Drive, Roaring Spring, PA 16673
Commercial Sale, Roaring Spring, PA
Property Size12,928 SF
Lot Size3.22 Acres
Price / SF$123.76
Days on Market340
Property Features for 94 June Drive
General Information
Property type
Commercial Sale
Property subtype
Other
Zoning
Commercial
Exterior features
Lighting
Lot features
Cleared, Level, Cleared, Level
Elementary school district
Spring Cove
Middle school district
Spring Cove
High school district
Spring Cove
Directions
Turn onto Nason Drive off Rt. 36. Turn right onto June Drive
Subdivision
Taylor Township
Standard status
Active
APN
20-8B-30
Size
12,928 SF
Lot size
3.22 Acres
Taxes and HOA fees
Tax Year
2025
Tax Annual Amount
19879
Utilities
Sewer type
Public Sewer
Heating system
Natural Gas, Forced Air
Cooling system
Central Air
Water source
Public
Building Details
Year built
2007
Floors in Building
1
Building materials
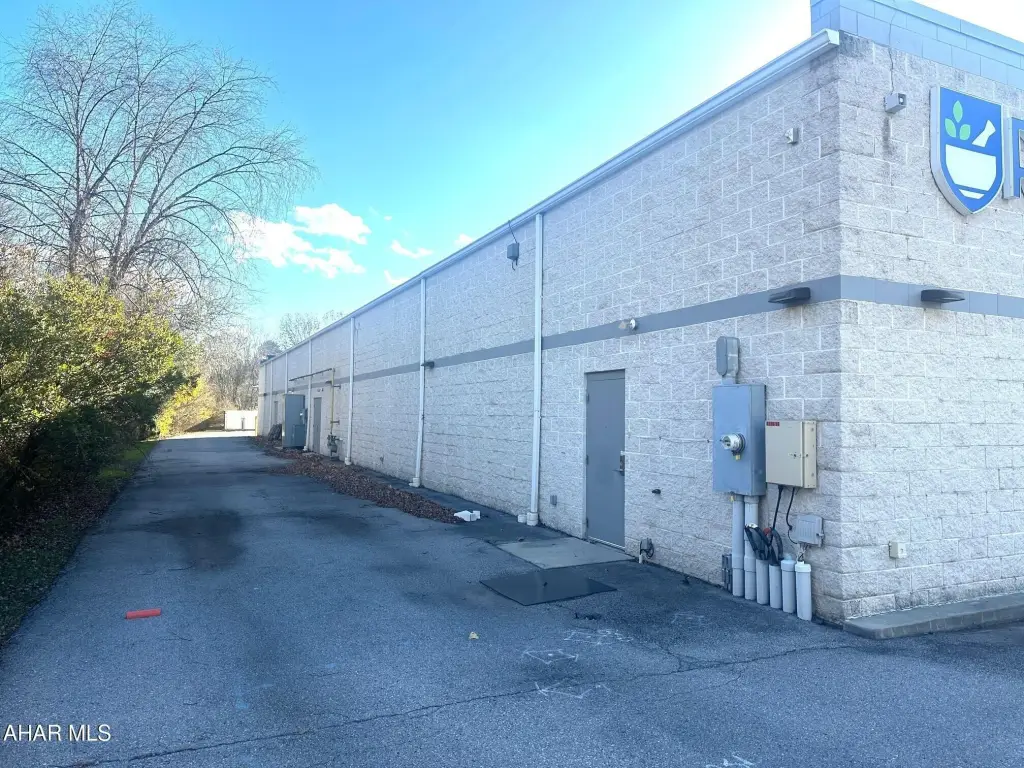
Block
Roof type
Flat
Listing Agency:
Howard Hanna Bardell Realty Altoona
(814) 313-4111
Listed By:
Holly O'Connor · License #RS202518L
(814) 934-4394
Added: Nov 15, 2025
Changed: Oct 18
Last Checked: Oct 21 at 5:06AM
MLS# 78946
Copyright © 2026 Allegheny Highland Association of Realtors. All rights reserved. All information provided by the listing agent/broker is deemed reliable but is not guaranteed and should be independently verified.

Ask AI about this property
Review the available facts, identify missing information and prepare questions for the agent.
Investment Insights
Based on property information with market context.
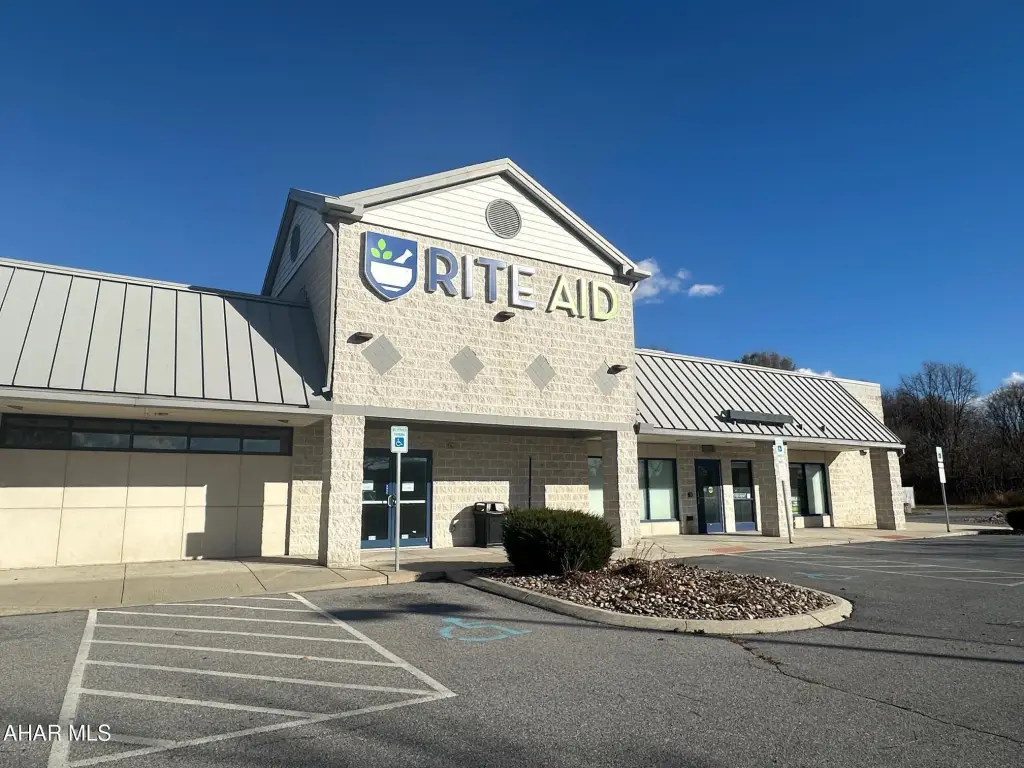
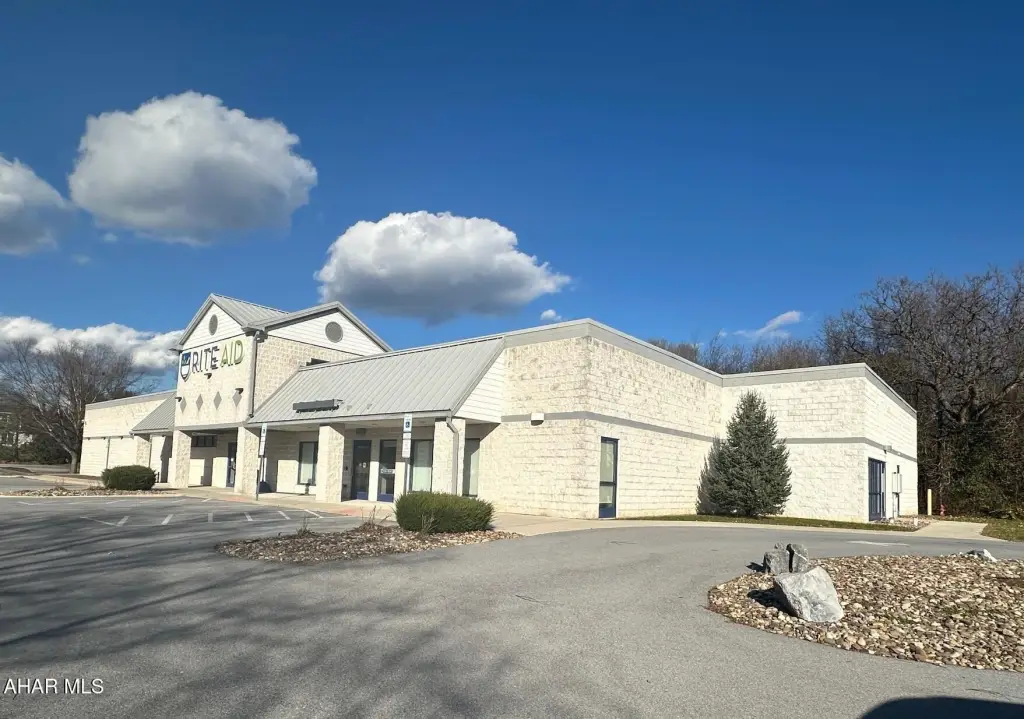
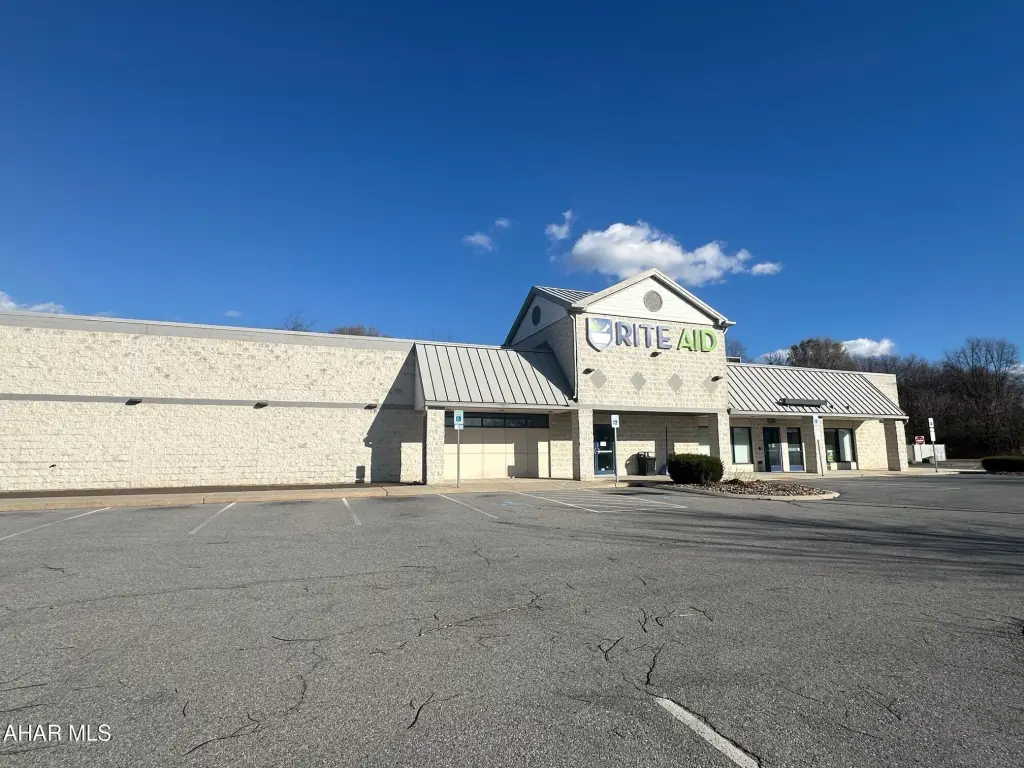
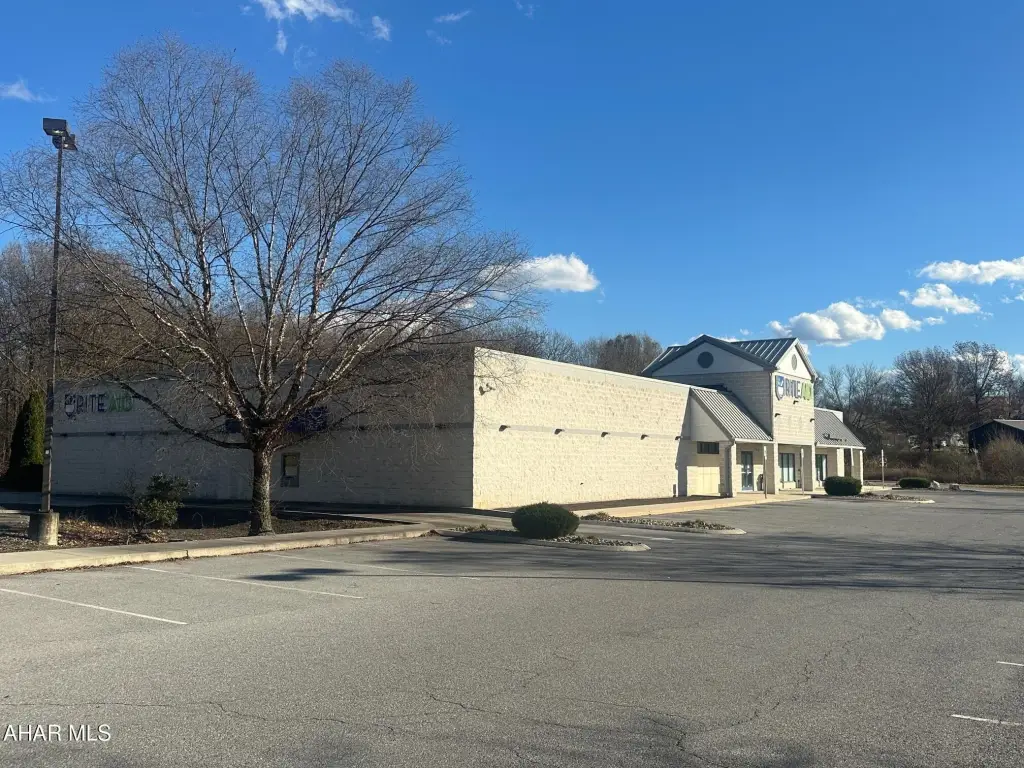
This 12,928-square-foot medical center property occupies 3.22 acres and was built in 2007. The block building includes central air, natural-gas forced-air heating, flat roofing, lighting, public water, and public sewer. The property was previously occupied by Rite Aid Pharmacy and DaVita Dialysis Center, and space is available for lease alongside the sale offering.
The building is located within 150 yards of Conemaugh Nason Medical Center in Roaring Spring, Pennsylvania. Commercial zoning supports the property’s stated medical-office, retail, and general-office positioning. Its existing utility connections and building systems provide a defined foundation for continued healthcare, office, or retail occupancy.
The building is located within 150 yards of Conemaugh Nason Medical Center in Roaring Spring, Pennsylvania. Commercial zoning supports the property’s stated medical-office, retail, and general-office positioning. Its existing utility connections and building systems provide a defined foundation for continued healthcare, office, or retail occupancy.
Key Highlights
- 12,928‑square‑foot building on 3.22 acres
- Located within 150 yards of Conemaugh Nason Medical Center
- Commercial zoning
Financial Insights
Estimated NOI and Cap Rate
NOI / Yr
$130,966
Cap Rate
8.19%
Suggested Prices Based on Cap Rates
Cap Rate 5%
$2,619,320
$2.6M
Cap Rate 7%
$1,870,943
$1.9M
Cap Rate 9%
$1,455,178
$1.5M
Market Conditions
NOI Build-Up for 12,928 SF
Gross rent
$217.2K $16.80/SF
− Vacancy
−$42.6K −$3.29/SF
EGI
$174.6K $13.51/SF
− OpEx
−$43.7K −$3.38/SF
NOI
$131.0K $10.13/SF
Area
Blair County, PA
Vacancy
19.60%
Lease Rate
$16.80 /SF/Yr
Expense Ratio
25.00%
Simulate Cap Rate and NOI
Suggested Prices Based on Cap Rates
Cap Rate 5%
$2,619,320
Cap Rate 7%
$1,870,943
Cap Rate 9%
$1,455,178
Alternative Uses
Best Use
Healthcare Medical
$2.13M
$1.86M – $2.48M
NOI $149,047 @ 7.0% cap · market cap 9.32%
Second Best
Office B
$1.87M
$1.64M – $2.18M
NOI $130,966 @ 7.0% cap · market cap 8.19%
Theoretical Best
Warehouse
$15.70M
$13.74M – $18.32M
NOI $1,099,168 @ 7.0% cap · market cap 68.70%
Zoning and permitted uses should be independently verified with authorities.
How Realmo checks its estimates
Property Analytics
Unlock full access to Insights
Subscribe to Realmo Intelligence
Open Analytics
Current Use
Location Intelligence
Trade Area within ½ mile
326
Businesses Nearby
Explore this area
Business Placement
Demographics for 16673, PA
5,317
Population
2,302
Households
2.3
Avg Household Size
44
Median Age
19%
College-Educated
93%
High-School Grad
34.4 sq mi
ZIP Area
155
Density / Sq Mi
$69,119
Median Household Income
$40,691
Median Earnings
$850
Median Rent
$154,700
Median Home Value
Check the figures for this property
Cap Rate, Value Estimation, Potential NOI and more
View Realmo Analytics
Market
Vacancy Rate% for Office in Northeast region
Frequently Asked Questions
What type of property is this?
Medical center - Commercially zoned property with adaptable space for medical, retail, and general office uses.
Where is this medical center located?
The property is located at 94 June Drive Roaring Spring, PA.
What is the asking price?
The asking price for this property is $1,600,000.
What are key features of this property?
This property features: 12,928‑square‑foot building on 3.22 acres; Located within 150 yards of Conemaugh Nason Medical Center; Commercial zoning


