Updated Duplex with RV





For Sale
$529,990
935 17TH Avenue S, St Petersburg, FL 33705
Residential Income, ST PETERSBURG, FL
Property Size2,448 SF
Lot Size0.16 Acres
Price / SF$216.50
Days on Market52
Property Features for 935 17TH Avenue S
General Information
Property type
Residential Multi Family
Property subtype
Duplex
Bedrooms
8
Bathrooms
4
Full bathrooms
4
Rooms
Bedroom 3, Bedroom 4, Bedroom 6, Bathroom 2, Bathroom 1, Bedroom 7, Bedroom 2, Bedroom 8, Bathroom 4, Bedroom 5, Bedroom 1, Bathroom 3
Parking features
RV, Driveway, On Street, Off Street
Pets allowed
Yes
Interior features
Solid Surface Counters
Exterior features
Private Mailbox, Private Yard
Appliances
Convection Oven, Microwave, Refrigerator
Subdivision
ARMSTRONGS SUB F A
Elementary school
James Sanderlin Elementary-PN
Middle school
John Hopkins Middle-PN
High school
St. Petersburg High-PN
Directions
Take Exit 22 (I-175 E) toward Tropicana Field. Take the exit for 9th St S / Dr. MLK Jr. St S. Turn Right (South) onto 9th St S / Dr. MLK Jr. St S and continue for approximately 1 mile. Turn Right (West) onto 17th Ave S. The property (935 17th Ave S) will be on your Right.
Standard status
Active
APN
25-31-16-01548-000-0050
Size
2,448 SF
Lot size
0.16 Acres
Taxes and HOA fees
Tax Year
2025
Tax Description
ARMSTRONG'S SUB, F.A., W 27FT OF LOT 5 & E 23.4FT OF LOT 6, LESS N 5FT FOR RD R/W
Tax Annual Amount
5163
Legal Description
ARMSTRONG'S SUB, F.A., W 27FT OF LOT 5 & E 23.4FT OF LOT 6, LESS N 5FT FOR RD R/W
Utilities
Utilities
Cable Available
Sewer type
Public Sewer
Cooling system
Wall/Window Unit(s), Window Unit(s)
Water source
Public
Amenities
washer/dryer hookups
private fenced backyard
Building Details
Year built
1953
Floors in Building
1
Flooring type
Vinyl
Building materials
Frame
Roof type
Shingle
Listing Agency:
DALTON WADE INC
(888) 668-8283
Listed By:
Carissa White
(253) 293-4590
Added: Sep 2
Changed: Oct 19
Last Checked: Oct 23 at 3:06PM
MLS# TB8545200
Copyright © 2026 Stellar MLS. All rights reserved. All information provided by the listing agent/broker is deemed reliable but is not guaranteed and should be independently verified.

Ask AI about this property
Review the available facts, identify missing information and prepare questions for the agent.
Investment Insights
Based on property information with market context.
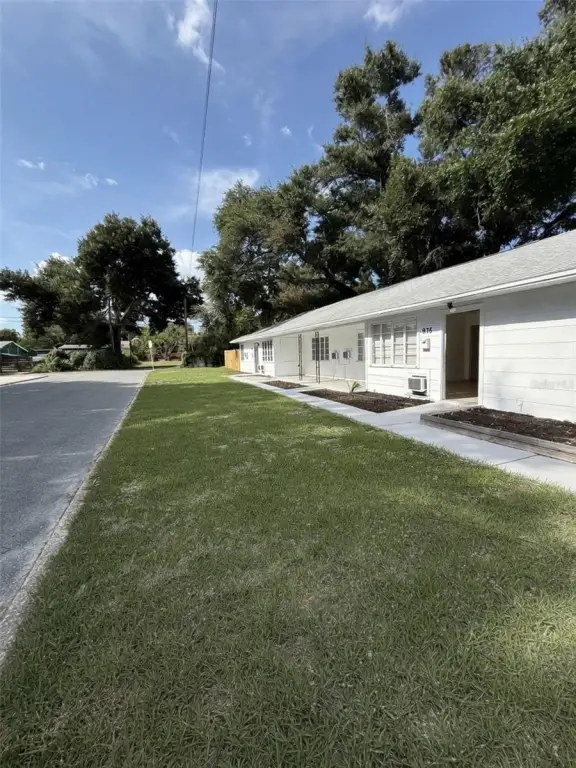
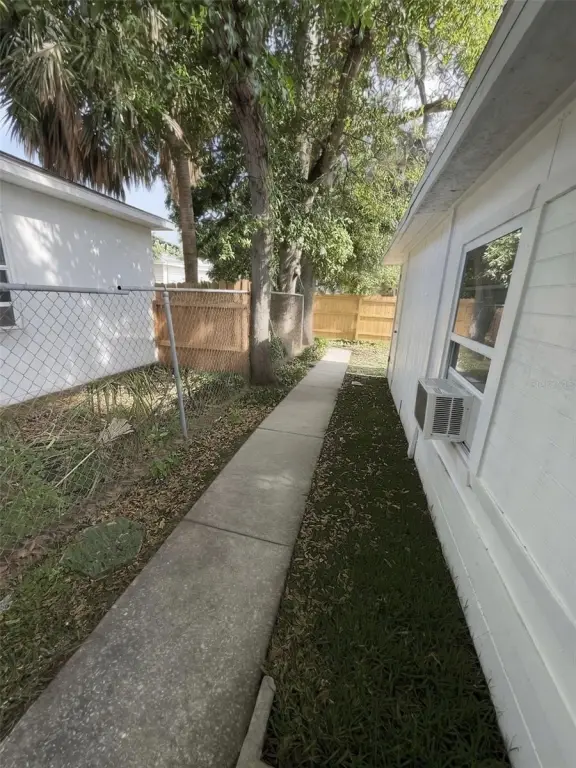
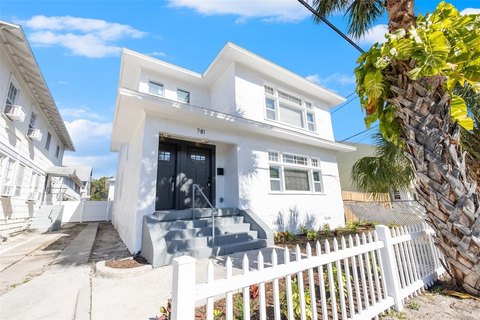
This 2,448-square-foot duplex contains two matching four-bedroom, two-bath units, each measuring 1,224 square feet. Recent work includes a roof update, refreshed kitchens and bathrooms, new flooring and lighting, butcher block countertops, and washer/dryer hookups in both units. Each residence also has a fenced private backyard.
The property sits on a 0.16-acre oversized corner lot at 935 17TH Avenue S in St. Petersburg. A detached concrete pad provides separate RV parking, while additional parking options include a driveway, off-street spaces, and on-street parking. Public water and public sewer serve the property, which was built in 1953.
The location is minutes from Downtown St. Petersburg, shopping, dining, major employers, and local colleges. Additional features include vinyl flooring, solid surface counters, wall/window cooling units, public mailbox service, and cable availability.
The property sits on a 0.16-acre oversized corner lot at 935 17TH Avenue S in St. Petersburg. A detached concrete pad provides separate RV parking, while additional parking options include a driveway, off-street spaces, and on-street parking. Public water and public sewer serve the property, which was built in 1953.
The location is minutes from Downtown St. Petersburg, shopping, dining, major employers, and local colleges. Additional features include vinyl flooring, solid surface counters, wall/window cooling units, public mailbox service, and cable availability.
Key Highlights
- Two‑unit duplex with 2,448 SF total; each unit measures 1,224 SF
- Each unit includes 4 bedrooms and 2 bathrooms
- Recent updates include roof, kitchens, bathrooms, flooring, lighting, and countertops
Financial Insights
Estimated NOI and Cap Rate
NOI / Yr
$28,574
Cap Rate
5.39%
Suggested Prices Based on Cap Rates
Cap Rate 5%
$571,480
$571.5K
Cap Rate 7%
$408,200
$408.2K
Cap Rate 9%
$317,489
$317.5K
Market Conditions
NOI Build-Up for 2,448 SF
Gross rent
$43.8K $17.88/SF
− Vacancy
−$3.0K −$1.21/SF
EGI
$40.8K $16.67/SF
− OpEx
−$12.2K −$5.00/SF
NOI
$28.6K $11.67/SF
Area
Pinellas County, FL
Vacancy
6.74%
Lease Rate
$17.88 /SF/Yr
Expense Ratio
30.00%
Simulate Cap Rate and NOI
Suggested Prices Based on Cap Rates
Cap Rate 5%
$571,480
Cap Rate 7%
$408,200
Cap Rate 9%
$317,489
Alternative Uses
Best Use
Multifamily LT 5
$408.2K
$357.2K – $476.2K
NOI $28,574 @ 7.0% cap · market cap 5.39%
Second Best
Apartment 5plus
$321.6K
$281.4K – $375.3K
NOI $22,515 @ 7.0% cap · market cap 4.25%
Theoretical Best
Office A
$636.7K
$557.2K – $742.9K
NOI $44,572 @ 7.0% cap · market cap 8.41%
Zoning and permitted uses should be independently verified with authorities.
How Realmo checks its estimates
Property Analytics
Contact the owner directly
Get the owner's phone numbers and email
Open Analytics
Lease Details
2
Residential units
Location Intelligence
Trade Area within ½ mile
969
Businesses Nearby
Explore this area
Business Placement
Demographics for 33705, FL
27,915
Population
15,171
Households
1.8
Avg Household Size
43
Median Age
36%
College-Educated
92%
High-School Grad
5.6 sq mi
ZIP Area
4,985
Density / Sq Mi
$70,783
Median Household Income
$40,370
Median Earnings
$1,457
Median Rent
$321,500
Median Home Value
Check the figures for this property
Cap Rate, Value Estimation, Potential NOI and more
View Realmo Analytics
Market
Vacancy Rate% for Multifamily in South region




Frequently Asked Questions
What type of property is this?
Duplex - Two matching units offer four bedrooms and two baths apiece.
Where is this duplex located?
The property is located at 935 17TH Avenue S St Petersburg, FL.
What is the asking price?
The asking price for this property is $529,990.
What are key features of this property?
This property features: Two‑unit duplex with 2,448 SF total; each unit measures 1,224 SF; Each unit includes 4 bedrooms and 2 bathrooms; Recent updates include roof, kitchens, bathrooms, flooring, lighting, and countertops


