Renovated Restaurant
For Sale
$2,084,001
932 Division Ave S, Grand Rapids, MI 49507
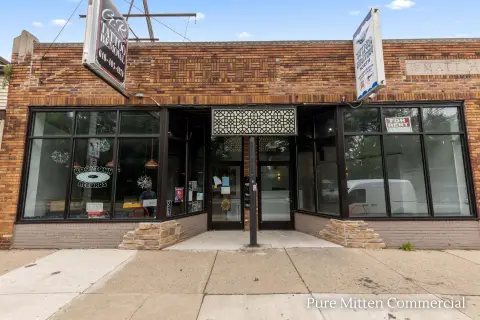
The building includes banquet and restaurant areas and was renovated in 2024.
Property Size7,274 SF
Price / SF$286.50
Days on Market458
Property Features for 932 Division Ave S
General Information
Standard status
Active
Size
7,274 SF
Property subtype
Retail
Zoning
TBA - TRADITIONAL BUSINESS AREA
Additional Details
Sprinkler System
Yes
Amenities
Water
Sewer
Building Details
Year Renovated
2024
Buildings
1
Listing Agency:
Ben M. Muller Realty Co., Inc.
Listed By:
Emily Woodward
(616) 456-7114
Source:
Carwm.resimplifi
Added: Jul 15, 2025
Changed: Oct 12
Last Checked: Oct 14 at 7:41PM
Displayed information is deemed reliable but is not guaranteed and should be independently verified. All listing content including descriptions, pricing, images are the copyrighted material of Ben M. Muller Realty Co., Inc.
Investment Insights
Based on property information with market context.
This freestanding commercial building is configured for a 218-seat banquet facility alongside an 80-seat restaurant. The property underwent a complete renovation in 2024 and is fully sprinklered.
Located at 932 Division Ave S in Grand Rapids, Michigan, the building is zoned TBA - TRADITIONAL BUSINESS AREA. The property remains occupied, and showings require listing-agent coordination with 24 hours' advance notice.
Located at 932 Division Ave S in Grand Rapids, Michigan, the building is zoned TBA - TRADITIONAL BUSINESS AREA. The property remains occupied, and showings require listing-agent coordination with 24 hours' advance notice.
Key Highlights
- 218‑seat banquet facility
- 80‑seat restaurant
- Completely renovated in 2024
Financial Insights
Estimated NOI and Cap Rate
NOI / Yr
$118,166
Cap Rate
5.67%
Suggested Prices Based on Cap Rates
Cap Rate 5%
$2,363,320
$2.4M
Cap Rate 7%
$1,688,086
$1.7M
Cap Rate 9%
$1,312,956
$1.3M
Market Conditions
NOI Build-Up for 7,274 SF
Gross rent
$165.8K $22.80/SF
− Vacancy
−$8.3K −$1.14/SF
EGI
$157.6K $21.66/SF
− OpEx
−$39.4K −$5.42/SF
NOI
$118.2K $16.25/SF
Area
Grand Rapids, MI
Vacancy
5.00%
Lease Rate
$22.80 /SF/Yr
Expense Ratio
25.00%
Simulate Cap Rate and NOI
Suggested Prices Based on Cap Rates
Cap Rate 5%
$2,363,320
Cap Rate 7%
$1,688,086
Cap Rate 9%
$1,312,956
Alternative Uses
Best Use
Specialty Retail
$1.69M
$1.48M – $1.97M
NOI $118,166 @ 7.0% cap · market cap 5.67%
Second Best
—
—
no second resolved use
Theoretical Best
—
—
same as Best Use
Zoning and permitted uses should be independently verified with authorities.
How Realmo checks its estimates
Property Analytics
Unlock full access to Insights
Subscribe to Realmo Intelligence
Open Analytics
Current Use
Lease Details
Yes
Sprinkler system
Location Intelligence
Trade Area within ½ mile
791
Businesses Nearby
54k
Monthly Visits Nearby
Under-served
Demand for This Use
Explore this area
Business Placement
Foot Traffic Nearby
Dining 59%
Shops & Services 38%
Home Improvements & Furnishings 3%
Electronics 1%
McDonald's
Dining
20,807 visits/mo
0.4 miles
Burger King
Dining
9,500 visits/mo
0.2 miles
Dollar Tree
Shops & Services
9,144 visits/mo
0.1 miles
Family Dollar
Shops & Services
6,683 visits/mo
0.5 miles
AutoZone
Shops & Services
4,393 visits/mo
0.4 miles
Demographics for 49507, MI
38,137
Population
13,773
Households
2.8
Avg Household Size
30
Median Age
27%
College-Educated
78%
High-School Grad
5.5 sq mi
ZIP Area
6,934
Density / Sq Mi
$56,578
Median Household Income
$34,939
Median Earnings
$1,114
Median Rent
$179,600
Median Home Value
Check the figures for this property
Cap Rate, Value Estimation, Potential NOI and more
View Realmo Analytics

Questions? Ask Rey
Realmo’s AI knows this listing — price, zoning, demand, history. Ask anything.



Frequently Asked Questions
What type of property is this?
Conventional restaurant - The building includes banquet and restaurant areas and was renovated in 2024.
Where is this conventional restaurant located?
The property is located at 932 Division Ave S Grand Rapids, MI.
What is the asking price?
The asking price for this property is $2,084,001.
What are key features of this property?
This property features: 218‑seat banquet facility; 80‑seat restaurant; Completely renovated in 2024


