CVS Pharmacy Drug
For Sale
Contact for pricing
930 Winchester Rd NE, Huntsville, AL 35811
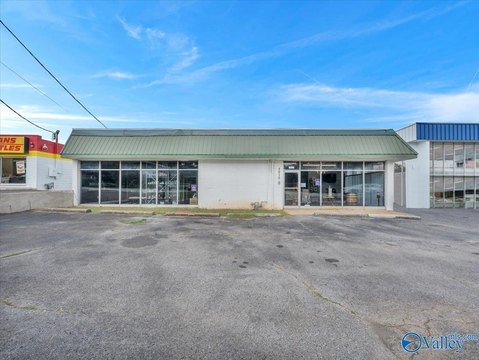
Freestanding pharmacy asset within a fully leased Alabama portfolio backed by a corporate guaranty from CVS Health Corporation.
Property Size10,125 SF
Price / SF$216.63
Days on Market63
Property Features for 930 Winchester Rd NE
General Information
Standard status
Active
Size
10,125 SF
Property subtype
Retail
Occupancy
100%
Lease Type
NN
Net Operating Income
$164,506
Building Details
Year Built
2000
Stories
1
Units
1
Tenancy
Single
Listing Agency:
Marcus & Millichap - Mobile
Listed By:
Andrew Chason · License #AL 000079317-0
(205) 871-5360
Source:
Crexi
Added: Aug 14
Changed: Oct 10
Last Checked: Oct 14 at 11:45PM
Displayed information is deemed reliable but is not guaranteed and should be independently verified. All listing content including descriptions, pricing, images are the copyrighted material of Marcus & Millichap - Mobile

Ask AI about this property
Review the available facts, identify missing information and prepare questions for the agent.
Investment Insights
Based on property information with market context.
This offering includes a 10,125-square-foot CVS Pharmacy at 930 Winchester Rd NE in Huntsville, Alabama, constructed in 2000. The property is part of a six-store Alabama portfolio with assets in Dothan, Montgomery, Vestavia Hills, Hueytown, Huntsville, and Madison. Buyers may pursue the portfolio or acquire individual properties separately.
The stores are 100 percent leased to Alabama CVS Pharmacy, LLC, with a corporate guaranty from CVS Health Corporation. Five locations share the same lease structure, while the Huntsville asset is offered as a leasehold interest. Remaining primary lease terms are approximately 12 to 14 years, with five leases running through 2038 and the Huntsville lease extending through 2040.
The portfolio uses a net lease structure under which tenants reimburse taxes, insurance, common area expenses, and amortized parking lot repairs and replacements. Roof systems at all six properties were installed or replaced between 2018 and 2026 and carry manufacturer warranties ranging from 15 to 20 years. CVS has operated at the locations for an average of approximately 27 years.
The stores are 100 percent leased to Alabama CVS Pharmacy, LLC, with a corporate guaranty from CVS Health Corporation. Five locations share the same lease structure, while the Huntsville asset is offered as a leasehold interest. Remaining primary lease terms are approximately 12 to 14 years, with five leases running through 2038 and the Huntsville lease extending through 2040.
The portfolio uses a net lease structure under which tenants reimburse taxes, insurance, common area expenses, and amortized parking lot repairs and replacements. Roof systems at all six properties were installed or replaced between 2018 and 2026 and carry manufacturer warranties ranging from 15 to 20 years. CVS has operated at the locations for an average of approximately 27 years.
Key Highlights
- 10,125‑square‑foot CVS Pharmacy at 930 Winchester Rd NE, Huntsville, AL 35811
- Six‑property Alabama portfolio with assets in Dothan, Montgomery, Vestavia Hills, Hueytown, Huntsville, and Madison
- 100 percent leased to Alabama CVS Pharmacy, LLC with a corporate guaranty from CVS Health Corporation
Financial Insights
Estimated NOI and Cap Rate
NOI / Yr
$141,426
Cap Rate
6.45%
Suggested Prices Based on Cap Rates
Cap Rate 5%
$2,828,520
$2.8M
Cap Rate 7%
$2,020,371
$2.0M
Cap Rate 9%
$1,571,400
$1.6M
Market Conditions
NOI Build-Up for 10,125 SF
Gross rent
$194.4K $19.20/SF
− Vacancy
−$5.8K −$0.58/SF
EGI
$188.6K $18.62/SF
− OpEx
−$47.1K −$4.66/SF
NOI
$141.4K $13.97/SF
Area
Huntsville, AL
Vacancy
3.00%
Lease Rate
$19.20 /SF/Yr
Expense Ratio
25.00%
Simulate Cap Rate and NOI
Suggested Prices Based on Cap Rates
Cap Rate 5%
$2,828,520
Cap Rate 7%
$2,020,371
Cap Rate 9%
$1,571,400
Alternative Uses
Best Use
Specialty Retail
$2.02M
$1.77M – $2.36M
NOI $141,426 @ 7.0% cap · market cap 6.45%
Second Best
Retail
$1.77M
$1.55M – $2.06M
NOI $123,748 @ 7.0% cap · market cap 5.64%
Theoretical Best
Office A
$2.64M
$2.31M – $3.08M
NOI $184,559 @ 7.0% cap · market cap 8.41%
Zoning and permitted uses should be independently verified with authorities.
How Realmo checks its estimates
Property Analytics
Unlock full access to Insights
Subscribe to Realmo Intelligence
Open Analytics
Current Use
Location Intelligence
Trade Area within ½ mile
195
Businesses Nearby
85k
Monthly Visits Nearby
Well-served
Demand for This Use
Explore this area
Business Placement
Foot Traffic Nearby
Groceries 38%
Shops & Services 35%
Dining 27%
Kroger
Groceries
32,560 visits/mo
0.2 miles
SONIC Drive In
Dining
13,506 visits/mo
0.2 miles
Circle K
Shops & Services
11,601 visits/mo
0.1 miles
Kroger Fuel Center
Shops & Services
8,289 visits/mo
0.2 miles
Burger King
Dining
7,927 visits/mo
0.1 miles
Demographics for 35811, AL
30,075
Population
12,314
Households
2.4
Avg Household Size
39
Median Age
35%
College-Educated
93%
High-School Grad
46.9 sq mi
ZIP Area
641
Density / Sq Mi
$92,361
Median Household Income
$45,038
Median Earnings
$1,048
Median Rent
$249,900
Median Home Value
Check the figures for this property
Cap Rate, Value Estimation, Potential NOI and more
View Realmo Analytics
Market
Vacancy Rate% for Retail in South region






Similar Off Market Nearby
- CVS — 930 Winchester Rd NE, Huntsville, AL 35811
- CVS Pharmacy — 930 Winchester Rd NE, Huntsville, AL 35811
- Rocket City Nutrition — 920 Winchester Rd NE, Huntsville, AL 35811
- Deborah Zwiener — 930 Winchester Rd NE, Huntsville, AL 358111047
- Kroger Pharmacy — 6070 Moores Mill Rd, Huntsville, AL 35811
Frequently Asked Questions
What type of property is this?
Drug store - Freestanding pharmacy asset within a fully leased Alabama portfolio backed by a corporate guaranty from CVS Health Corporation.
Where is this drug store located?
The property is located at 930 Winchester Rd NE Huntsville, AL.
What is the asking price?
The asking price for this property is $2,193,407.
What are key features of this property?
This property features: 10,125‑square‑foot CVS Pharmacy at 930 Winchester Rd NE, Huntsville, AL 35811; Six‑property Alabama portfolio with assets in Dothan, Montgomery, Vestavia Hills, Hueytown, Huntsville, and Madison; 100 percent leased to Alabama CVS Pharmacy, LLC with a corporate guaranty from CVS Health Corporation


