20-Unit Apartment Building with Renovated
For Sale
Contact for pricing
93-95 India Street, Brooklyn, NY 11222
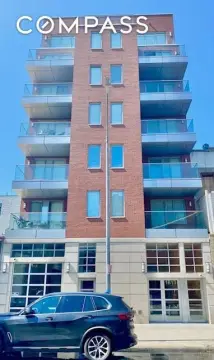
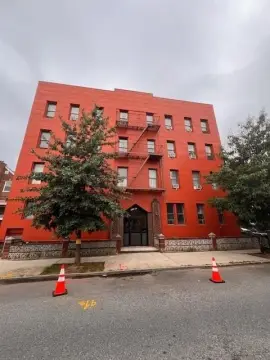
Well-improved 20-unit building with multiple duplex and roof-deck layouts and 12 fully gut-renovated apartments.
Property Size17,600 SF
Price / SF$380.68
Days on Market113
Property Features for 93-95 India Street
General Information
Standard status
Active
Size
17,600 SF
Property subtype
Multifamily
Zoning
R6B
Net Operating Income
$404,325
Additional Details
Multifamily Units
20
Building Details
Units
20
Tenancy
Multi
Listing Agency:
IPRG Investment Property Realty Group
Listed By:
Derek Bestreich · License #10991237362
Source:
Crexi
Added: Jun 16
Changed: Oct 6
Last Checked: Oct 5 at 3:54PM
Displayed information is deemed reliable but is not guaranteed and should be independently verified. All listing content including descriptions, pricing, images are the copyrighted material of IPRG Investment Property Realty Group
Investment Insights
Based on property information with market context.
93–95 India Street is a 20-unit apartment building measuring approximately 50 ft. by 88 ft. on a 50 ft. by 100 ft. lot. The property has undergone significant capital improvements, including upgrades to common areas and the full gut renovation of 12 of the 20 apartments. Several homes offer distinctive layouts and outdoor space, including two ground-floor duplex apartments, a ground-floor unit with exclusive backyard access via a private internal door and deck, and three top-floor units with internal stair bulkheads leading to private, fenced roof decks.
The building is positioned in the heart of Greenpoint, located between Franklin Street and Manhattan Avenue. This mid-sized multifamily property is presented as an income-focused asset with a material portion already operating on free-market rents, reaching 60% free market by unit count and 85% free market by revenue.
For buyers seeking a largely repositioned apartment building with continued leasing flexibility, the mix of renovated interiors and varied unit designs can support tenant appeal across different household needs. The offering also notes a predictable expense profile, with real estate taxes fully allocated at approximately 29% of gross revenue, which may help streamline operating budgeting. Remaining non-renovated units provide additional scope for an operator’s ongoing property management and unit-by-unit approach.
The building is positioned in the heart of Greenpoint, located between Franklin Street and Manhattan Avenue. This mid-sized multifamily property is presented as an income-focused asset with a material portion already operating on free-market rents, reaching 60% free market by unit count and 85% free market by revenue.
For buyers seeking a largely repositioned apartment building with continued leasing flexibility, the mix of renovated interiors and varied unit designs can support tenant appeal across different household needs. The offering also notes a predictable expense profile, with real estate taxes fully allocated at approximately 29% of gross revenue, which may help streamline operating budgeting. Remaining non-renovated units provide additional scope for an operator’s ongoing property management and unit-by-unit approach.
Key Highlights
- 20‑unit apartment building located in Greenpoint between Franklin Street and Manhattan Avenue
- Building size 50 ft. x 88 ft. on a 50 ft. x 100 ft. lot
- Common areas plus 12 of 20 apartments fully gut renovated
Financial Insights
Estimated NOI and Cap Rate
NOI / Yr
$537,310
Cap Rate
8.02%
Suggested Prices Based on Cap Rates
Cap Rate 5%
$10,746,200
$10.7M
Cap Rate 7%
$7,675,857
$7.7M
Cap Rate 9%
$5,970,111
$6.0M
Market Conditions
NOI Build-Up for 17,600 SF
Gross rent
$996.9K $56.64/SF
− Vacancy
−$19.9K −$1.13/SF
EGI
$976.9K $55.51/SF
− OpEx
−$439.6K −$24.98/SF
NOI
$537.3K $30.53/SF
Area
Brooklyn, NY
Vacancy
2.00%
Lease Rate
$56.64 /SF/Yr
Expense Ratio
45.00%
Simulate Cap Rate and NOI
Suggested Prices Based on Cap Rates
Cap Rate 5%
$10,746,200
Cap Rate 7%
$7,675,857
Cap Rate 9%
$5,970,111
Alternative Uses
Best Use
Apartment 5plus
$7.68M
$6.72M – $8.96M
NOI $537,310 @ 7.0% cap · market cap 8.02%
Second Best
—
—
no second resolved use
Theoretical Best
Specialty Retail
$14.57M
$12.75M – $17.00M
NOI $1,020,096 @ 7.0% cap · market cap 15.23%
Zoning and permitted uses should be independently verified with authorities.
Property Analytics
Unlock full access to Insights
Subscribe to Realmo Intelligence
Open Analytics
Current Use
Lease Details
20
Residential units
Location Intelligence
Trade Area within ½ mile
4,550
Businesses Nearby
Explore this area
Business Placement
Demographics for 11222, NY
41,957
Population
21,917
Households
1.9
Avg Household Size
35
Median Age
65%
College-Educated
94%
High-School Grad
1.5 sq mi
ZIP Area
27,971
Density / Sq Mi
$123,963
Median Household Income
$74,237
Median Earnings
$2,595
Median Rent
$1,245,600
Median Home Value
Check the figures for this property
Cap Rate, Value Estimation, Potential NOI and more
View Realmo Analytics
Market
Vacancy Rate% for Multifamily in Northeast region

Questions? Ask Rey
Realmo’s AI knows this listing — price, zoning, demand, history. Ask anything.





Frequently Asked Questions
What type of property is this?
Apartment building - Well-improved 20-unit building with multiple duplex and roof-deck layouts and 12 fully gut-renovated apartments.
Where is this apartment building located?
The property is located at 93-95 India Street Brooklyn, NY.
What is the asking price?
The asking price for this property is $6,700,000.
What are key features of this property?
This property features: 20‑unit apartment building located in Greenpoint between Franklin Street and Manhattan Avenue; Building size 50 ft. x 88 ft. on a 50 ft. x 100 ft. lot; Common areas plus 12 of 20 apartments fully gut renovated


