Professional Office with Two
For Sale
$499,900
929 Lacey Road, Forked River, NJ 08731
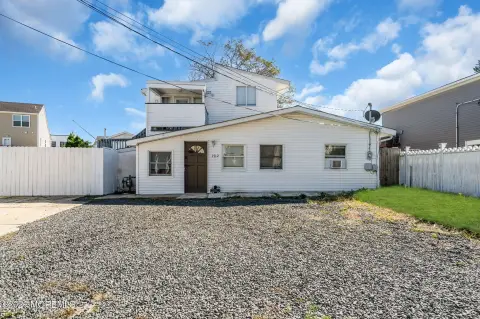
Well-appointed upper floor office space with a separate lower level office and ample on-site parking.
Property Size2,144 SF
Price / SF$233.16
Days on Market151
Property Features for 929 Lacey Road
General Information
Standard status
Active
Size
2,144 SF
Property subtype
Commercial
Building Details
Year Built
1965
Listing Agency:
RE/MAX at Barnegat Bay
Listed By:
Alan Seeland · License #9591828
(732) 801-3024
Source:
Actionplusrealty
Added: May 25
Changed: Oct 21
Last Checked: Oct 21 at 12:11AM
Displayed information is deemed reliable but is not guaranteed and should be independently verified. All listing content including descriptions, pricing, images are the copyrighted material of RE/MAX at Barnegat Bay

Ask AI about this property
Review the available facts, identify missing information and prepare questions for the agent.
Investment Insights
Based on property information with market context.
This well-appointed office property includes an upper floor professional office space and a separate lower level office that can be rented independently or used by a single occupant. The property is currently occupied as a professional financial services office.
The building is located about 3/10 of a mile from Garden State Parkway access on busy Lacey Road. An entrance from a side street supports convenient access, and the property provides ample on-site parking with a highly visible signage location.
The configuration offers two distinct office levels, which can support a variety of occupancy approaches while maintaining straightforward day-to-day access for staff and visitors.
The building is located about 3/10 of a mile from Garden State Parkway access on busy Lacey Road. An entrance from a side street supports convenient access, and the property provides ample on-site parking with a highly visible signage location.
The configuration offers two distinct office levels, which can support a variety of occupancy approaches while maintaining straightforward day-to-day access for staff and visitors.
Key Highlights
- Year built: 1965
- Well‑appointed upper floor professional office space
- Separate lower level office can be rented or used by a single occupant
Financial Insights
Estimated NOI and Cap Rate
NOI / Yr
$32,803
Cap Rate
6.56%
Suggested Prices Based on Cap Rates
Cap Rate 5%
$656,060
$656.1K
Cap Rate 7%
$468,614
$468.6K
Cap Rate 9%
$364,478
$364.5K
Market Conditions
NOI Build-Up for 2,144 SF
Gross rent
$64.3K $30.00/SF
− Vacancy
−$20.6K −$9.60/SF
EGI
$43.7K $20.40/SF
− OpEx
−$10.9K −$5.10/SF
NOI
$32.8K $15.30/SF
Area
Ocean County, NJ
Vacancy
32.00%
Lease Rate
$30.00 /SF/Yr
Expense Ratio
25.00%
Simulate Cap Rate and NOI
Suggested Prices Based on Cap Rates
Cap Rate 5%
$656,060
Cap Rate 7%
$468,614
Cap Rate 9%
$364,478
Alternative Uses
Best Use
Office B
$468.6K
$410.0K – $546.7K
NOI $32,803 @ 7.0% cap · market cap 6.56%
Second Best
—
—
no second resolved use
Theoretical Best
Office A
$559.8K
$489.9K – $653.2K
NOI $39,189 @ 7.0% cap · market cap 7.84%
Zoning and permitted uses should be independently verified with authorities.
How Realmo checks its estimates
Property Analytics
Current Use
Location Intelligence
Trade Area within ½ mile
Explore this area
Business Placement
Demographics for 08731, NJ
20,953
Population
9,663
Households
2.2
Avg Household Size
45
Median Age
32%
College-Educated
94%
High-School Grad
78.1 sq mi
ZIP Area
268
Density / Sq Mi
$93,267
Median Household Income
$45,345
Median Earnings
$2,080
Median Rent
$360,000
Median Home Value
Market
Vacancy Rate% for Office in Northeast region


Frequently Asked Questions
What type of property is this?
Office unit - Well-appointed upper floor office space with a separate lower level office and ample on-site parking.
Where is this office unit located?
The property is located at 929 Lacey Road Forked River, NJ.
What is the asking price?
The asking price for this property is $499,900.
What are key features of this property?
This property features: Year built: 1965; Well‑appointed upper floor professional office space; Separate lower level office can be rented or used by a single occupant


