Four-Unit Building in Carver
For Sale
$995,000
928 19th Street Northeast, Washington, DC 20002
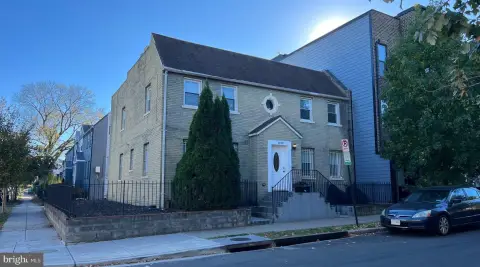
Fully occupied four-unit building with redevelopment potential in Carver Langston.
Property Size2,508 SF
Lot Size0.09 Acres
Price / SF$396.73
Days on Market177

Ask AI about this property
Review the available facts, identify missing information and prepare questions for the agent.
Property Features for 928 19th Street Northeast
General Information
Standard status
Active
Size
2,508 SF
Total Parking Spaces
1
Lot size
0.09 Acres
Property subtype
Multi-Family / Fee Simple
Zoning
R5B
Taxes and HOA fees
Annual Taxes
$7,424
Amenities
No
Washer/Dryer Stacked
Wood Floors, Kitchen - Efficiency, Floor Plan - Traditional, Combination Dining/Living
No Pool
Building Details
Year Built
1942
Listing Agency:
Compass
Listed By:
Jennifer Smira · License #SP600505
(202) 340-7675
Source:
Compass
Added: Apr 22
Changed: Oct 15
Last Checked: Oct 15 at 1:09AM
Displayed information is deemed reliable but is not guaranteed and should be independently verified. All listing content including descriptions, pricing, images are the copyrighted material of Compass
Investment Insights
Based on property information with market context.
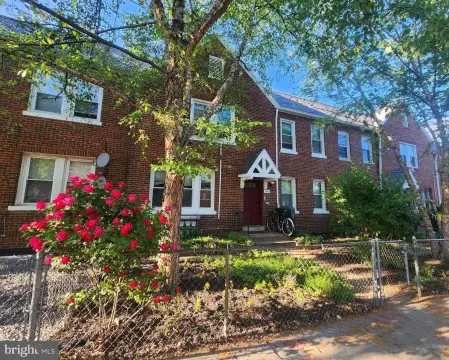
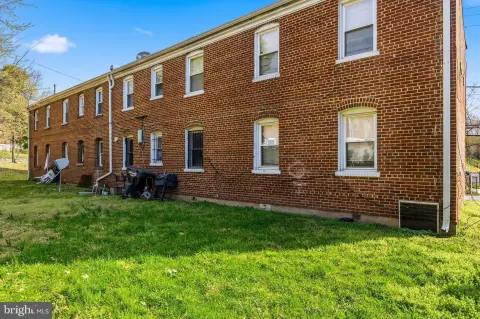
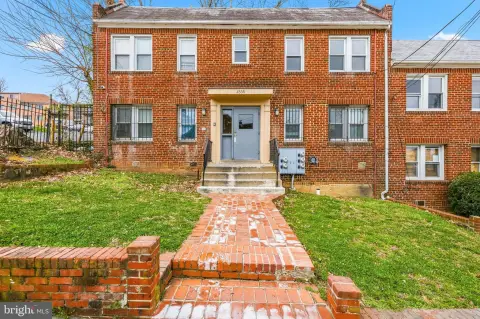
This fully occupied four-unit building is located on a corner lot in Carver Langston. Each of the four residences features a one-bedroom, one-bath layout. The property has been well maintained, with updated interiors and functional layouts. Residents have access to updated kitchens and baths, comfortable living spaces, and rear parking. The 3,965 square foot lot is zoned RA-2, offering potential for redevelopment into a 7,000+ square foot boutique condominium or multifamily project. The property is near Ivy City, the H Street Corridor, and Union Market, and benefits from proximity to the planned transformation of the RFK Stadium campus. It has convenient access to NoMa, Metro, and major commuter routes. The location has a bike score of 97, a walk score of 78, and a transit score of 72.
Key Highlights
- Stabilized, income‑producing four‑unit building in a rapidly evolving D.C. neighborhood (Carver Langston).
- Significant redevelopment potential with RA‑2 zoning and a 3,965 sq ft lot, allowing for a 7,000+ sq ft project.
- Fully occupied with well‑maintained one‑bedroom, one‑bath units, providing immediate cash flow.
Financial Insights
Estimated NOI and Cap Rate
NOI / Yr
$47,780
Cap Rate
4.80%
Suggested Prices Based on Cap Rates
Cap Rate 5%
$955,600
$955.6K
Cap Rate 7%
$682,571
$682.6K
Cap Rate 9%
$530,889
$530.9K
Market Conditions
NOI Build-Up for 2,508 SF
Gross rent
$72.2K $28.80/SF
− Vacancy
−$4.0K −$1.58/SF
EGI
$68.3K $27.22/SF
− OpEx
−$20.5K −$8.16/SF
NOI
$47.8K $19.05/SF
Area
ZIP 20002
Vacancy
5.50%
Lease Rate
$28.80 /SF/Yr
Expense Ratio
30.00%
Simulate Cap Rate and NOI
Suggested Prices Based on Cap Rates
Cap Rate 5%
$955,600
Cap Rate 7%
$682,571
Cap Rate 9%
$530,889
Alternative Uses
Best Use
Multifamily LT 5
$682.6K
$597.3K – $796.3K
NOI $47,780 @ 7.0% cap · market cap 4.80%
Second Best
Apartment 5plus
$610.0K
$533.7K – $711.6K
NOI $42,698 @ 7.0% cap · market cap 4.29%
Theoretical Best
Office A
$1.29M
$1.13M – $1.51M
NOI $90,642 @ 7.0% cap · market cap 9.11%
Zoning and permitted uses should be independently verified with authorities.
How Realmo checks its estimates
Property Analytics
Unlock full access to Insights
Subscribe to Realmo Intelligence
Open Analytics
Current Use
Location Intelligence
Trade Area within ½ mile
1,174
Businesses Nearby
Explore this area
Business Placement
Demographics for 20002, DC
69,422
Population
38,459
Households
1.8
Avg Household Size
33
Median Age
70%
College-Educated
95%
High-School Grad
5.1 sq mi
ZIP Area
13,612
Density / Sq Mi
$114,482
Median Household Income
$82,909
Median Earnings
$2,140
Median Rent
$813,700
Median Home Value
Check the figures for this property
Cap Rate, Value Estimation, Potential NOI and more
View Realmo Analytics
Market
Vacancy Rate% for Multifamily in South region





Frequently Asked Questions
What type of property is this?
Quadplex - Fully occupied four-unit building with redevelopment potential in Carver Langston.
Where is this quadplex located?
The property is located at 928 19th Street Northeast Washington, DC.
What is the asking price?
The asking price for this property is $995,000.
What are key features of this property?
This property features: Stabilized, income‑producing four‑unit building in a rapidly evolving D.C. neighborhood (Carver Langston).; Significant redevelopment potential with RA‑2 zoning and a 3,965 sq ft lot, allowing for a 7,000+ sq ft project.; Fully occupied with well‑maintained one‑bedroom, one‑bath units, providing immediate cash flow.


