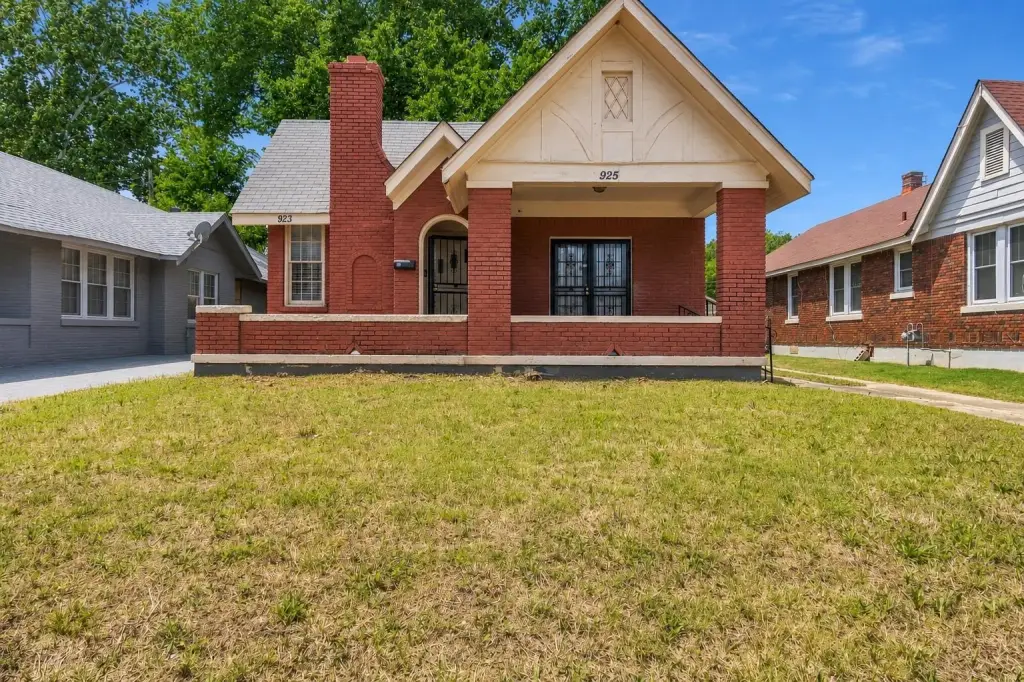
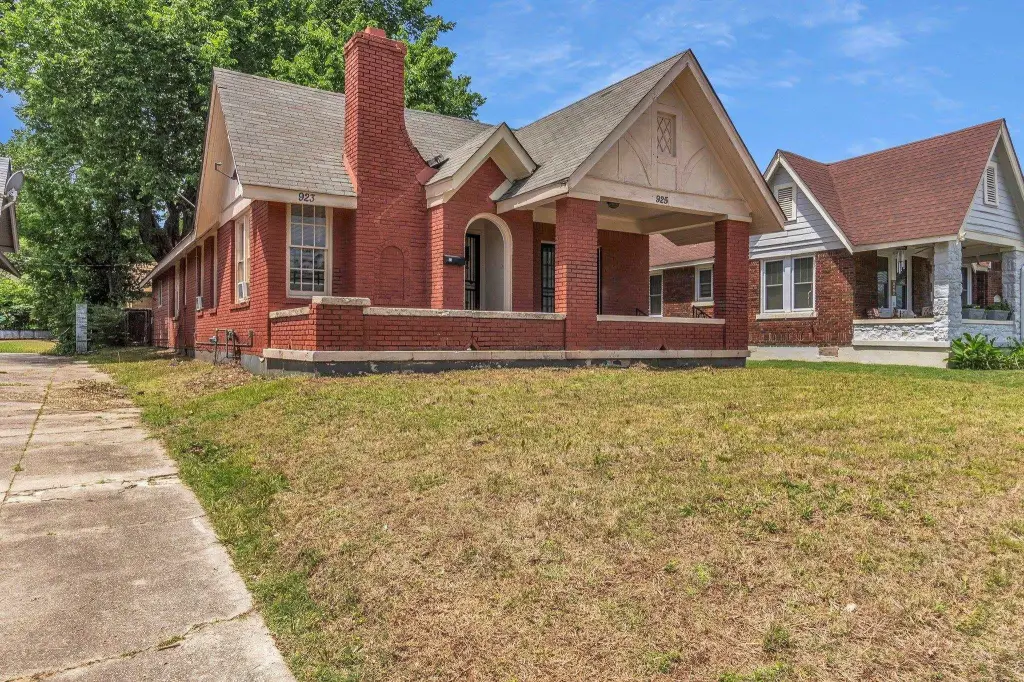
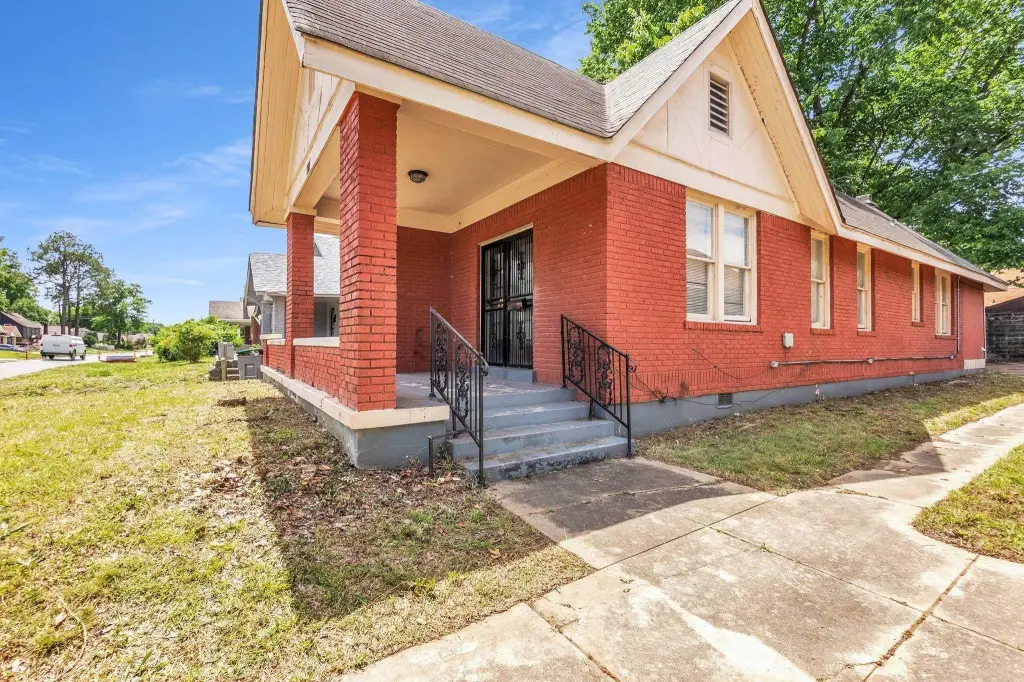
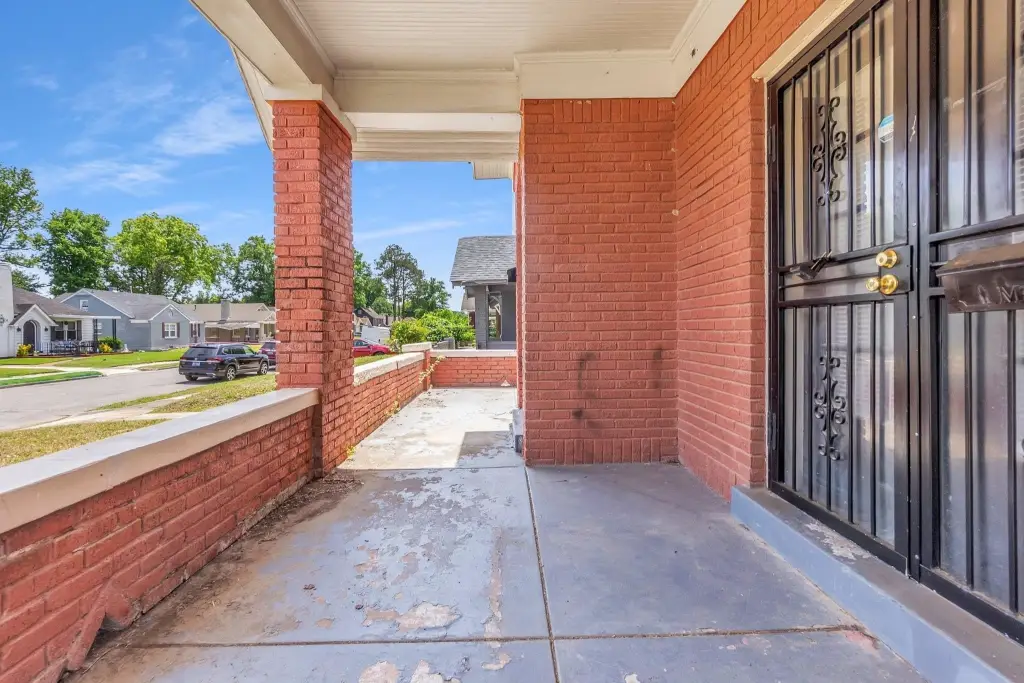
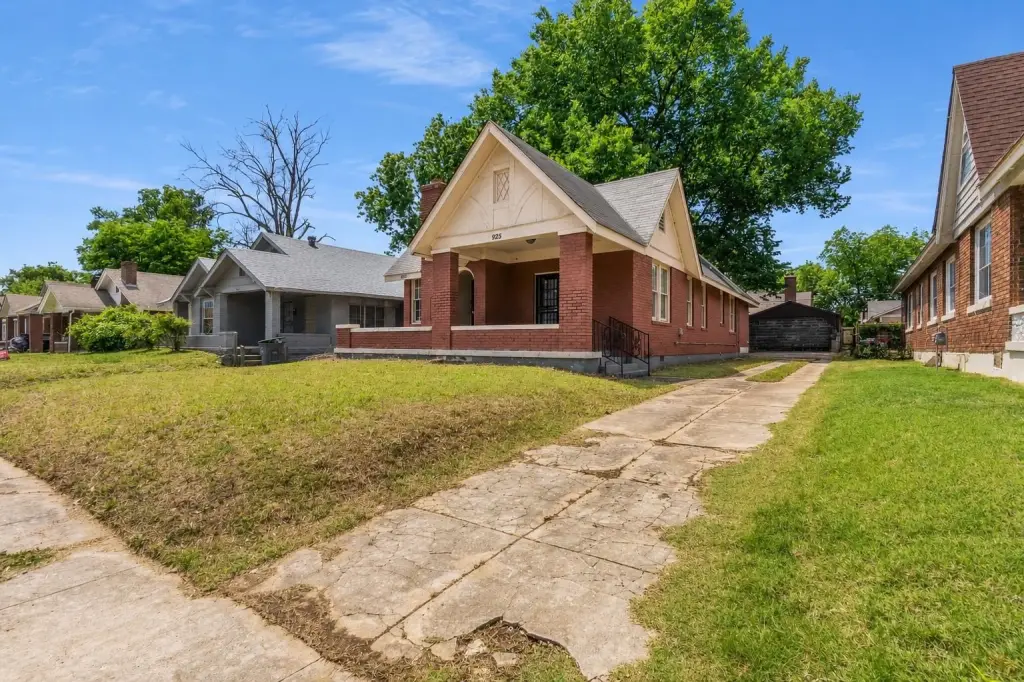
Two-Unit Duplex with Large
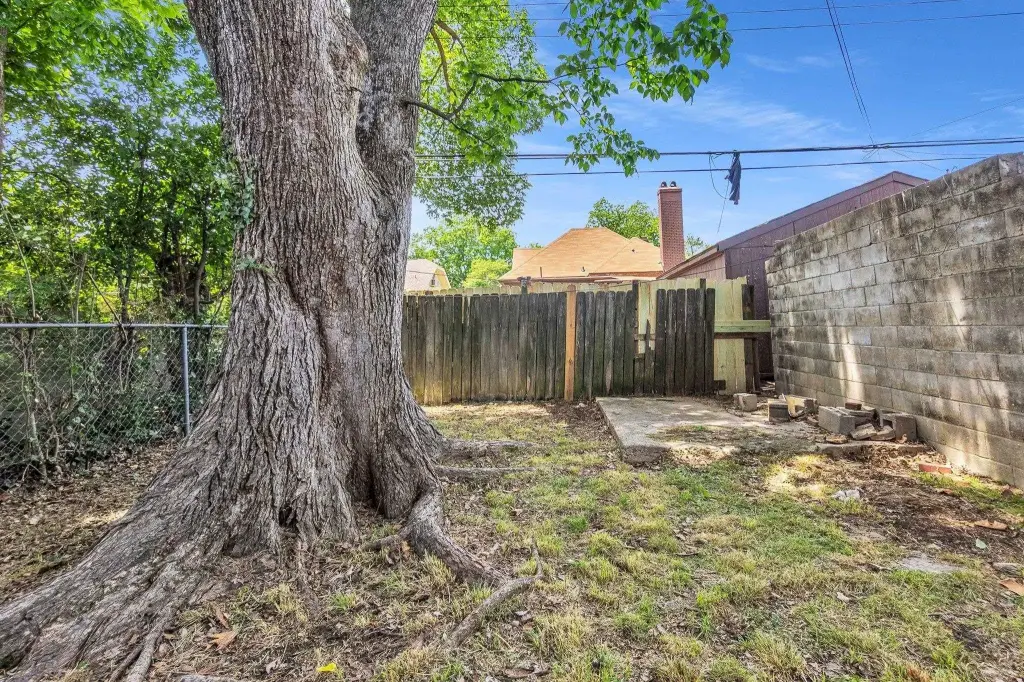
For Sale
$140,000
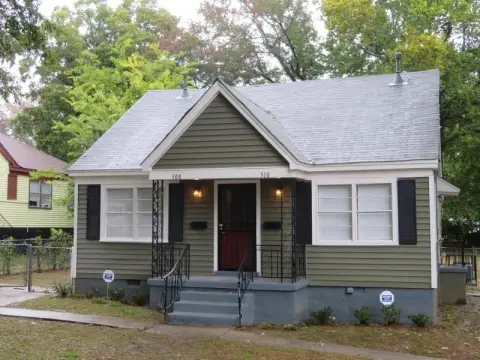
925 N WILLETT St, Memphis, TN 38107
Duplexes, Traditional, Memphis, TN
Property Size1,692 SF
Price / SF$82.74
Days on Market161
Property Features for 925 N WILLETT St
General Information
Property type
Residential Multi Family
Property subtype
Duplex
Bedrooms
2
Bathrooms
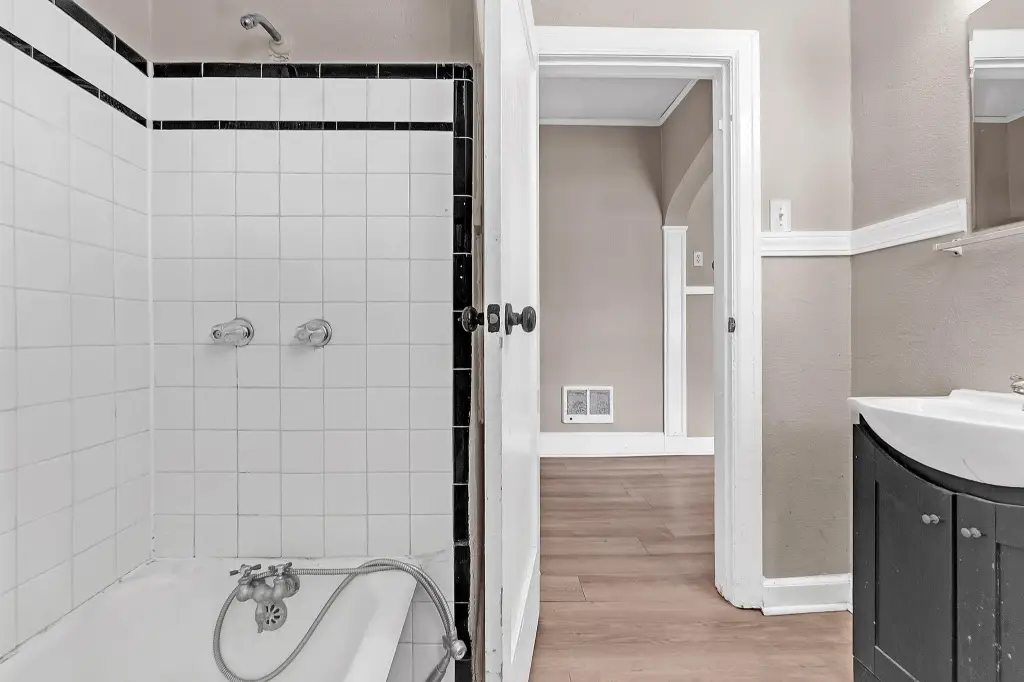
2
Full bathrooms
2
Rooms
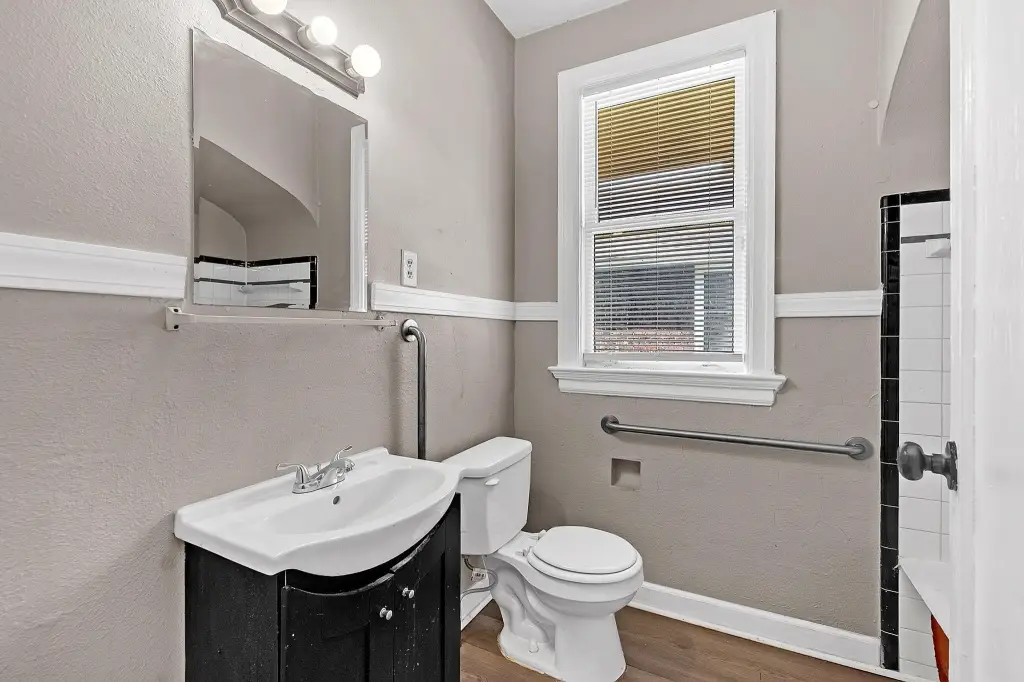
Bathroom 1, Bedroom 1, Bedroom 2, Bathroom 2
Subdivision
JACKSON
Standard status
Active
Size
1,692 SF
Taxes and HOA fees
Tax Annual Amount
1695
Amenities
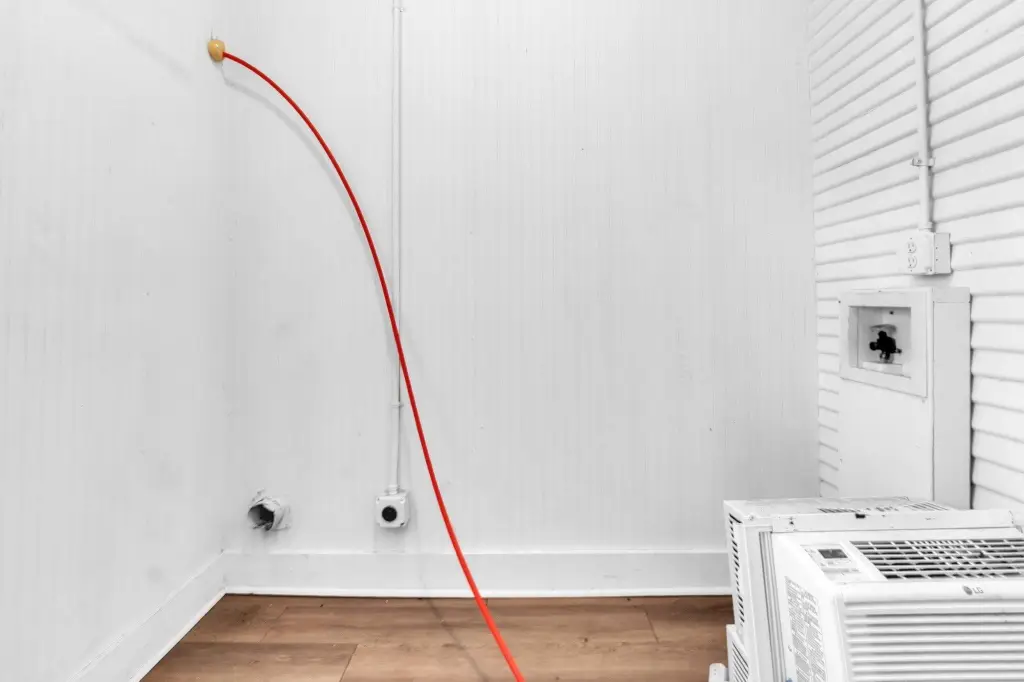
washer dryer hookups
Building Details
Year built
1930
Architectural style
Other
Listing Agency:
Fast Track Realty, LLC
(901) 767-8770
Listed By:
Verna Littleton
(901) 490-9449
Added: May 13
Changed: Oct 20
Last Checked: Oct 20 at 4:06PM
MLS# 10221462
Copyright © 2026 Memphis Area Association of Realtors®. All rights reserved. All information provided by the listing agent/broker is deemed reliable but is not guaranteed and should be independently verified.

Ask AI about this property
Review the available facts, identify missing information and prepare questions for the agent.
Investment Insights
Based on property information with market context.
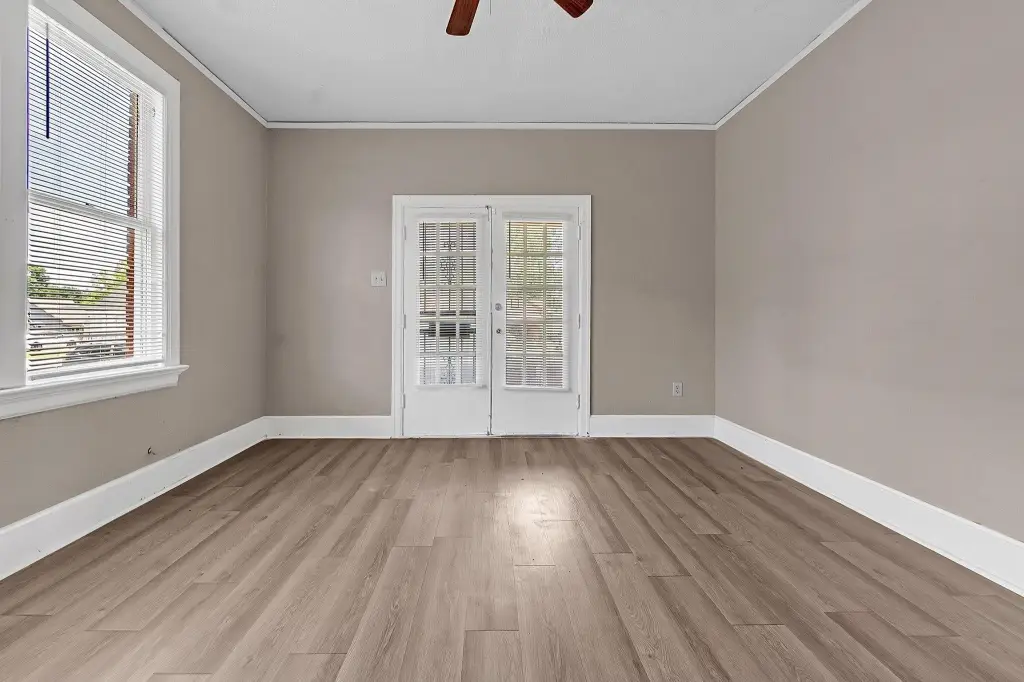
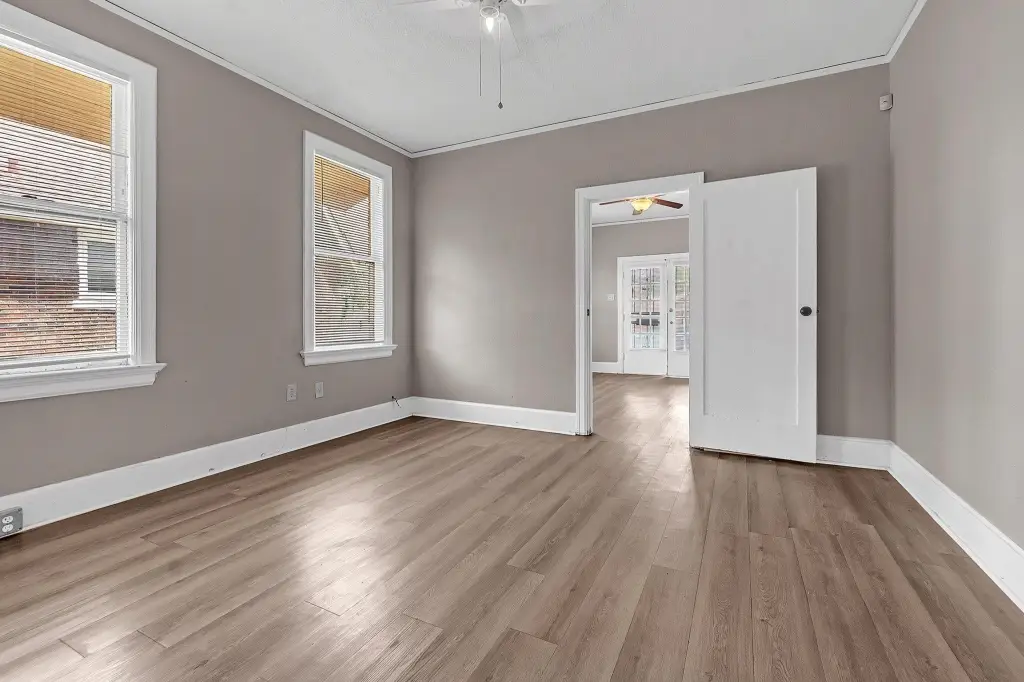
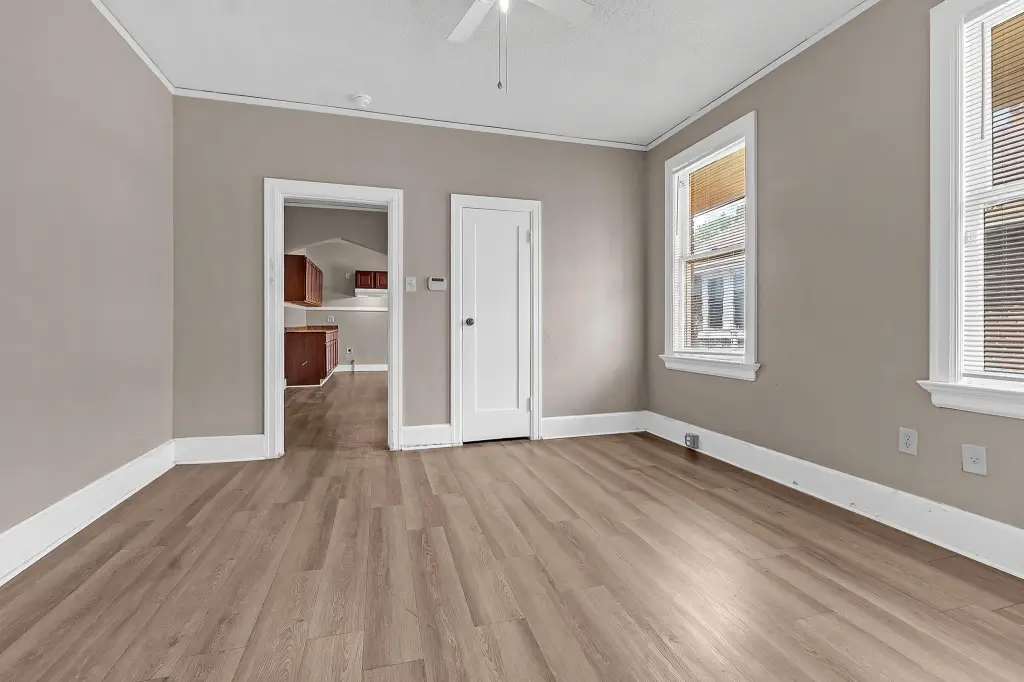
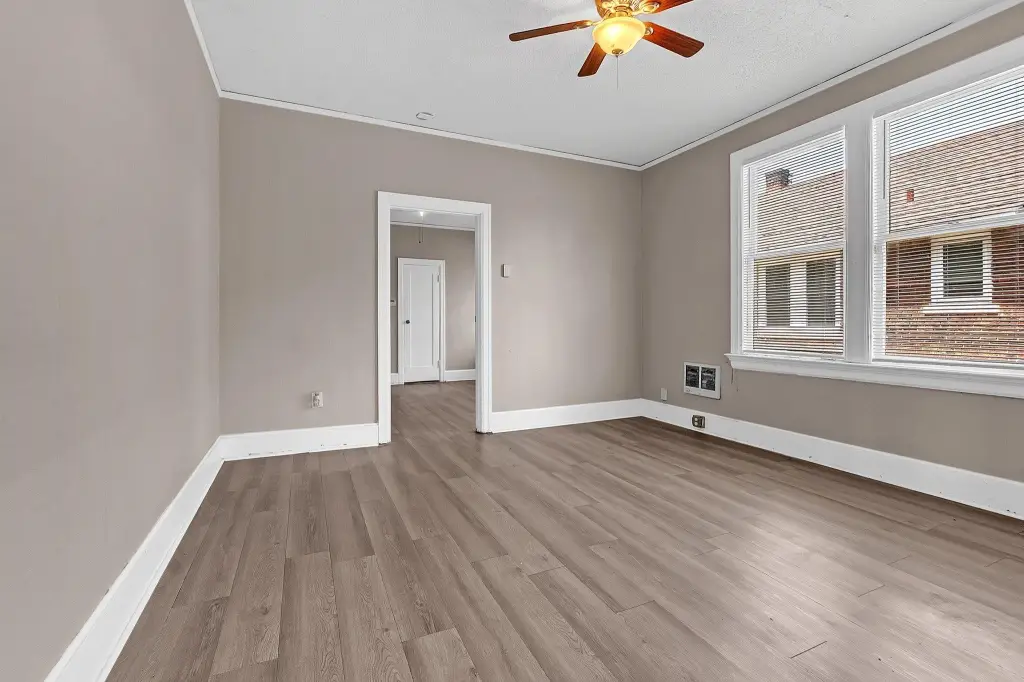
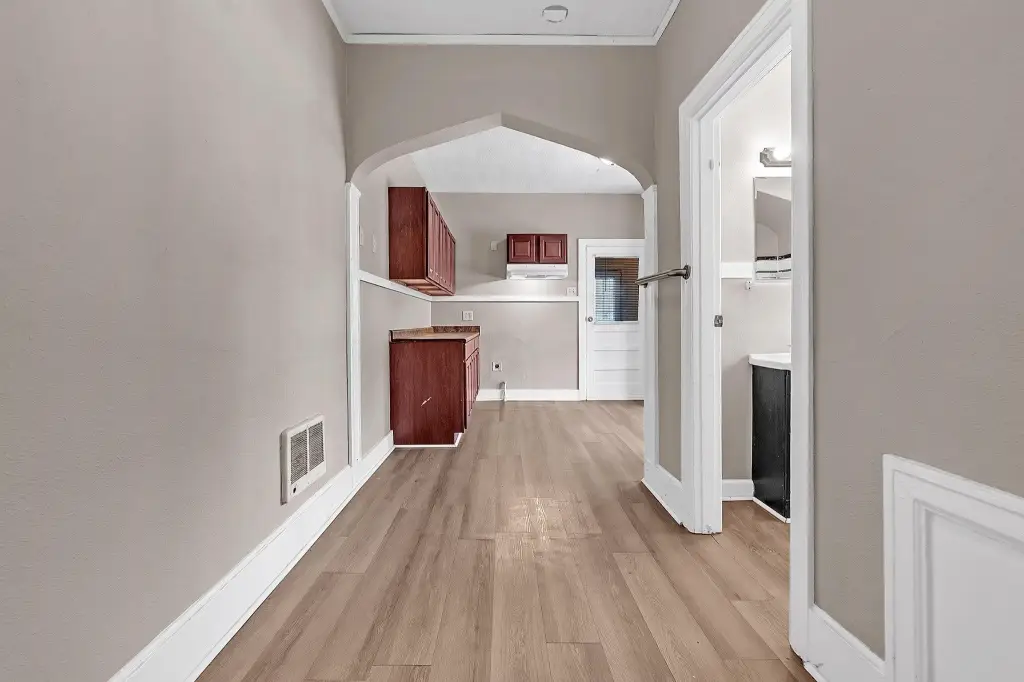
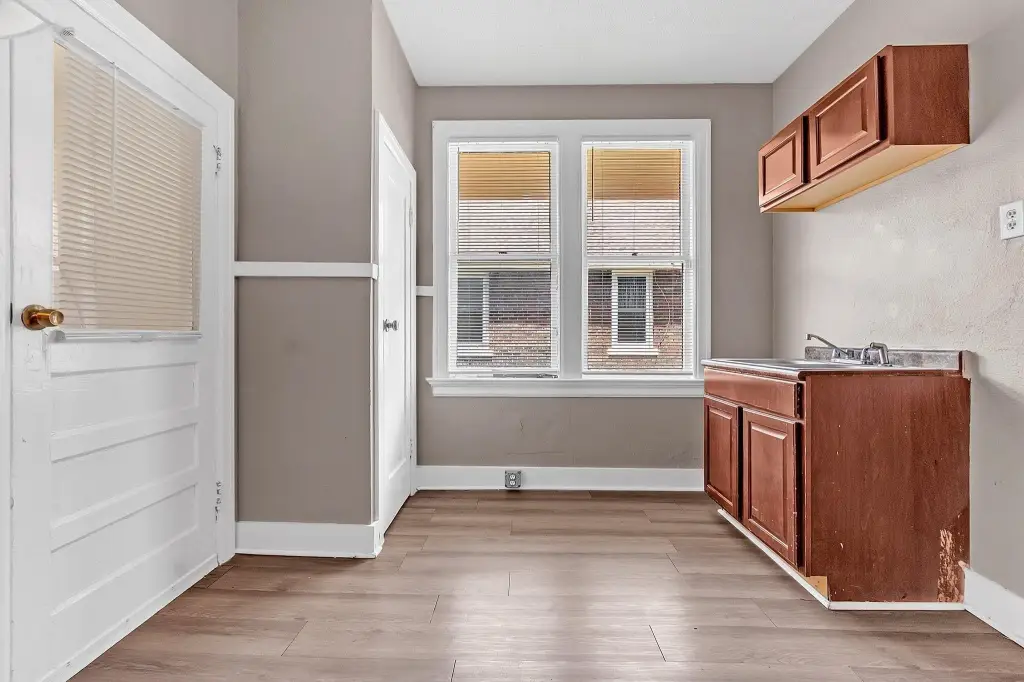
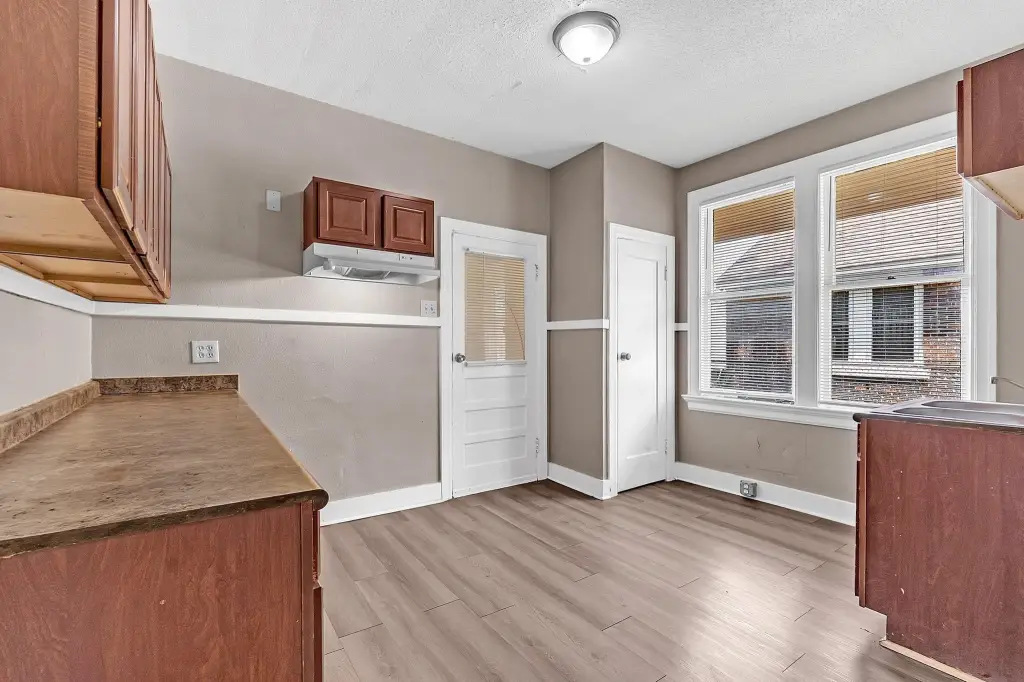
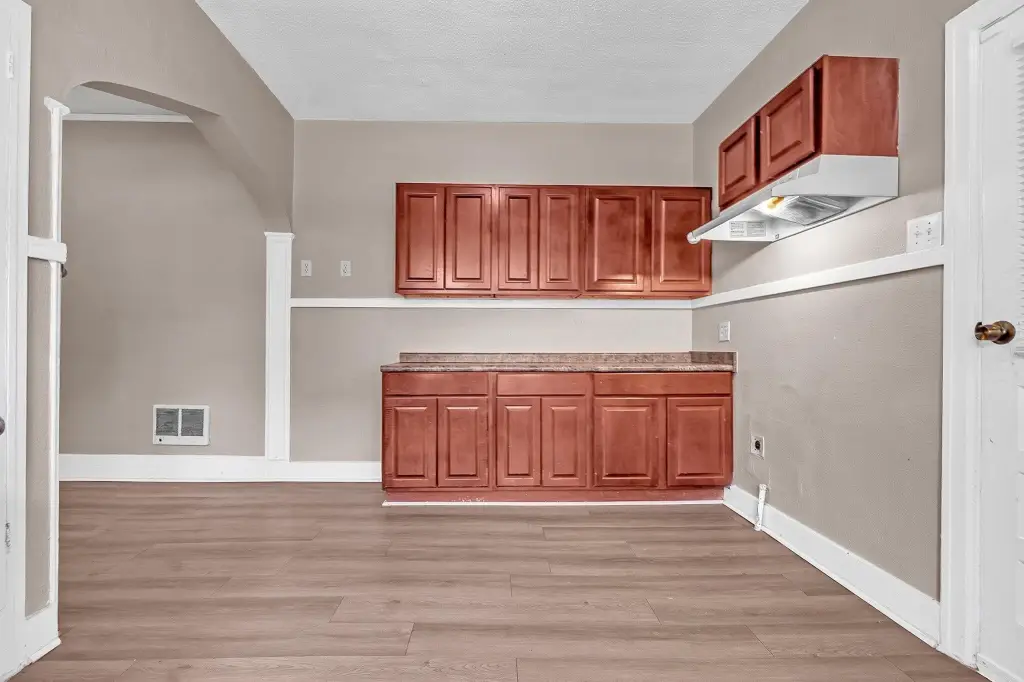
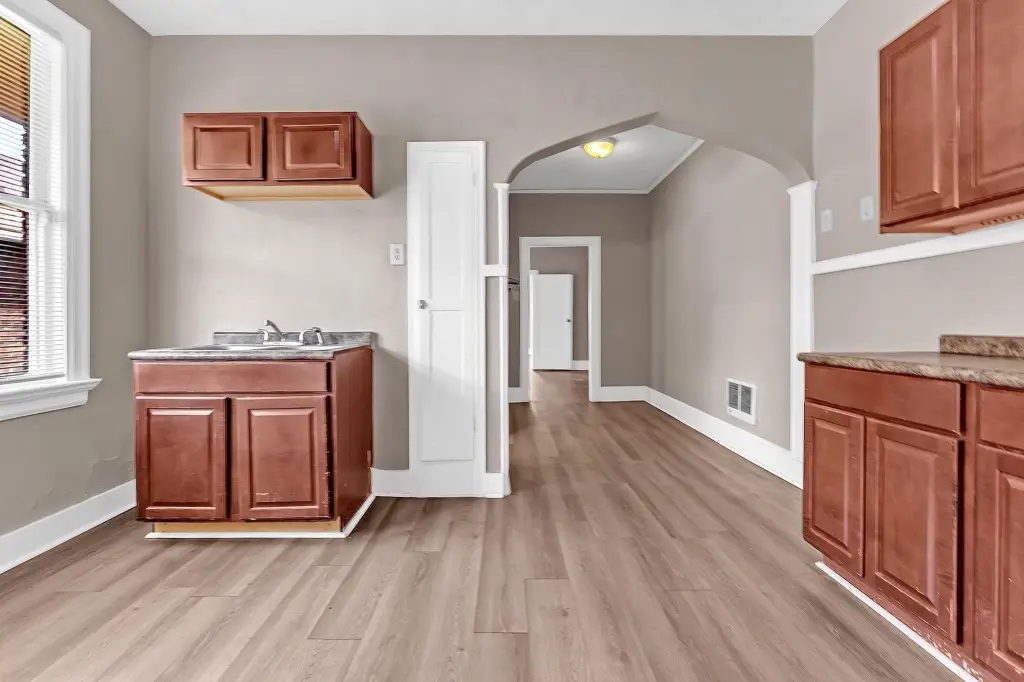
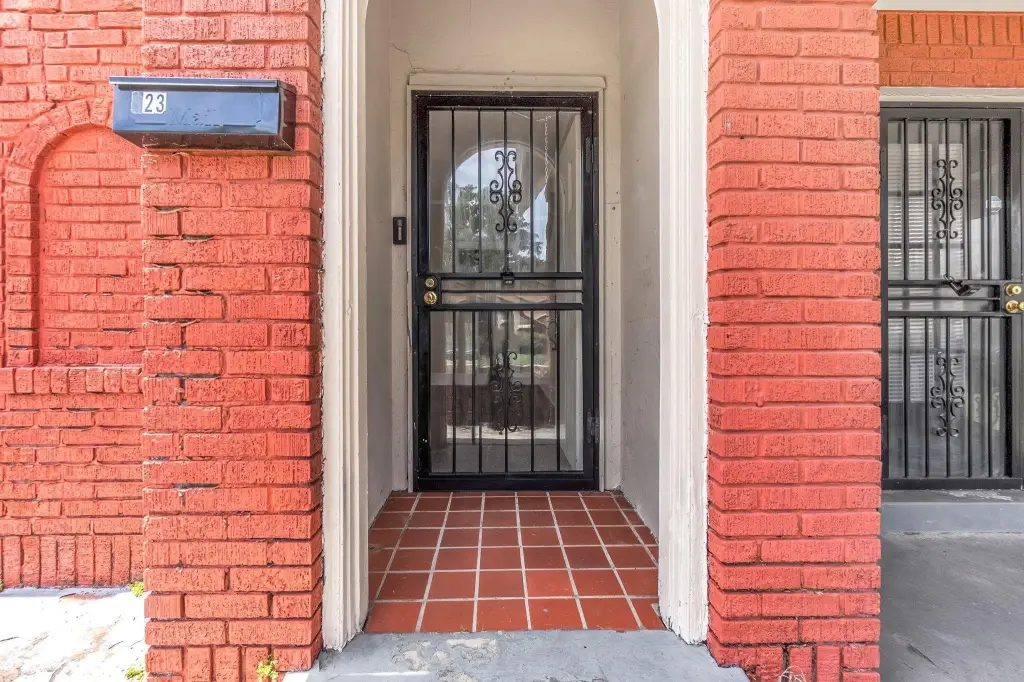
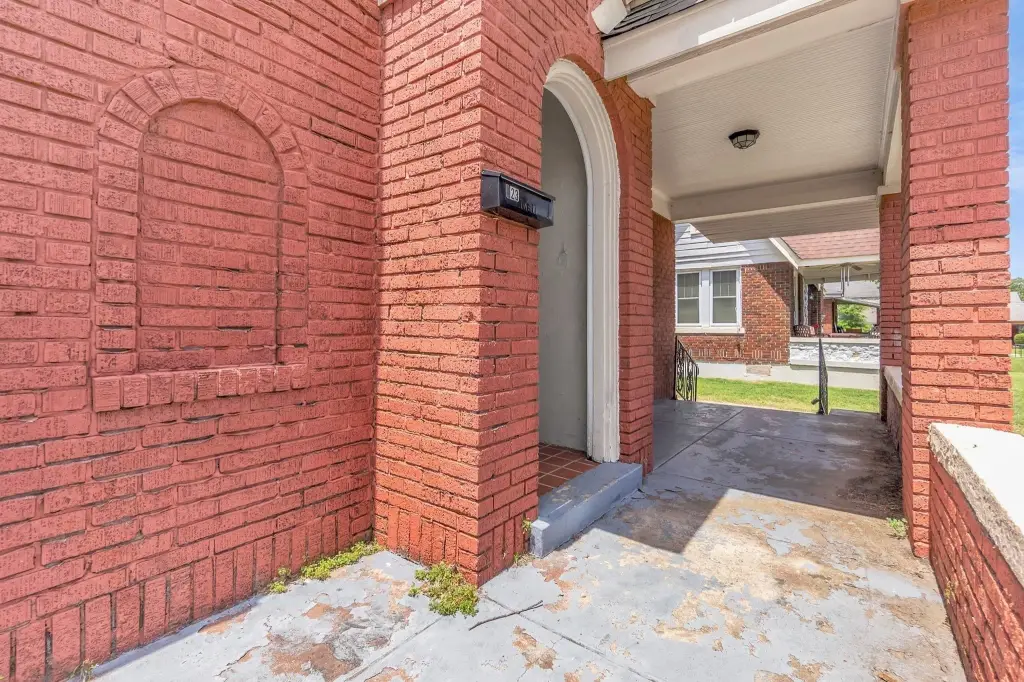
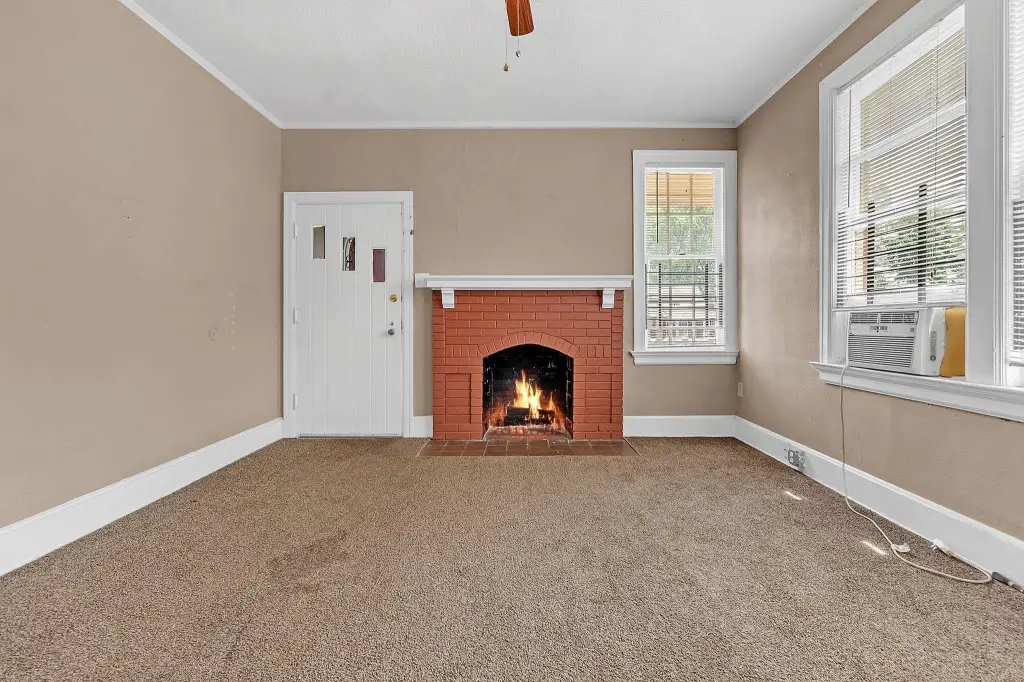
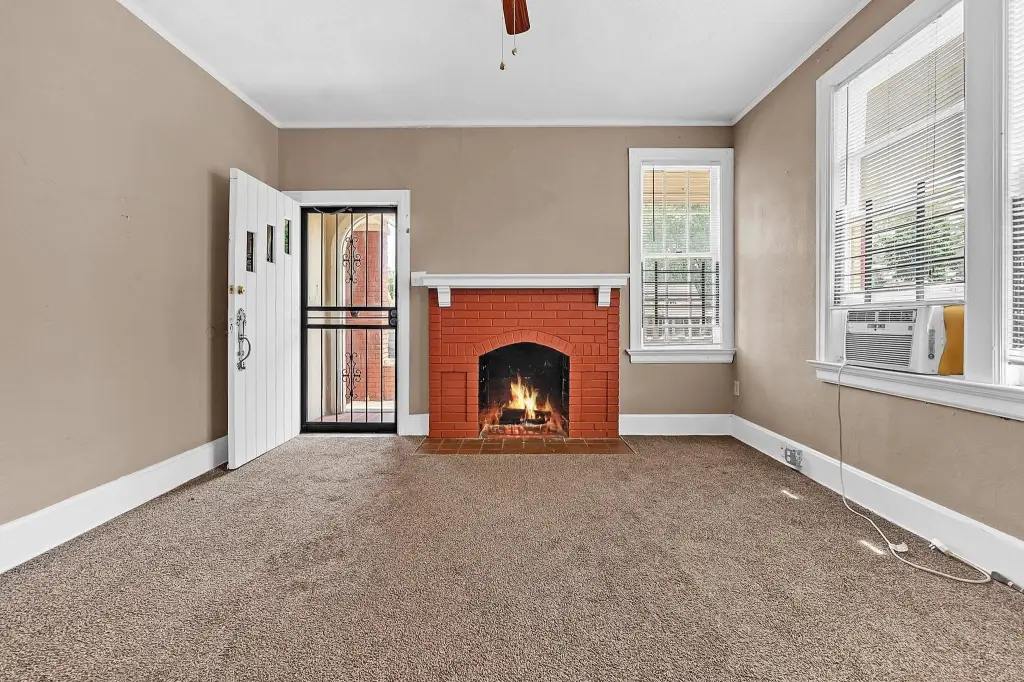
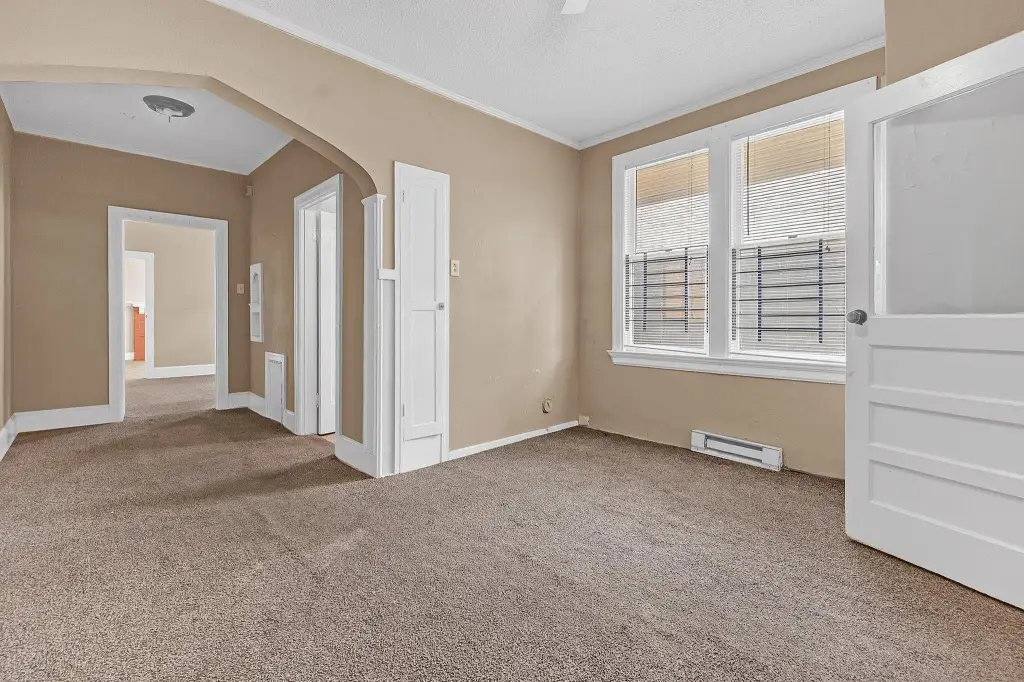
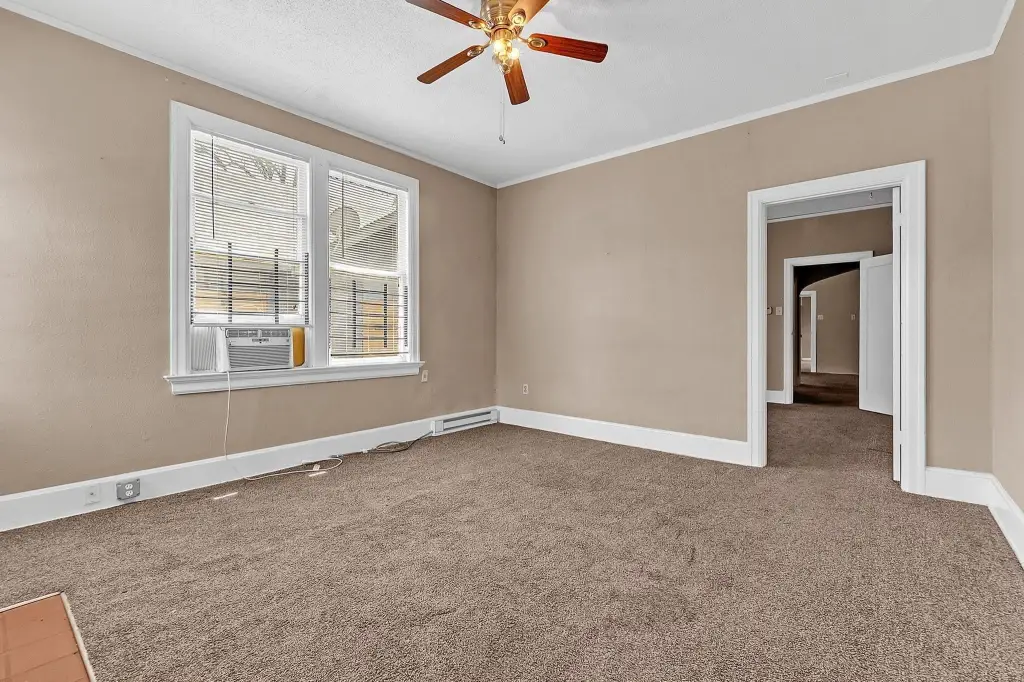
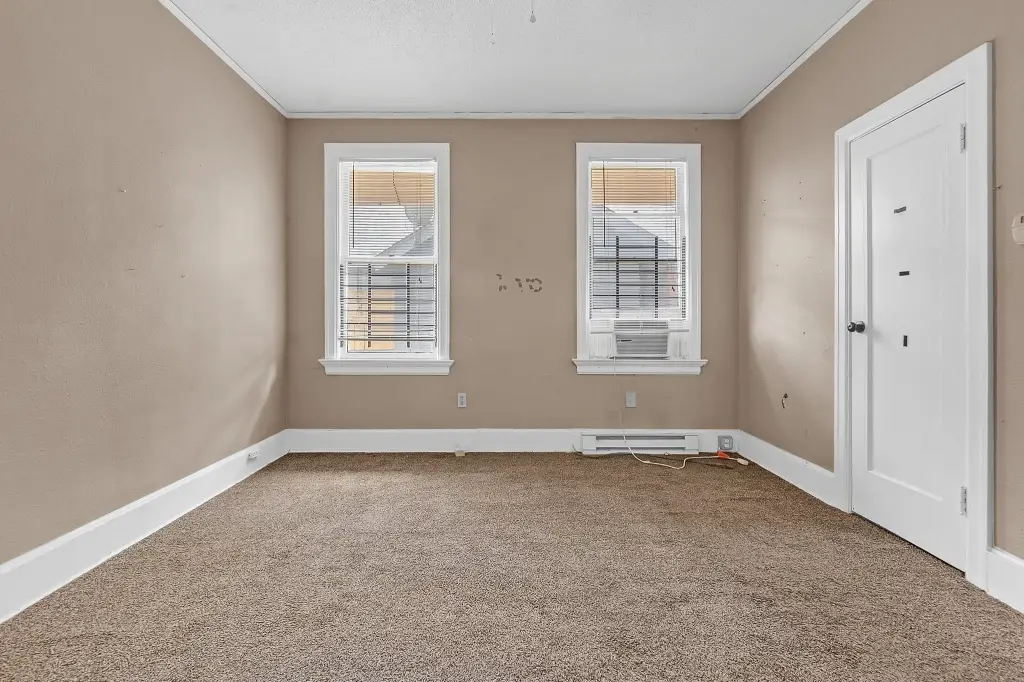
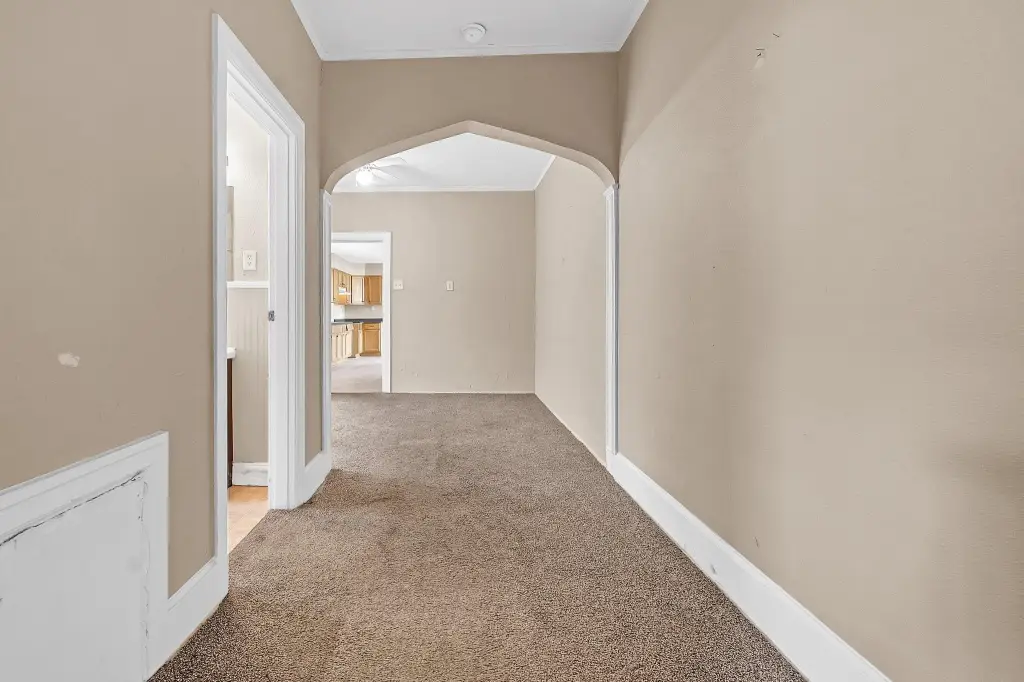
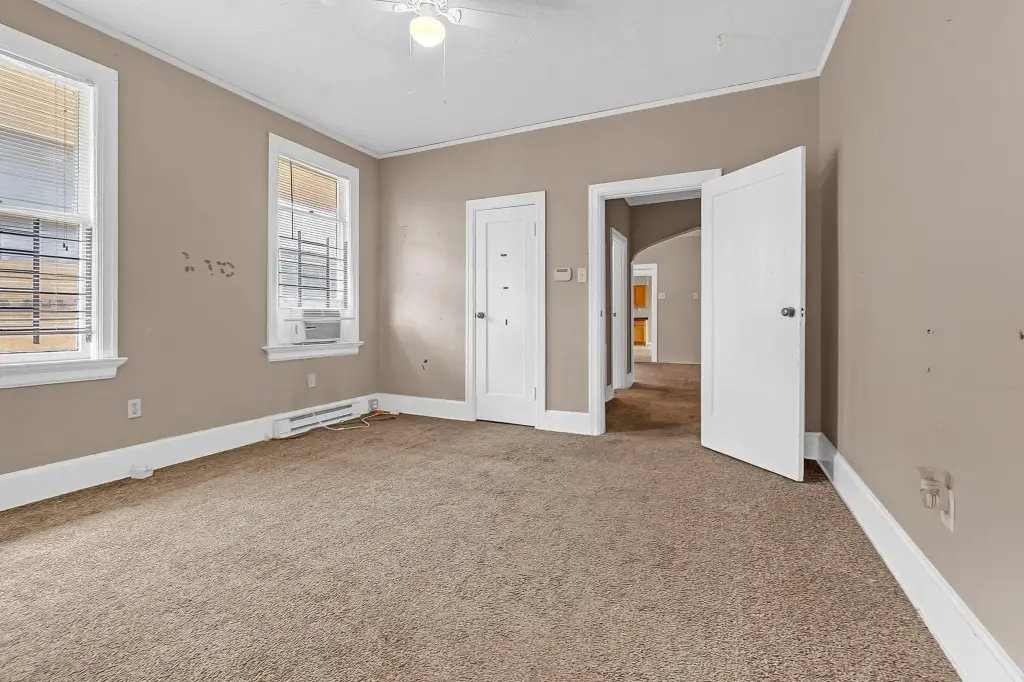
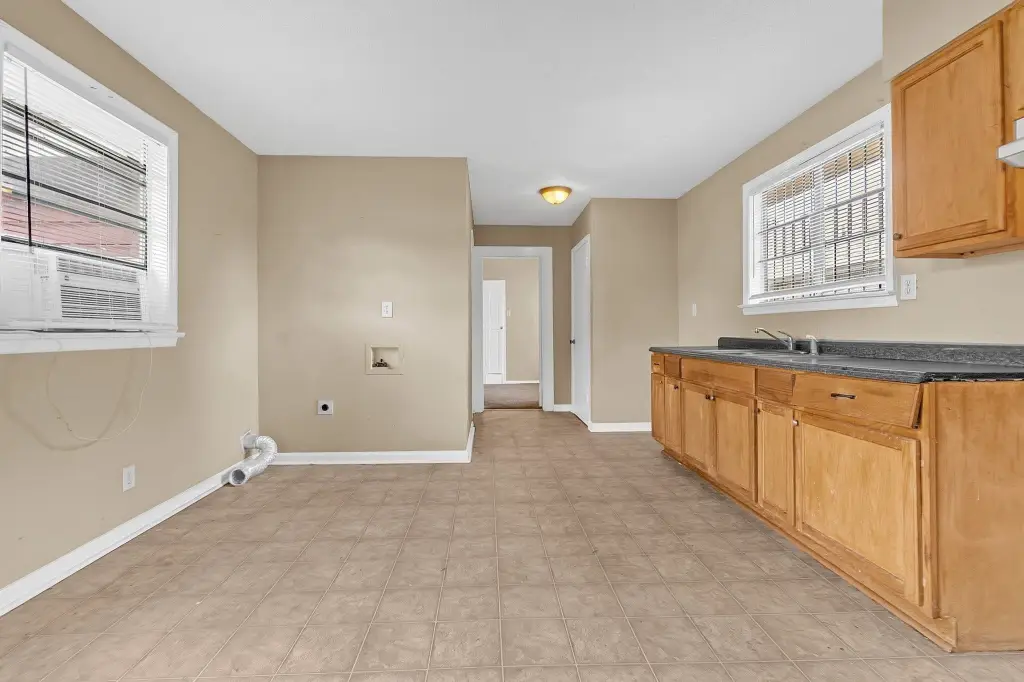
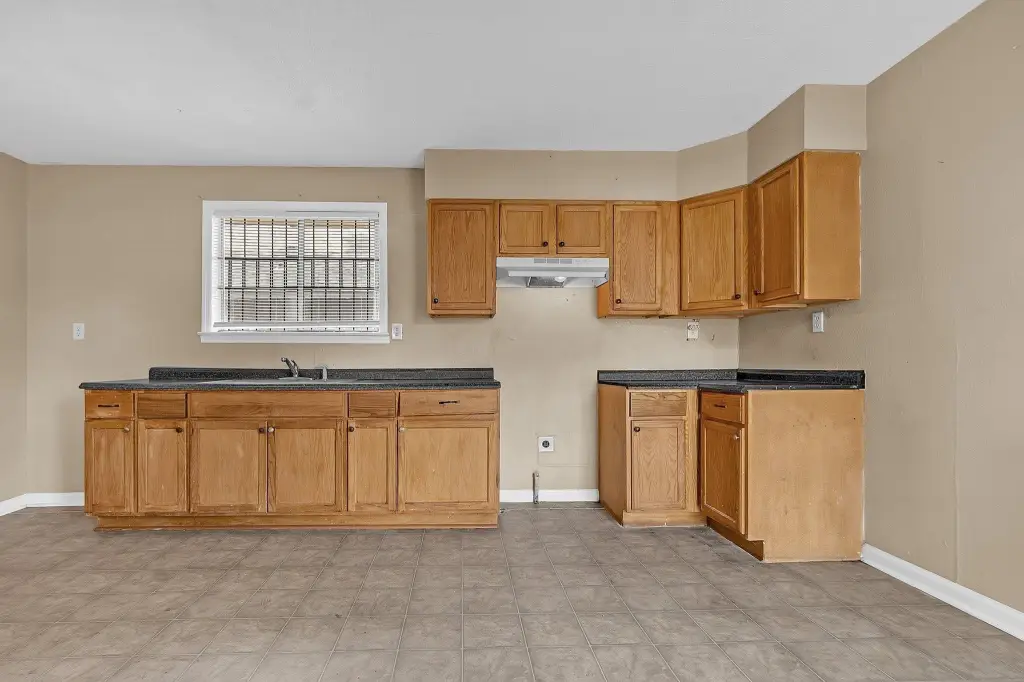
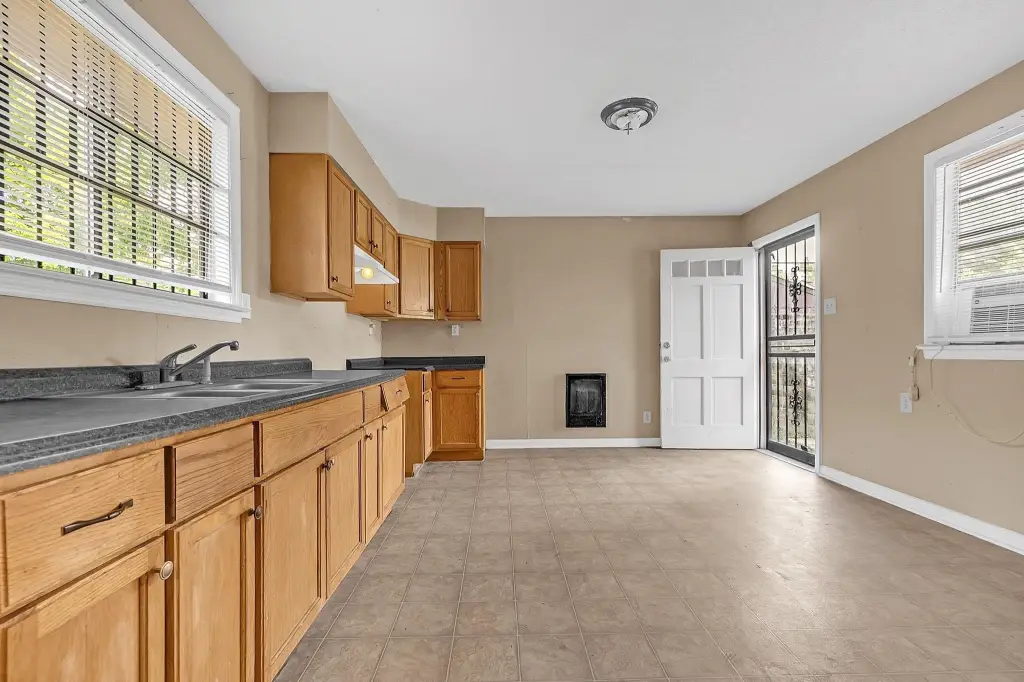
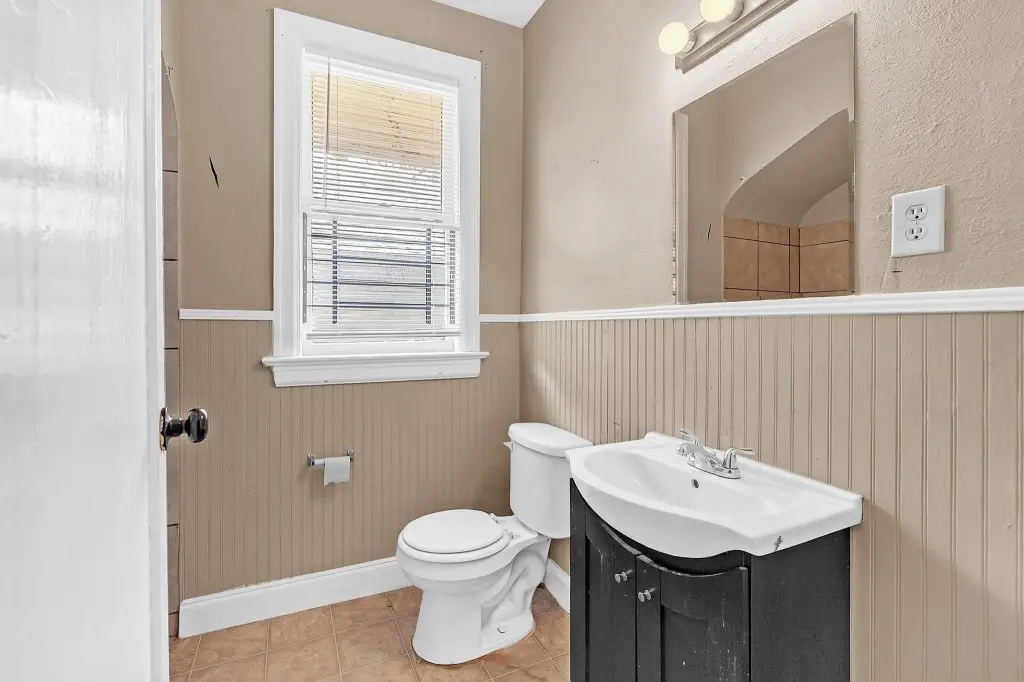
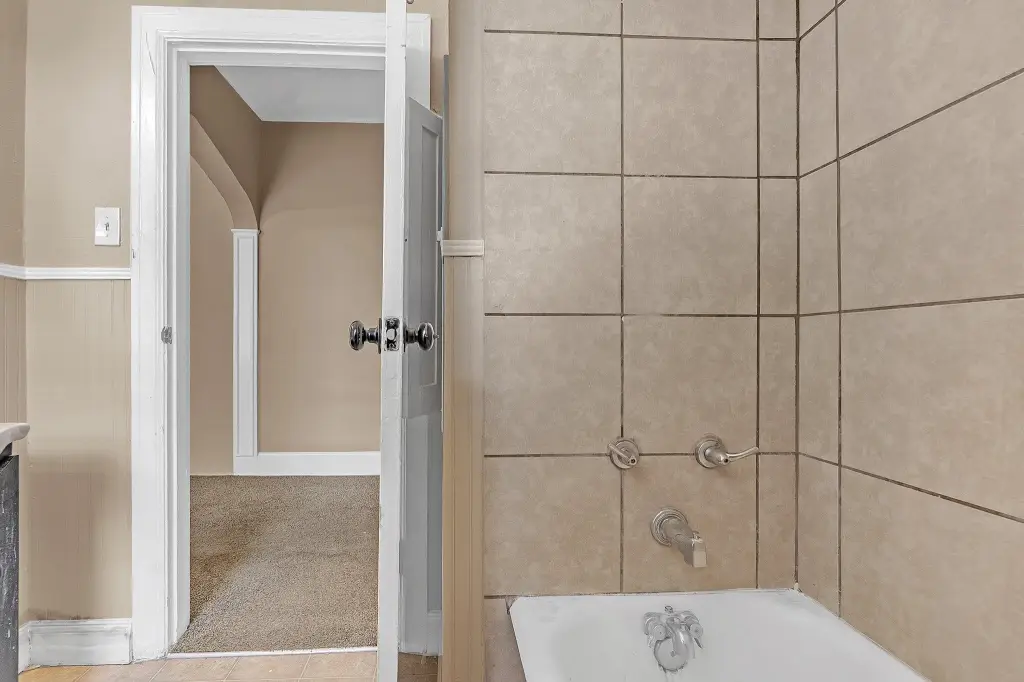
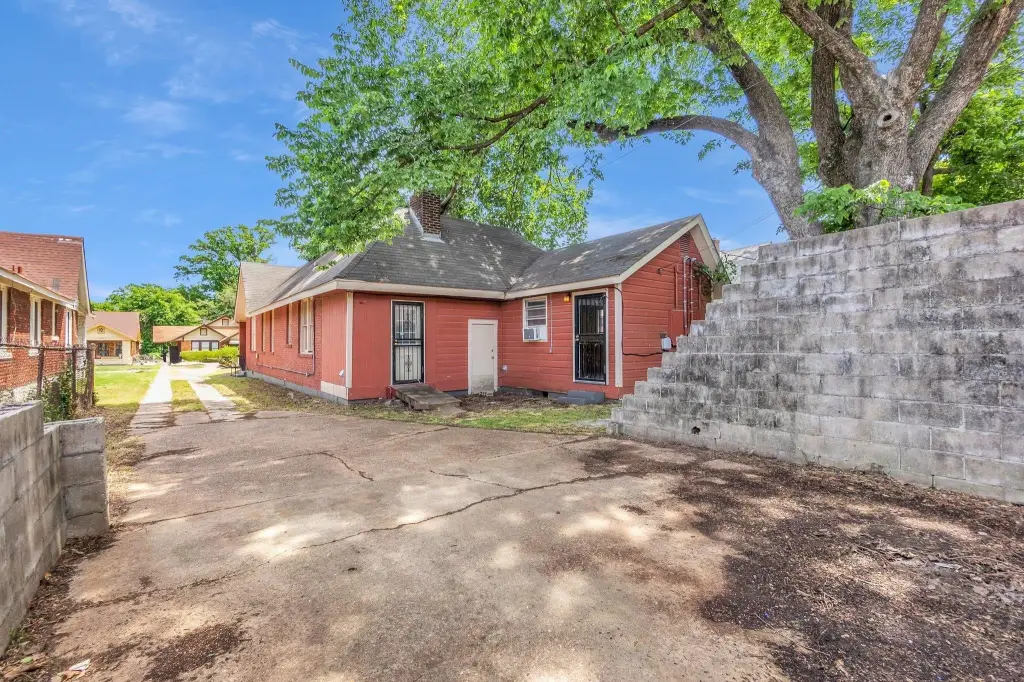
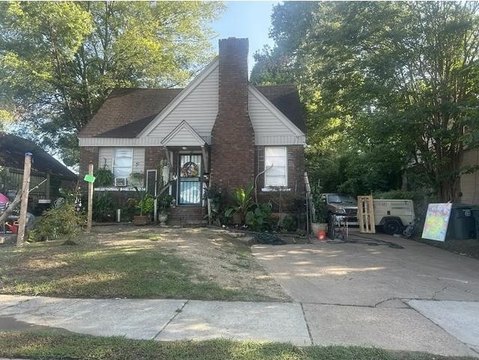
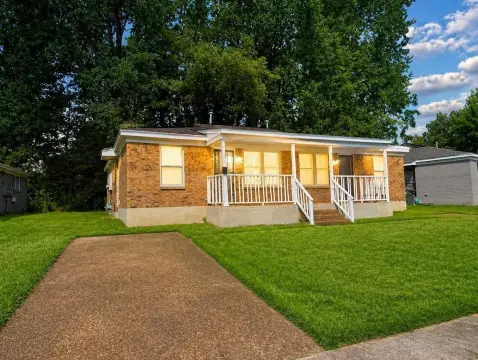
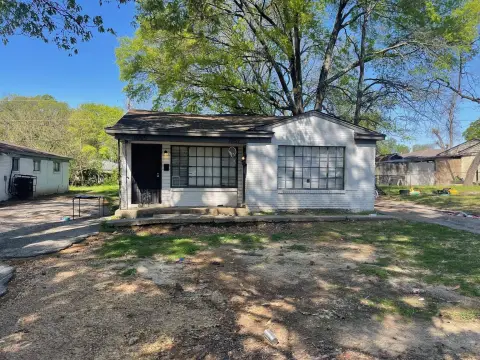
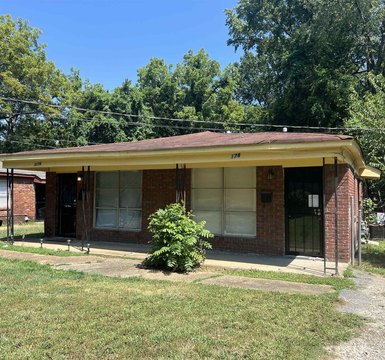
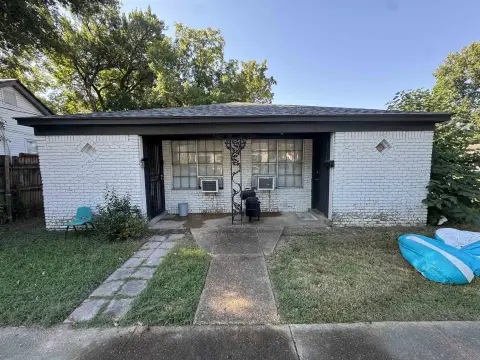
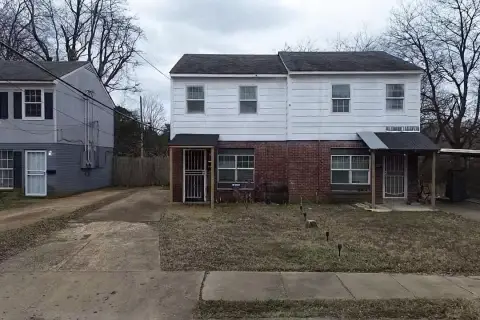
Built in 1930, this 1,692-square-foot duplex contains two one-bedroom, one-bath units. Each side includes a large kitchen, washer and dryer hookups, and neutral colors. The property requires minor cosmetic work before the units are rented.
The duplex is near Rhodes College, Crosstown Concourse, Memphis Zoo, and Midtown. Both units may be leased, or an owner may occupy one side while renting the other, subject to applicable requirements.
The duplex is near Rhodes College, Crosstown Concourse, Memphis Zoo, and Midtown. Both units may be leased, or an owner may occupy one side while renting the other, subject to applicable requirements.
Key Highlights
- Two one‑bedroom, one‑bath units within a 1,692‑square‑foot duplex
- Built in 1930
- Large kitchens and washer and dryer hookups in both units
Financial Insights
Estimated NOI and Cap Rate
NOI / Yr
$12,634
Cap Rate
9.02%
Suggested Prices Based on Cap Rates
Cap Rate 5%
$252,680
$252.7K
Cap Rate 7%
$180,486
$180.5K
Cap Rate 9%
$140,378
$140.4K
Market Conditions
NOI Build-Up for 1,692 SF
Gross rent
$24.6K $14.52/SF
− Vacancy
−$1.6K −$0.94/SF
EGI
$23.0K $13.58/SF
− OpEx
−$10.3K −$6.11/SF
NOI
$12.6K $7.47/SF
Area
Memphis, TN
Vacancy
6.50%
Lease Rate
$14.52 /SF/Yr
Expense Ratio
45.00%
Simulate Cap Rate and NOI
Suggested Prices Based on Cap Rates
Cap Rate 5%
$252,680
Cap Rate 7%
$180,486
Cap Rate 9%
$140,378
Alternative Uses
Best Use
Multifamily LT 5
$203.8K
$178.4K – $237.8K
NOI $14,269 @ 7.0% cap · market cap 10.19%
Second Best
Apartment 5plus
$180.5K
$157.9K – $210.6K
NOI $12,634 @ 7.0% cap · market cap 9.02%
Theoretical Best
Office A
$500.1K
$437.6K – $583.4K
NOI $35,004 @ 7.0% cap · market cap 25.00%
Zoning and permitted uses should be independently verified with authorities.
How Realmo checks its estimates
Property Analytics
Unlock full access to Insights
Subscribe to Realmo Intelligence
Open Analytics
Lease Details
2
Residential units
Location Intelligence
Trade Area within ½ mile
271
Businesses Nearby
Explore this area
Business Placement
Demographics for 38107, TN
15,655
Population
8,093
Households
1.9
Avg Household Size
37
Median Age
24%
College-Educated
87%
High-School Grad
5.4 sq mi
ZIP Area
2,899
Density / Sq Mi
$36,393
Median Household Income
$34,958
Median Earnings
$999
Median Rent
$128,600
Median Home Value
Check the figures for this property
Cap Rate, Value Estimation, Potential NOI and more
View Realmo Analytics
Market
Vacancy Rate% for Multifamily in South region



Frequently Asked Questions
What type of property is this?
Duplex - Two one-bedroom units offer washer and dryer hookups, neutral finishes, and a manageable cosmetic refresh.
Where is this duplex located?
The property is located at 925 N WILLETT St Memphis, TN.
What is the asking price?
The asking price for this property is $140,000.
What are key features of this property?
This property features: Two one‑bedroom, one‑bath units within a 1,692‑square‑foot duplex; Built in 1930; Large kitchens and washer and dryer hookups in both units