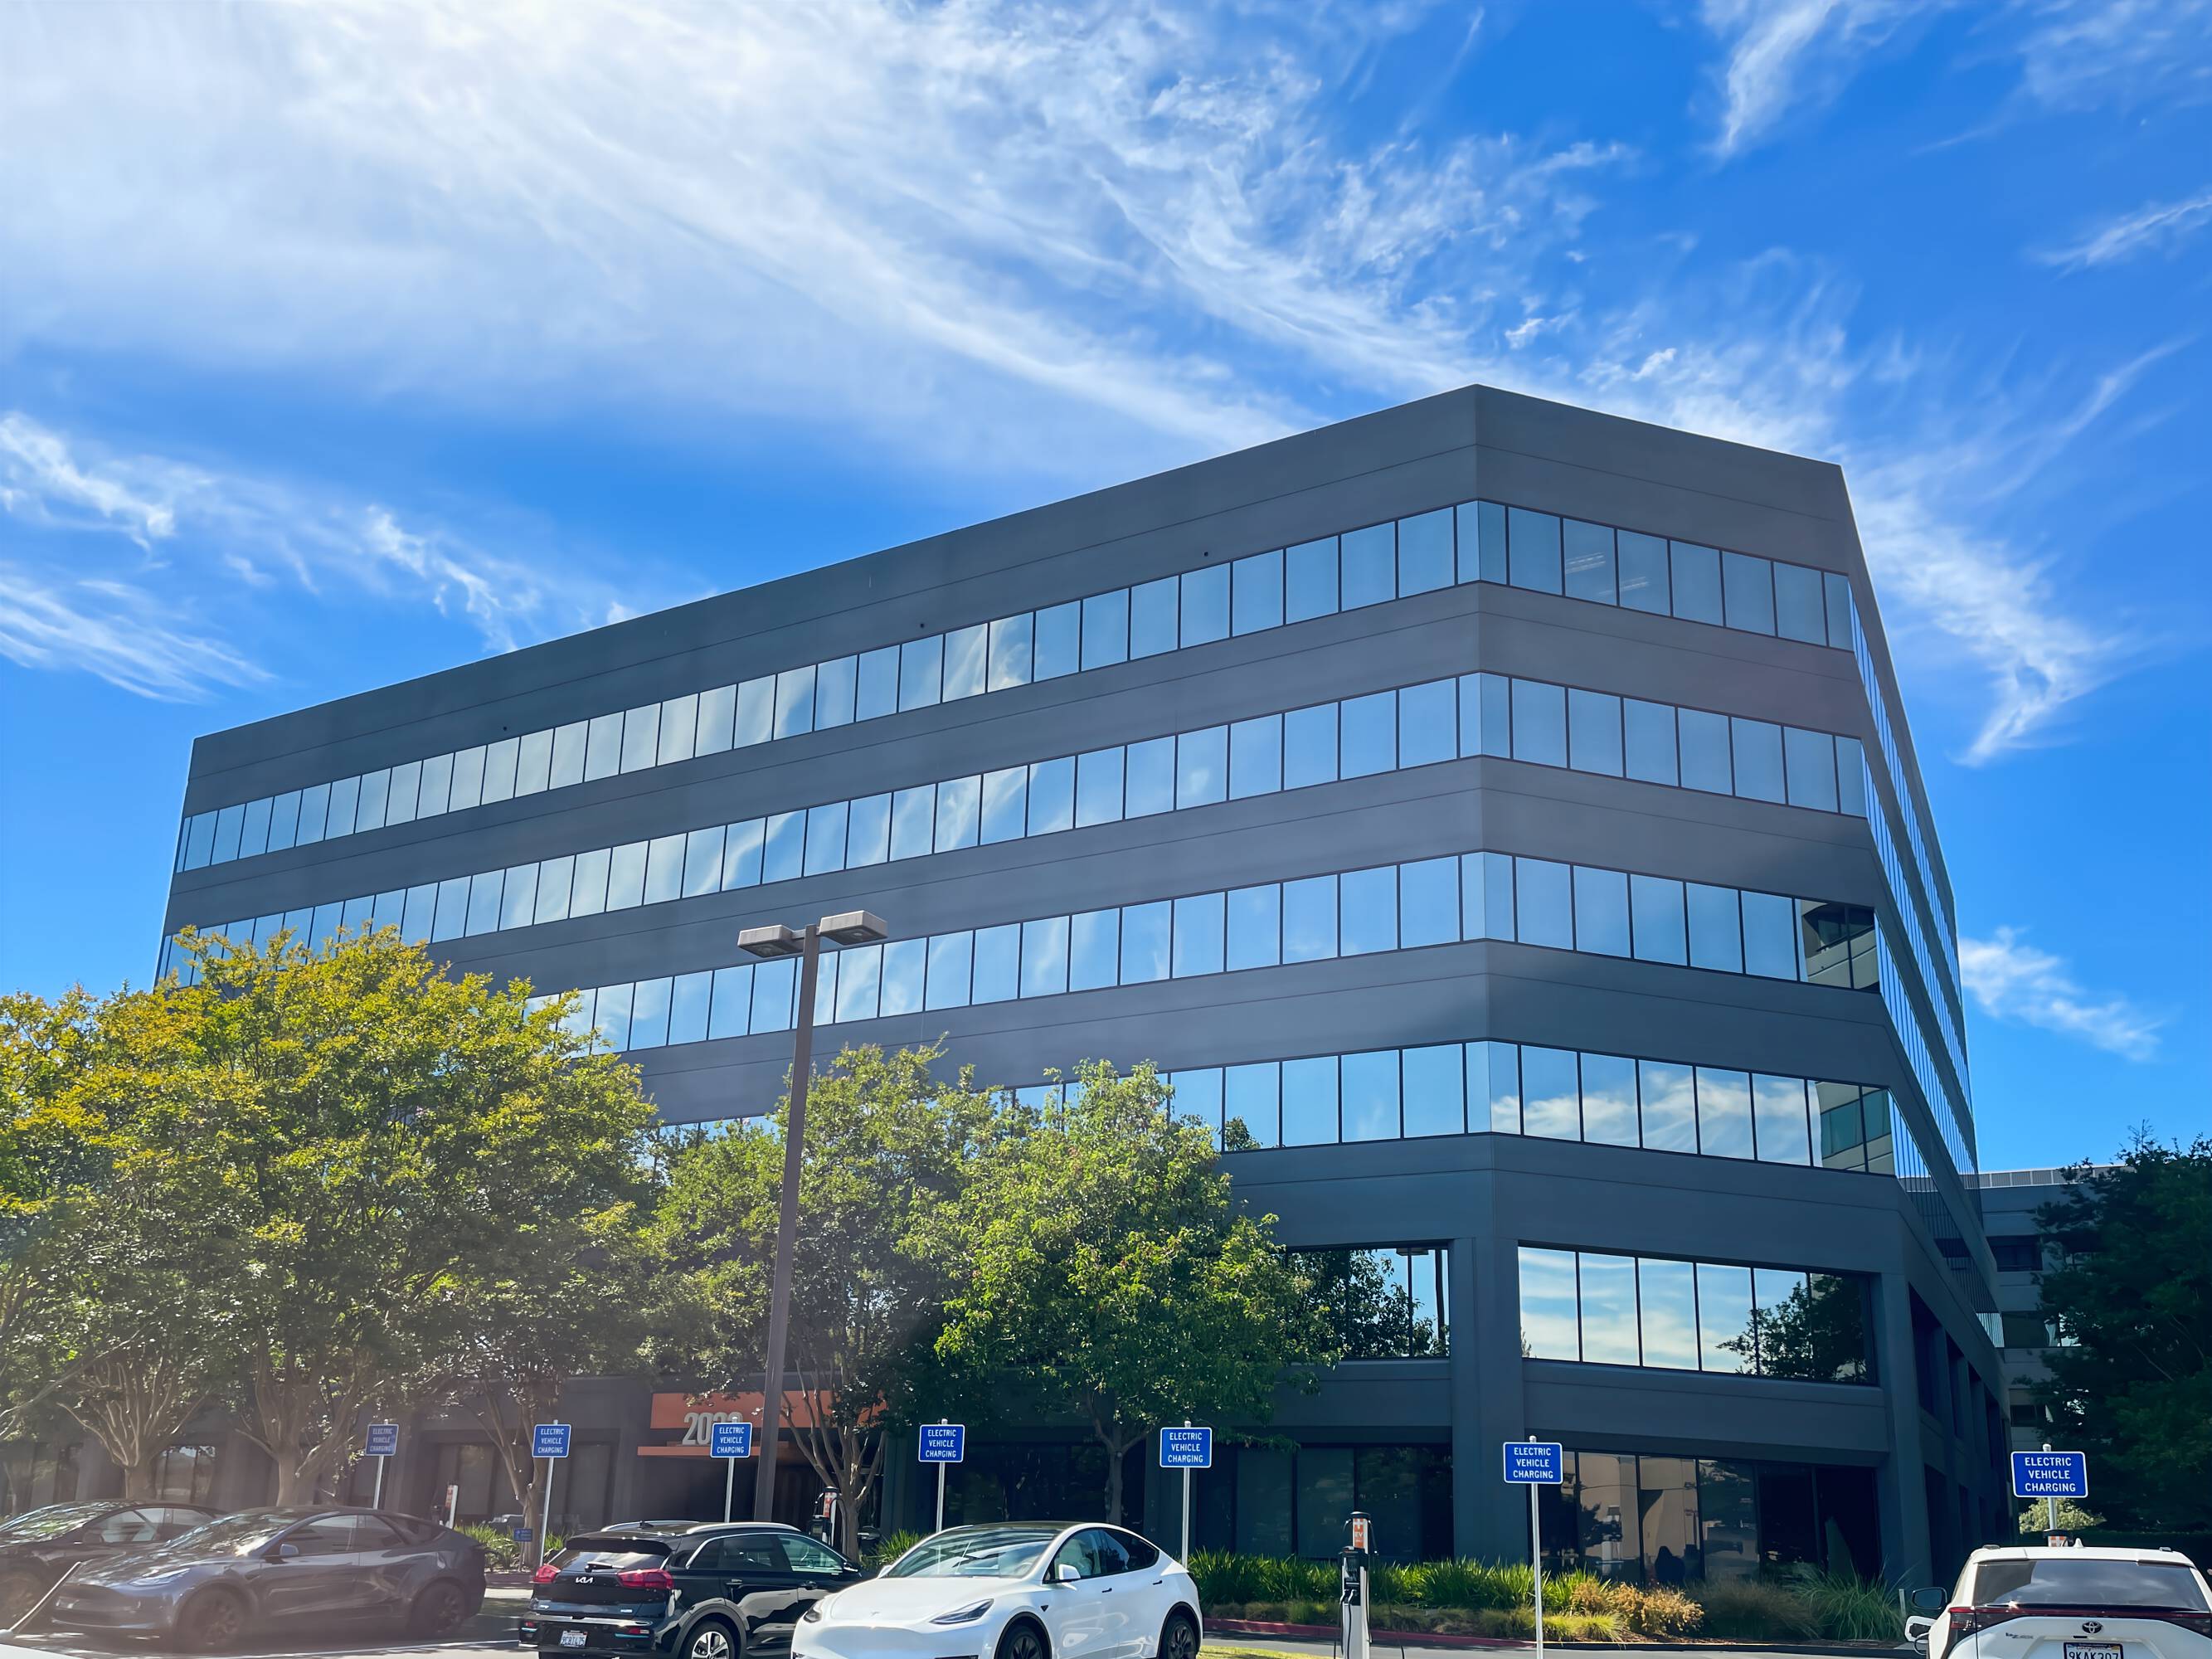
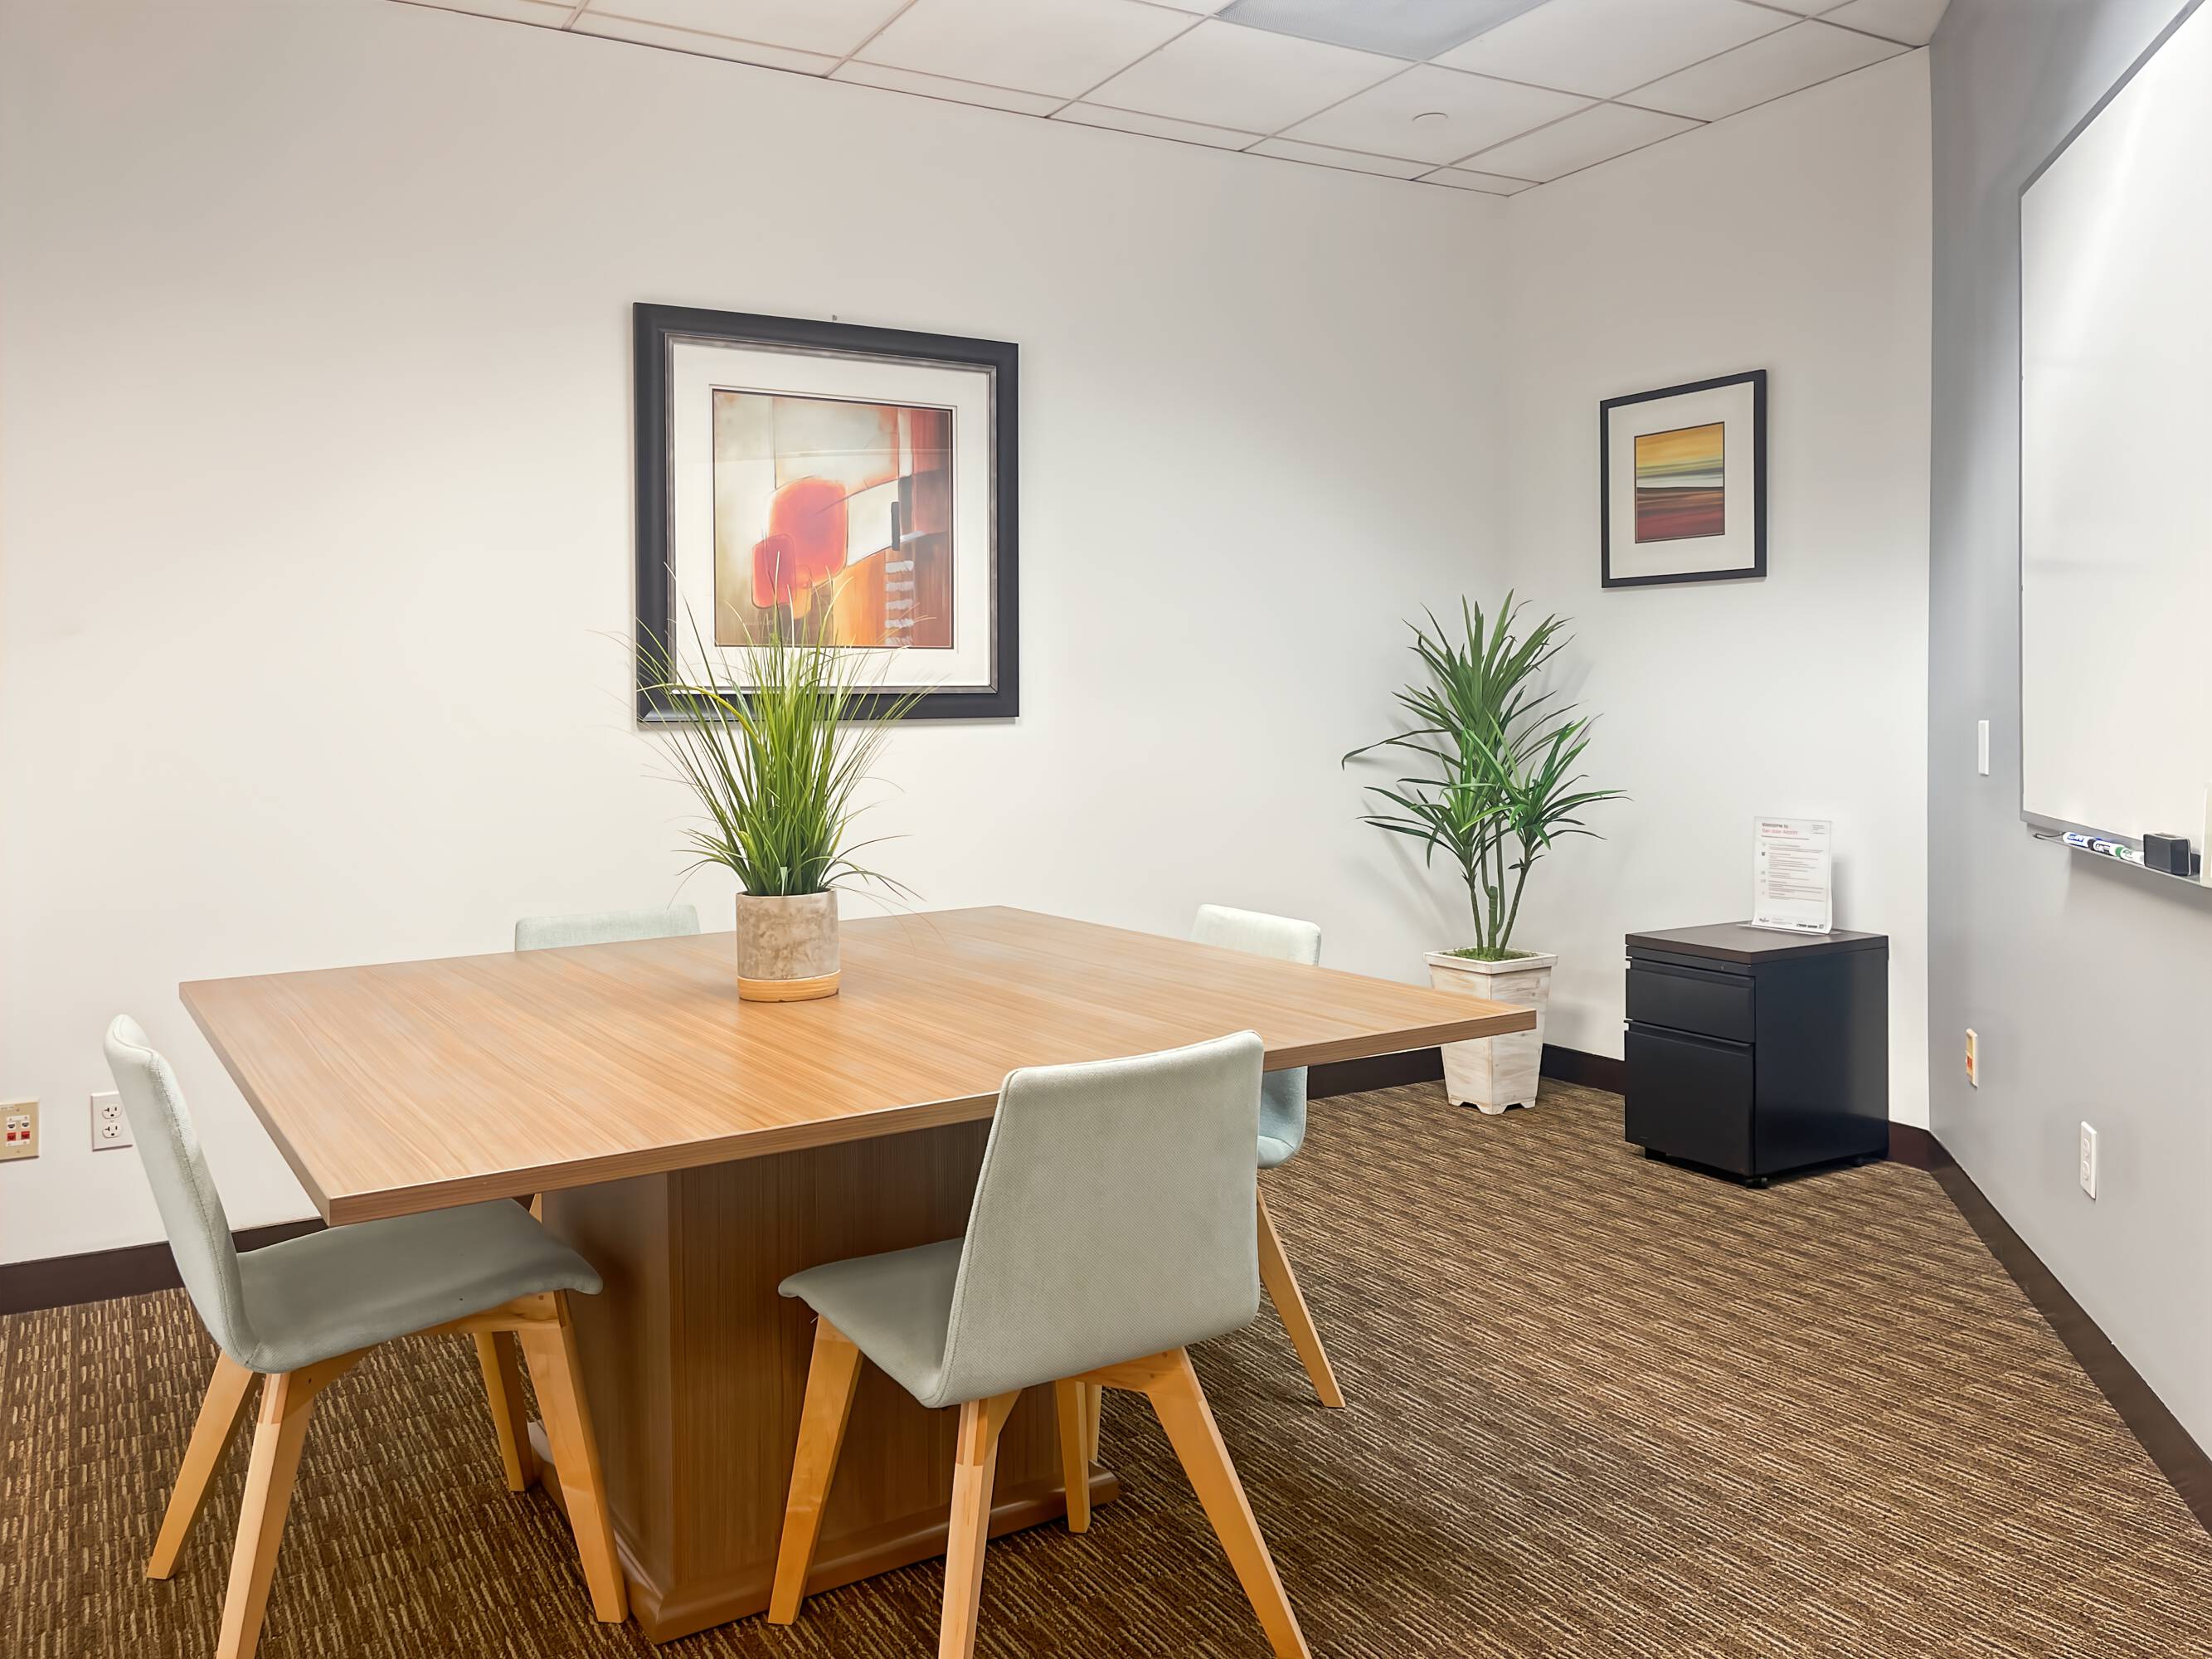
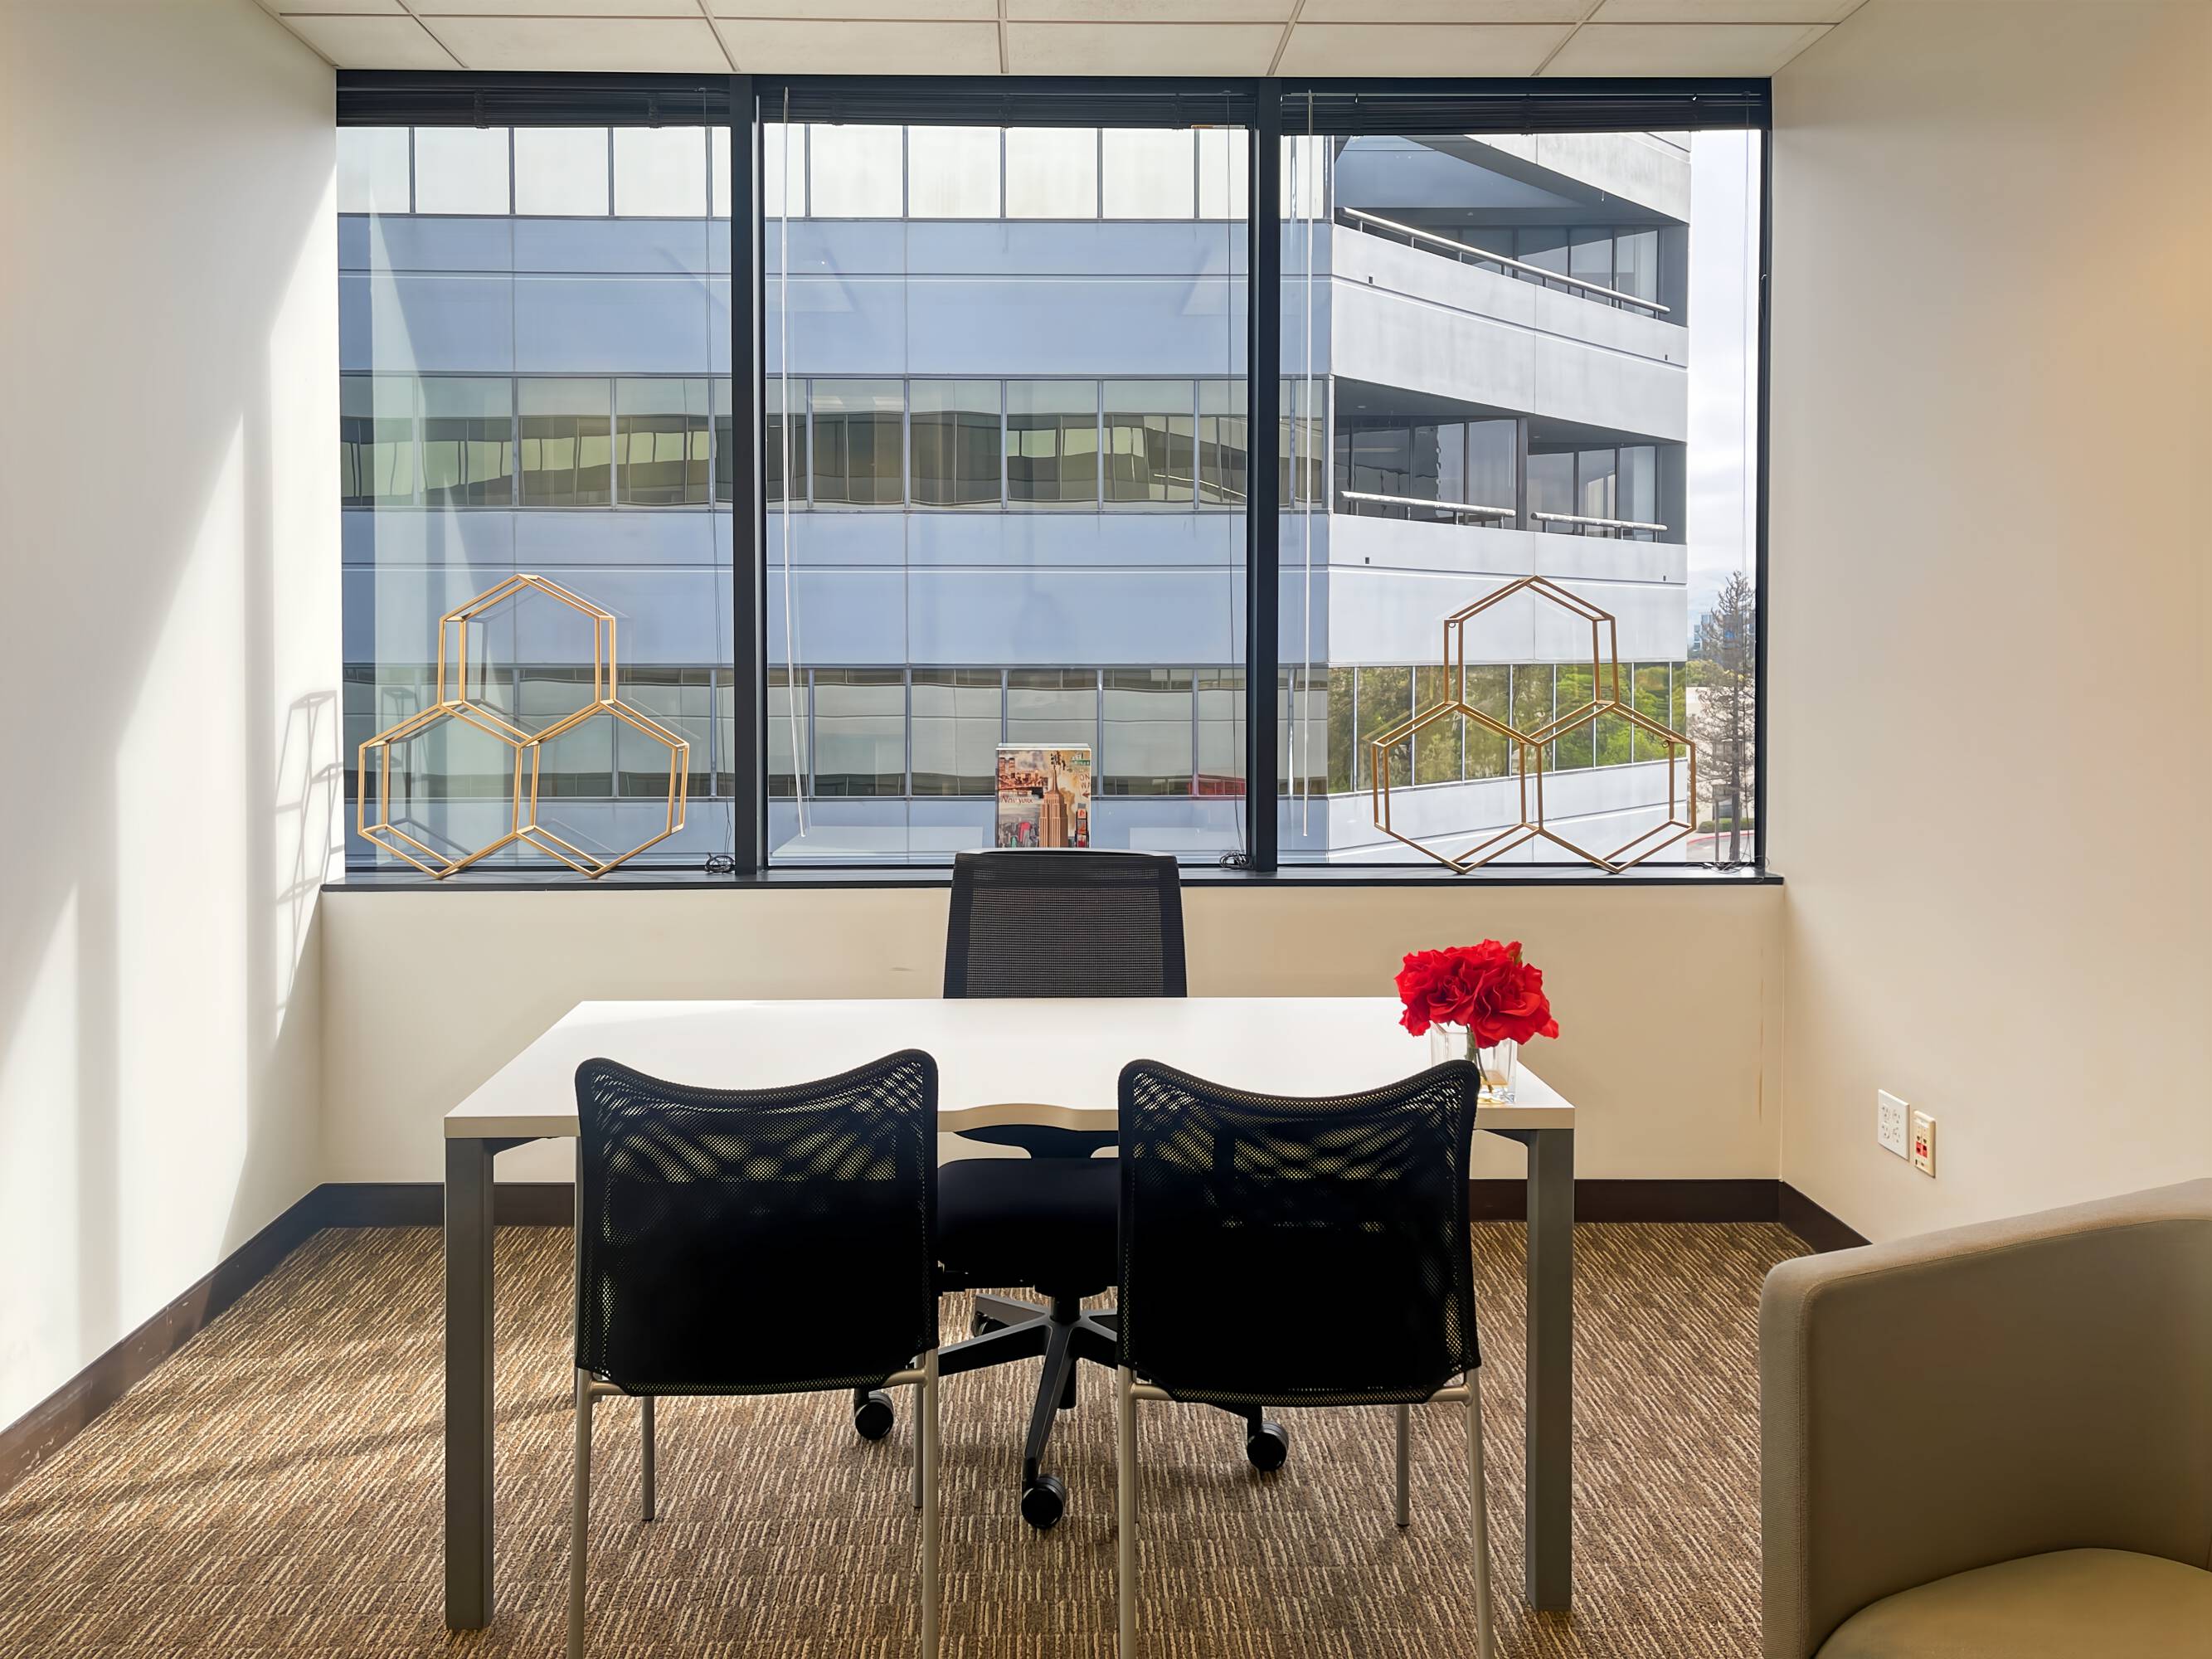
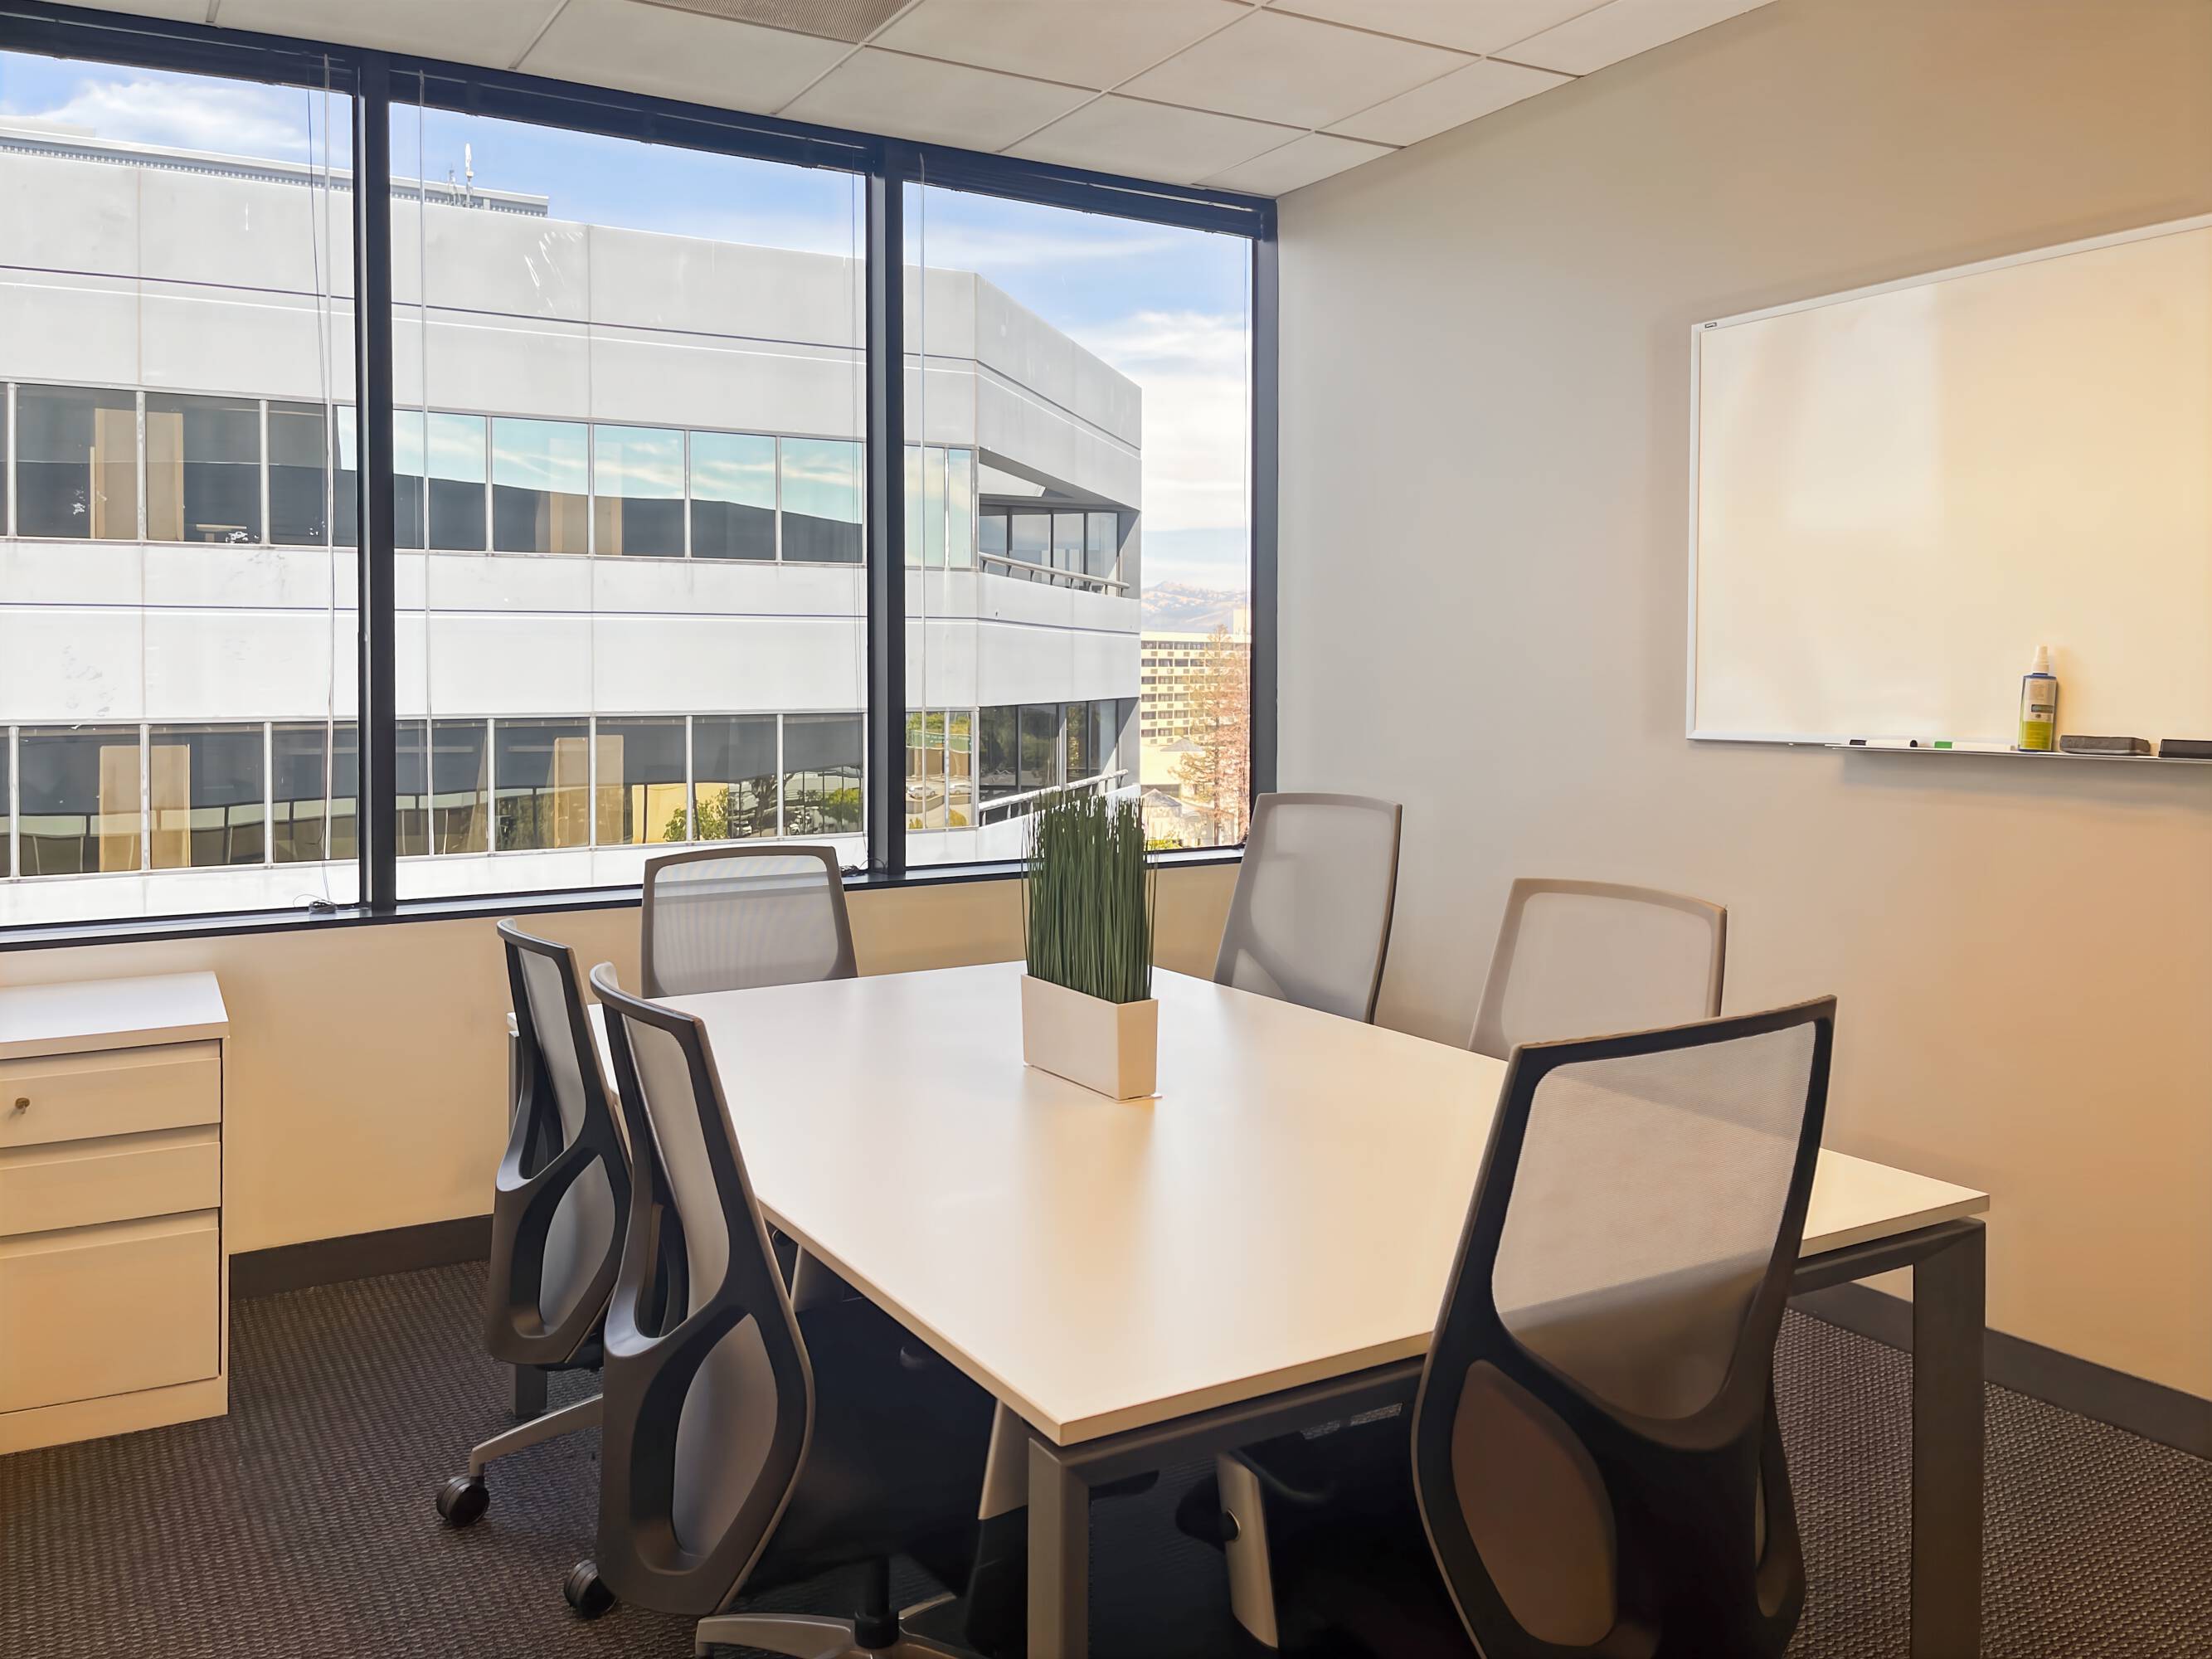
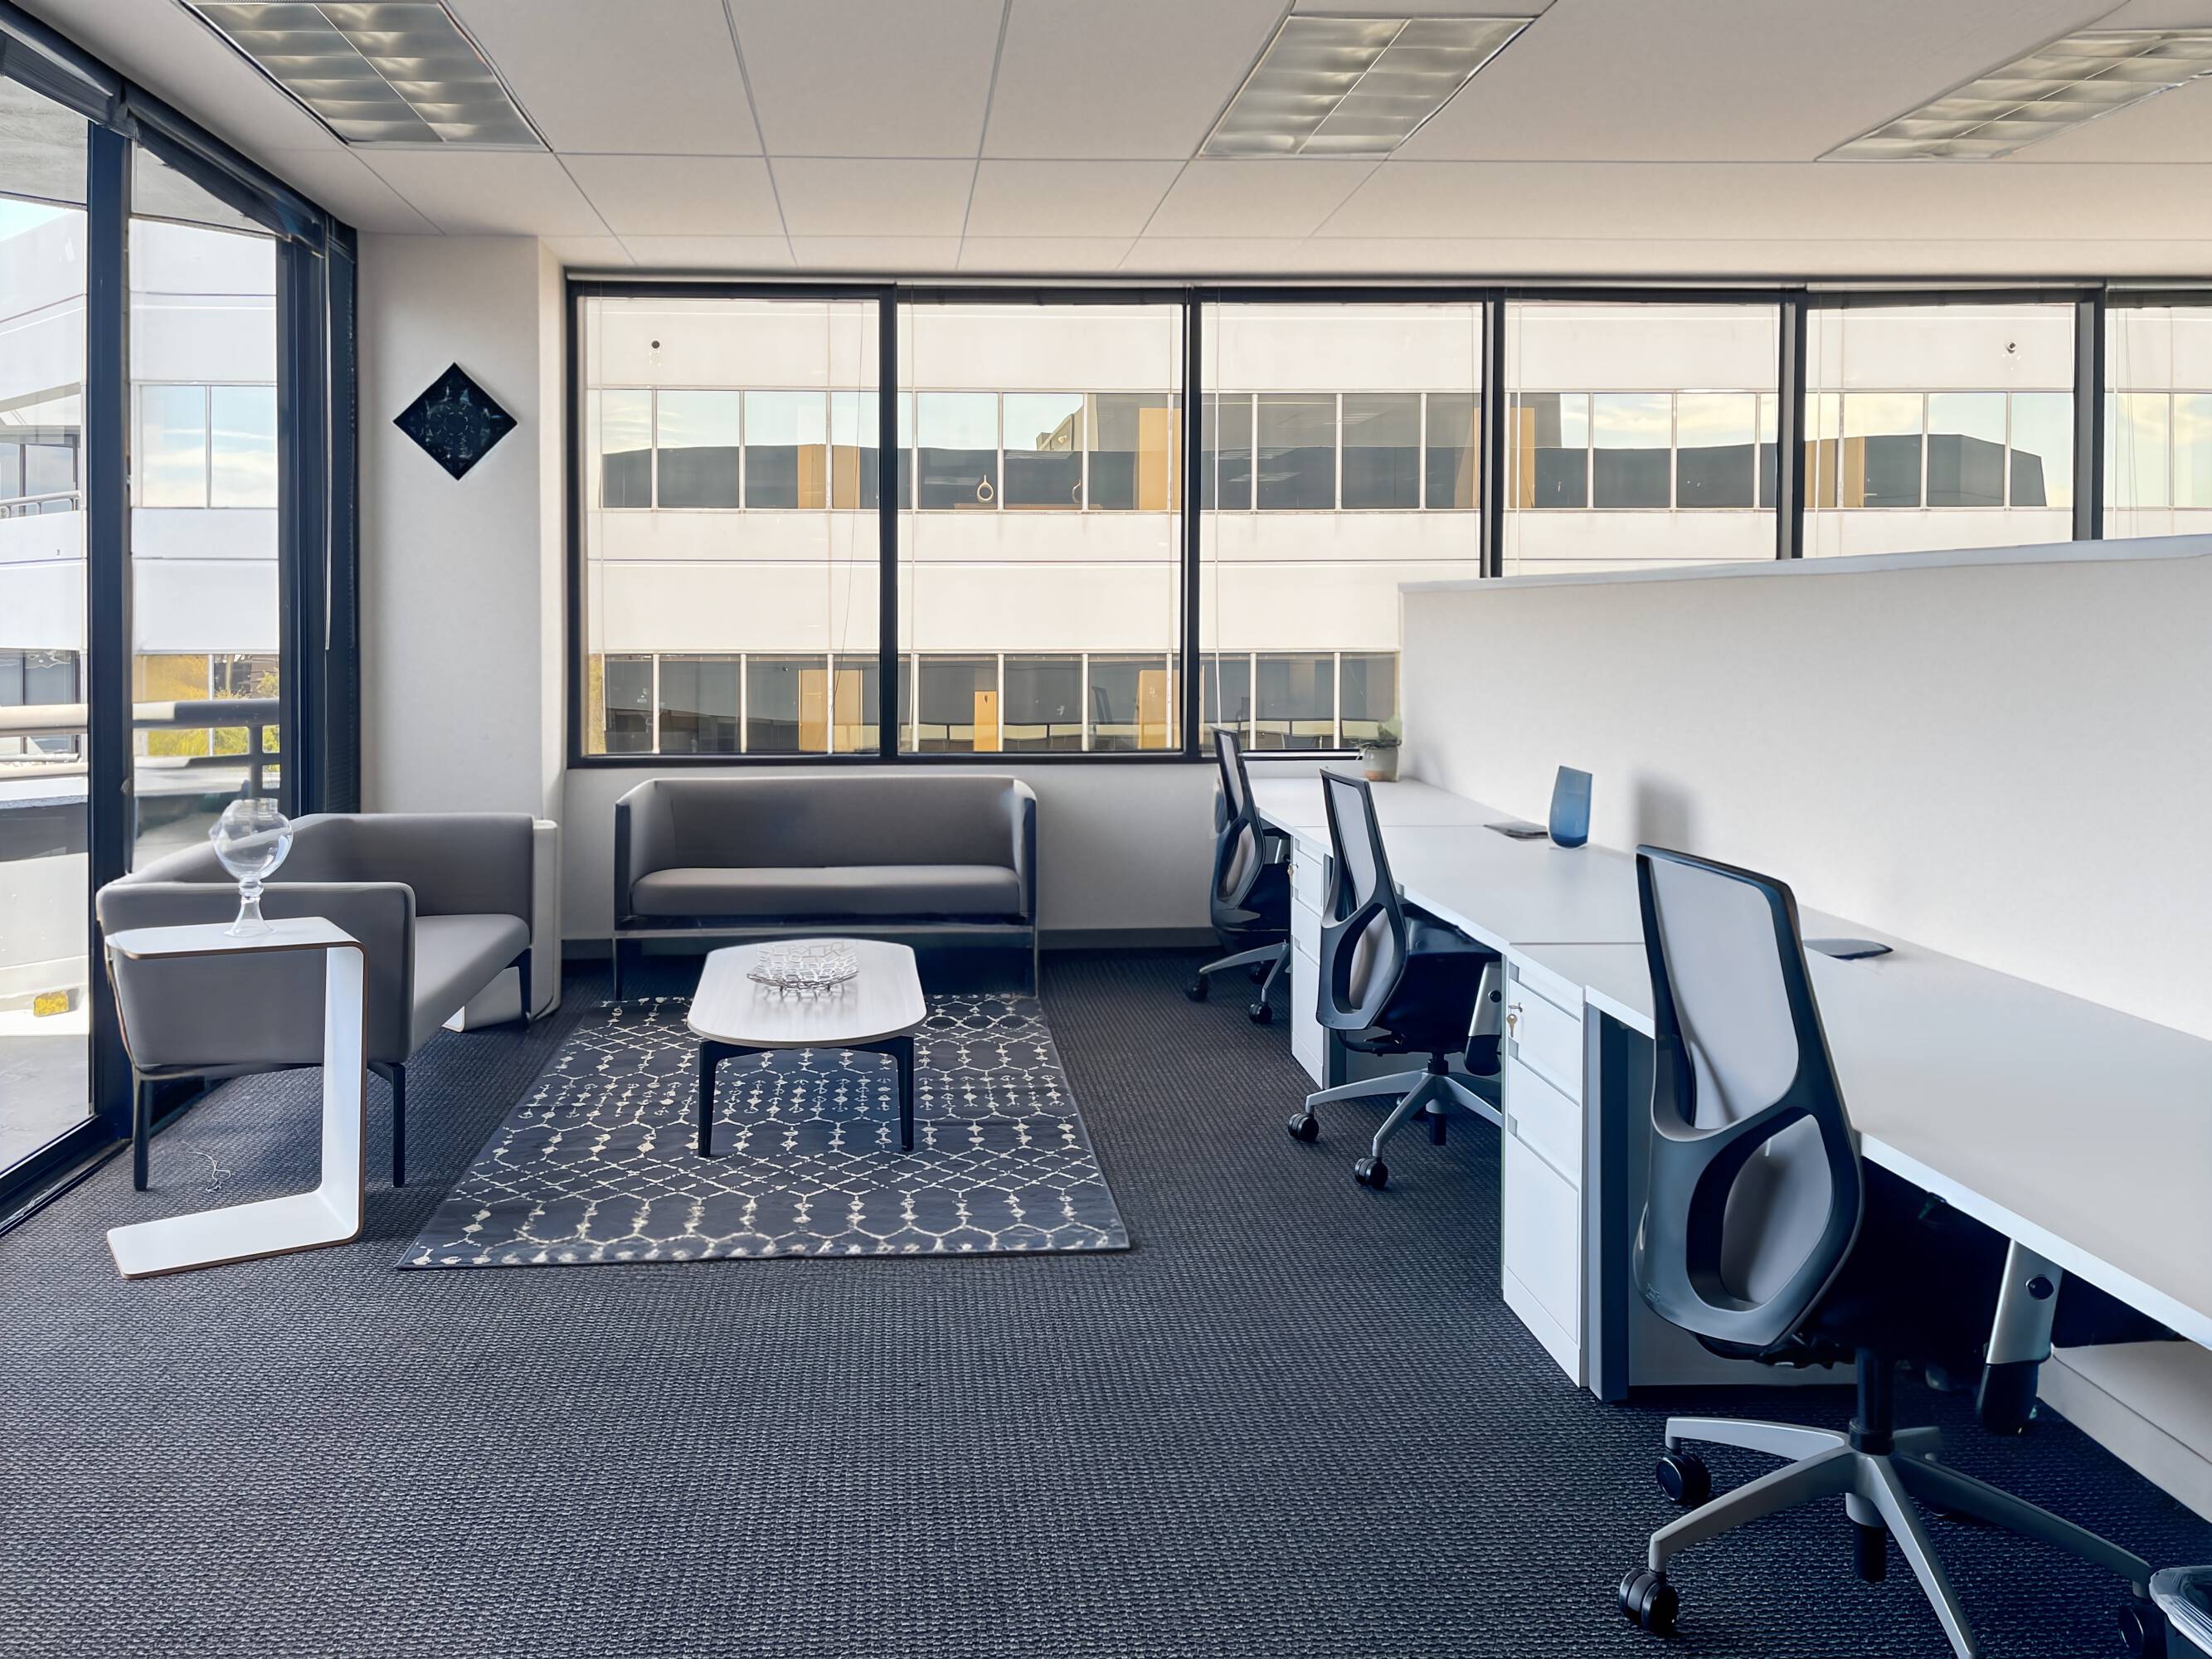
2033 Gateway Place 5th fLOOR, San Jose, CA 95110
Global network of workspaces with flexible options for rent.
- Added:
- Mar 27, 2025
- Days on Market:
- 435
- Last Refresh:
- May 12 at 11:29 pm
Property Features for 2033 Gateway Place 5th fLOOR
General Information
- Standard status
- Active
- Property subtype
- Office
Spaces For Lease
at 2033 Gateway Place 5th fLOOR Contact us- Size
- Type
- Office
Private office for 2 people $1.71/Mo
- Size
- Type
- Office
Flexible office membership $2/Mo
- Size
- Type
- Office
Private office for 5 people $3/Mo
- Size
- Type
- Office
Flexible coworking membership $1.19/Mo
- Size
- Type
- Office
Private office for 3 people $1.75/Mo
- Size
- Type
- Office
Open plan office space for + 10 people $3/Mo
- Size
- Type
- Office
Virtual office $4/Mo
- Size
- Type
- Office
Open plan office space for + 15 people $3/Mo
- Size
- Type
- Office
Private office for 4 people $2/Mo
- Size
- 1,535 SF
- Type
- Office
Big Block $12/Mo
- Size
- Type
- Office
Coworking space $1.19/Mo
Listing agent California Regus US License #FLBO
Listing office Regus
Listing date Mar 27, 2025
Source Crexi
Displayed information is deemed reliable but is not guaranteed and should be independently verified.
All listing content including descriptions, pricing, images are the copyrighted material of Regus
HighLights
- Global network of over 3000 workspaces.
- Customizable office spaces available, ranging from 1 to 100+ desks.
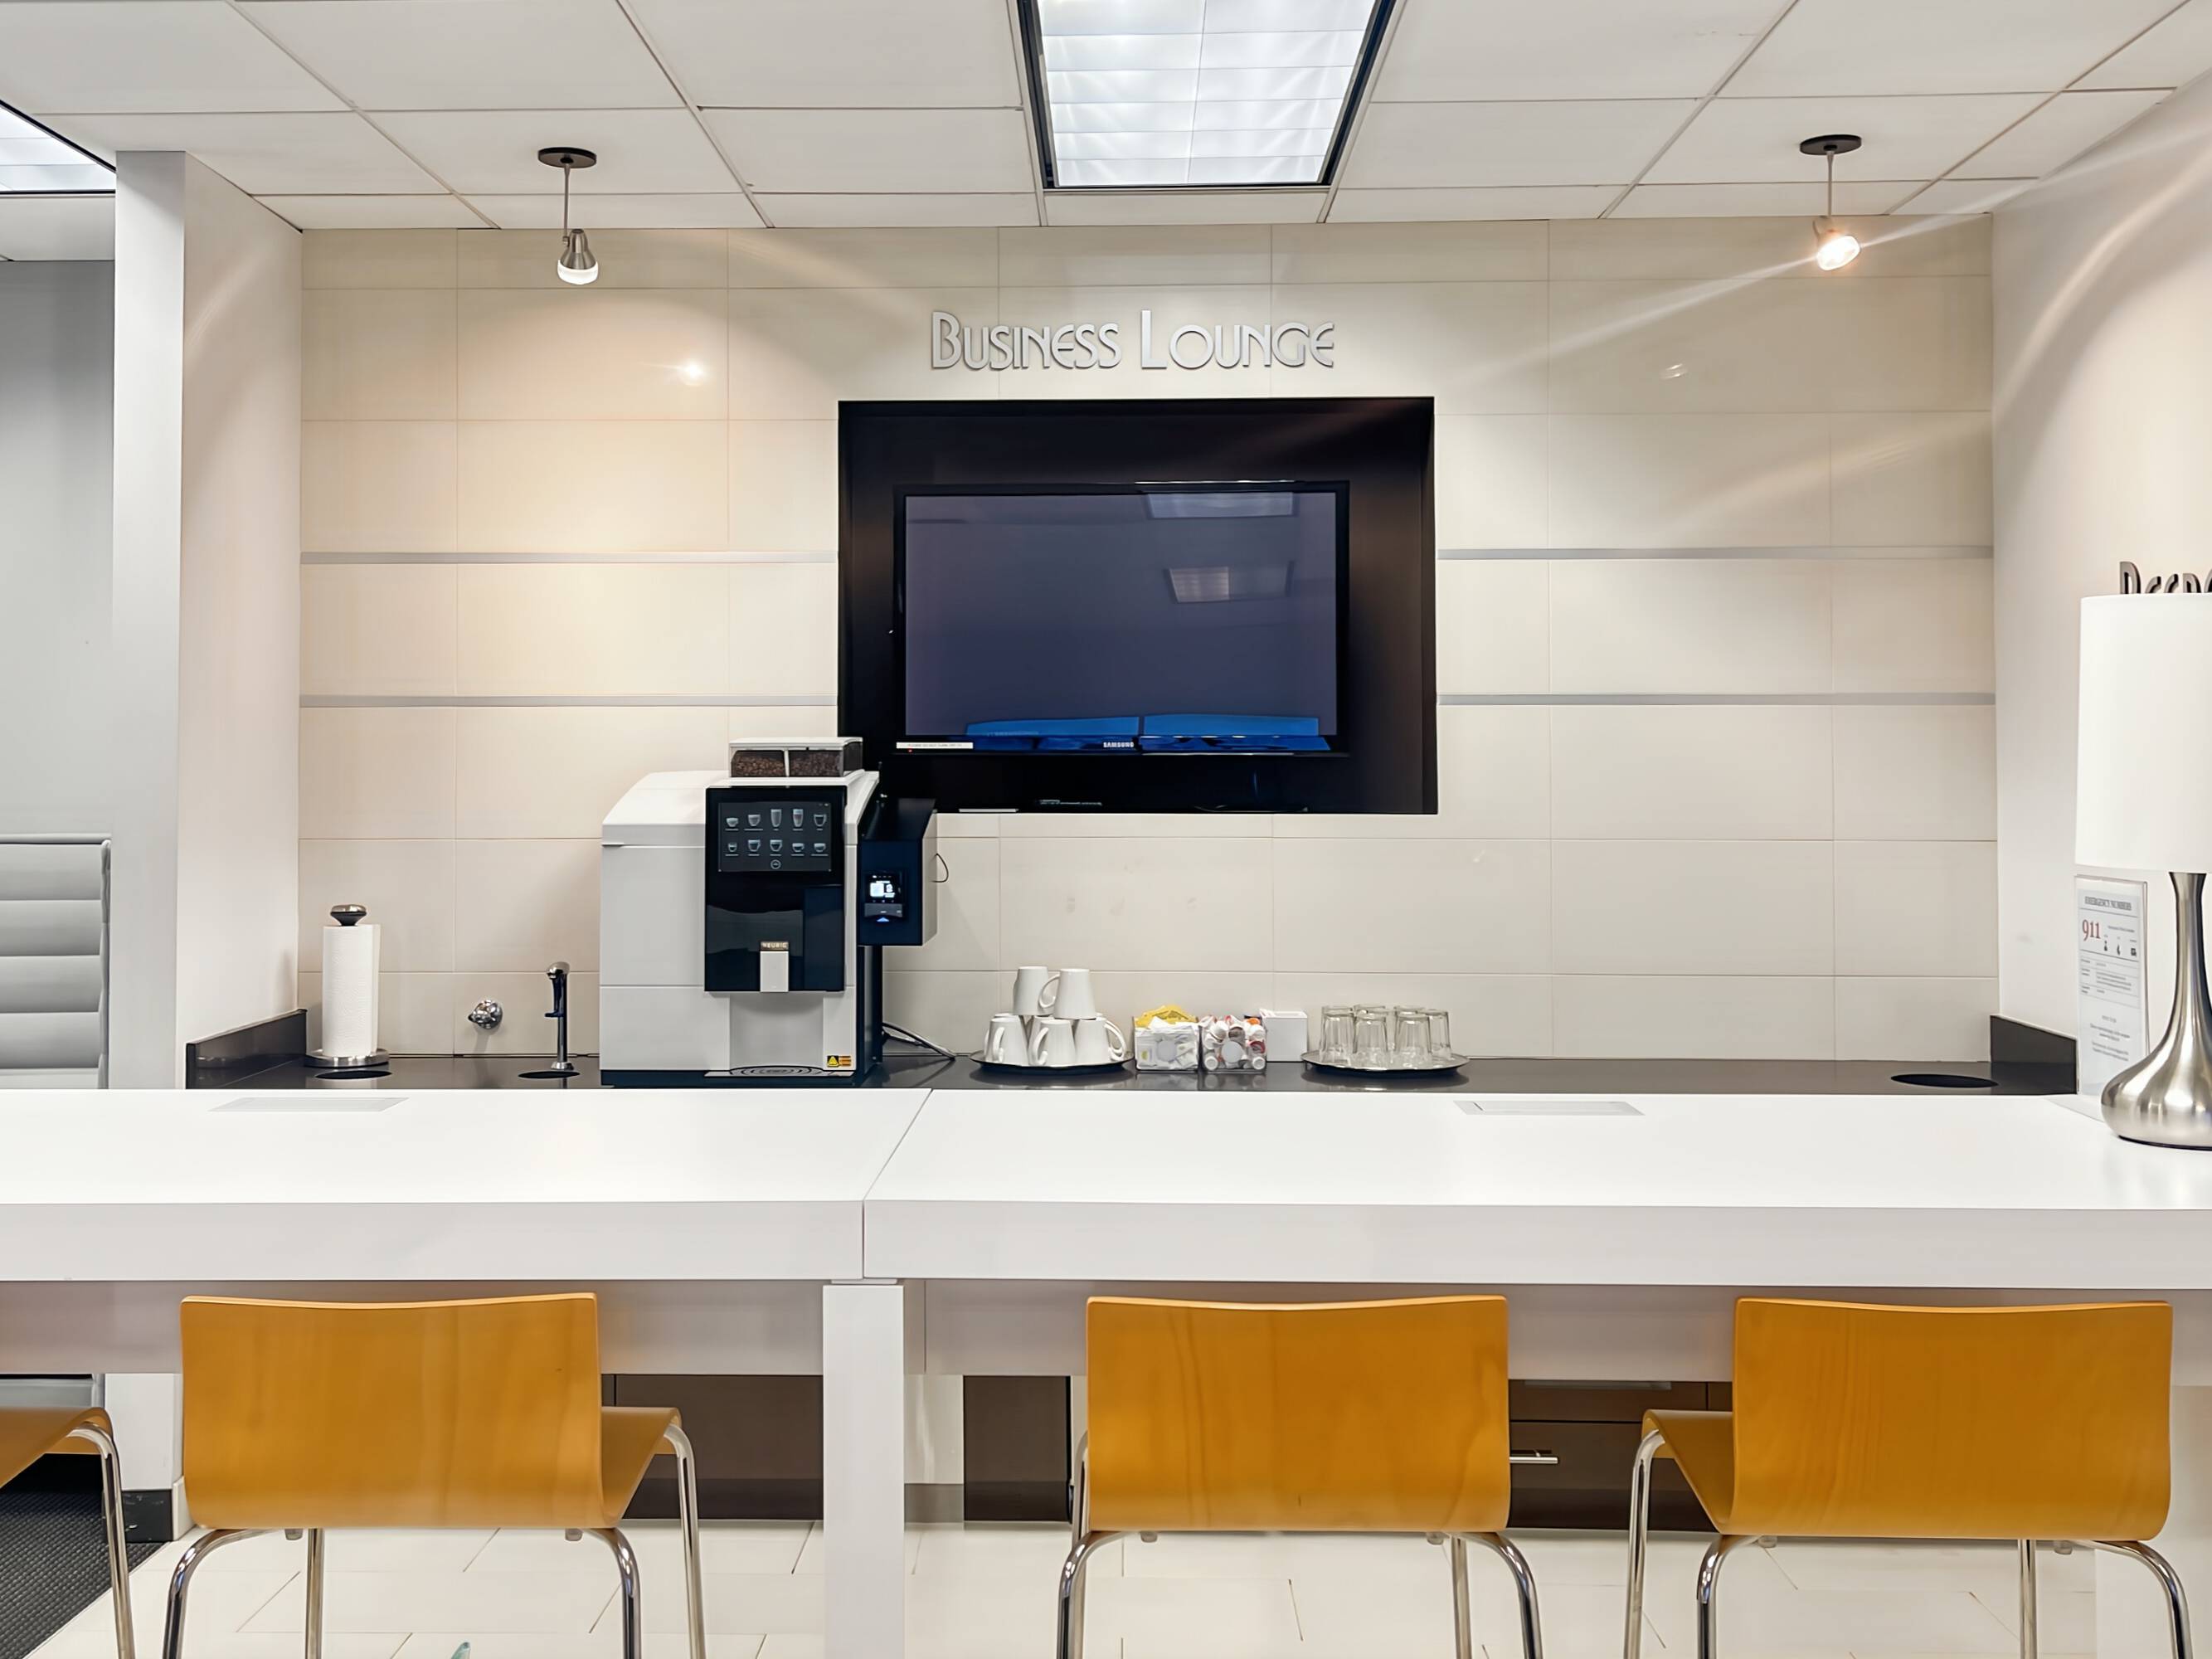
- Flexible working plans with access to business lounges in various locations.
- Variety of options: private offices, coworking spaces, and meeting rooms.
- Virtual office options with prime business addresses and virtual assistant services.
- Offices available from 5sqm to 1000sqm or more.
Overview
Current Use by Public Records
Location Insight
- Map
- Local Demand
- City
- San Jose
- County
- Santa Clara
- State
- California
- Longitude
- -121.9256719
- Latitude
- 37.3711742