Flex-Office Building Investment
For Sale
Contact for pricing
5957 - 6035 Lakeside Blvd, Indianapolis, IN 46278
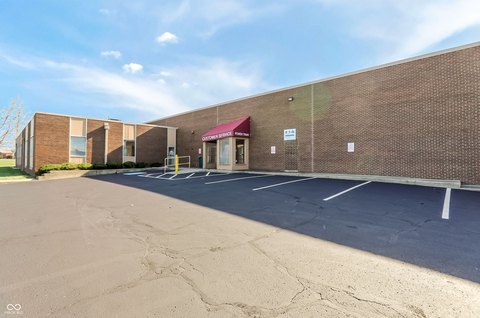
Multi-tenant flex-office building on 14.82 acres, 60.1% leased.
Property Size89,805 SF
Lot Size14.82 Acres
Price / SF$150.44
Days on Market750
Property Features for 5957 - 6035 Lakeside Blvd
General Information
Standard status
Active
Size
89,805 SF
Class
A
Lot size
14.82 Acres
Property subtype
Office
Occupancy
97%
Lease Type
Modified Gross
Investment Type
Institutional
Building Details
Year Built
1986
Buildings
1
Stories
1
Tenancy
Multi
Listing Agency:
Colliers - Dallas, Texas
Listed By:
Geoff Ficke · License #TX 0593051
(972) 759-7814
Source:
Crexi
Added: Sep 25, 2024
Changed: Oct 1
Last Checked: Oct 12 at 9:24PM
Displayed information is deemed reliable but is not guaranteed and should be independently verified. All listing content including descriptions, pricing, images are the copyrighted material of Colliers - Dallas, Texas
Investment Insights
Based on property information with market context.
This multi-tenant, single-story flex-office building, developed in 1986, is located at 5957-6035 Lakeside Boulevard, Indianapolis, Indiana. The property is 60.1% leased and comprises 89,805 rentable square feet on a 14.82-acre site. The property is suitable for commercial real estate, flex space, industrial, and office use. The building is currently tenanted by the USDA and USGS. The USDA office serves as the Headquarters and administrative office for the state of Indiana and is in effect the mortgage lending arm of the USDA for Indiana. The USGS has the unique mission to collect and disseminate information on the nations water resources, including information on water related natural hazards, groundwater management and surface water resources, and protection of water resources for health and environmental quality. The GSA lease provides stable returns guaranteed by the US Government.
Key Highlights
- Investment‑grade tenanted asset with a GSA lease, providing stable returns guaranteed by the US Government (S&P AA+).
- Leased to the USDA Headquarters and administrative office for the state of Indiana, the mortgage lending arm of the USDA for Indiana.
- Leased to USGS with a unique mission focused on collecting and disseminating information on the nation's water resources.
Financial Insights
Estimated NOI and Cap Rate
NOI / Yr
$1,185,695
Cap Rate
8.78%
Suggested Prices Based on Cap Rates
Cap Rate 5%
$23,713,900
$23.7M
Cap Rate 7%
$16,938,500
$16.9M
Cap Rate 9%
$13,174,389
$13.2M
Market Conditions
NOI Build-Up for 89,805 SF
Gross rent
$1.94M $21.60/SF
− Vacancy
−$358.9K −$4.00/SF
EGI
$1.58M $17.60/SF
− OpEx
−$395.2K −$4.40/SF
NOI
$1.19M $13.20/SF
Area
Indianapolis, IN
Vacancy
18.50%
Lease Rate
$21.60 /SF/Yr
Expense Ratio
25.00%
Simulate Cap Rate and NOI
Suggested Prices Based on Cap Rates
Cap Rate 5%
$23,713,900
Cap Rate 7%
$16,938,500
Cap Rate 9%
$13,174,389
Alternative Uses
Best Use
Office B
$16.94M
$14.82M – $19.76M
NOI $1,185,695 @ 7.0% cap · market cap 8.78%
Second Best
Flex RnD
$12.61M
$11.03M – $14.71M
NOI $882,604 @ 7.0% cap · market cap 6.53%
Theoretical Best
Office A
$22.35M
$19.56M – $26.08M
NOI $1,564,762 @ 7.0% cap · market cap 11.58%
Zoning and permitted uses should be independently verified with authorities.
How Realmo checks its estimates
Property Analytics
Unlock full access to Insights
Subscribe to Realmo Intelligence
Open Analytics
Current Use
Location Intelligence
Trade Area within ½ mile
489
Businesses Nearby
Explore this area
Business Placement
Demographics for 46278, IN
8,910
Population
3,357
Households
2.7
Avg Household Size
45
Median Age
62%
College-Educated
97%
High-School Grad
13.2 sq mi
ZIP Area
675
Density / Sq Mi
$153,930
Median Household Income
$79,007
Median Earnings
$1,172
Median Rent
$420,200
Median Home Value
Check the figures for this property
Cap Rate, Value Estimation, Potential NOI and more
View Realmo Analytics
Market
Vacancy Rate% for Office in Indianapolis, IN

Questions? Ask Rey
Realmo’s AI knows this listing — price, zoning, demand, history. Ask anything.




Frequently Asked Questions
What type of property is this?
Office building - Multi-tenant flex-office building on 14.82 acres, 60.1% leased.
Where is this office building located?
The property is located at 5957 - 6035 Lakeside Blvd Indianapolis, IN.
What is the asking price?
The asking price for this property is $13,510,000.
What are key features of this property?
This property features: Investment‑grade tenanted asset with a GSA lease, providing stable returns guaranteed by the US Government (S&P AA+).; Leased to the USDA Headquarters and administrative office for the state of Indiana, the mortgage lending arm of the USDA for Indiana.; Leased to USGS with a unique mission focused on collecting and disseminating information on the nation's water resources.


