Office Building with Excess
For Sale
Contact for pricing
6500 Amarillo Blvd West, Amarillo, TX 79106
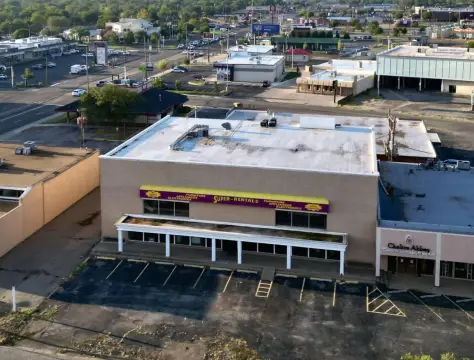
Versatile office building with classrooms, auditorium, and excess land.
Property Size26,410 SF
Lot Size7.65 Acres
Price / SF$170.20
Days on Market1542
Property Features for 6500 Amarillo Blvd West
General Information
Standard status
Active
Size
26,410 SF
Class
B
Lot size
7.65 Acres
Property subtype
Office
Zoning
PD for Office/Medical Office
Occupancy
100%
Lease Type
NNN
Building Details
Tenancy
Single
Listing Agency:
Gaut Whittenburg Emerson CRE
Listed By:
Ben Whittenburg · License #TX SA664767000
(806) 373-3111
Source:
Crexi
Added: Jul 28, 2022
Changed: Oct 15
Last Checked: Oct 16 at 7:04AM
Displayed information is deemed reliable but is not guaranteed and should be independently verified. All listing content including descriptions, pricing, images are the copyrighted material of Gaut Whittenburg Emerson CRE

Ask AI about this property
Review the available facts, identify missing information and prepare questions for the agent.
Investment Insights
Based on property information with market context.
The property, currently operating as the Texas A&M Agrilife Research & Extension Center at Amarillo, offers adaptability for various uses. The building is in good condition and features office spaces, classrooms, a large kitchen/break room, a shop area with a grade-level door, and a 300-person auditorium. Situated on 7.65 acres, the main facility includes 13.34 acres of excess land. The land and buildings can be sold separately and can be purchased with the property to the southwest. Located at the intersection of W. Amarillo Blvd. and Killgore Dr. in the Harrington Regional Medical Center, the property benefits from its proximity to BSA Hospital, Northwest Texas Hospital, Texas Tech University Health Sciences Center at Amarillo, and the Texas Tech University School of Veterinary Medicine. Access and visibility are ideal. Amarillo, Texas, situated in the heart of the Texas Panhandle, serves as the hub of economic activity for the Texas Panhandle and surrounding counties. Key industries in the area include oil and gas, beef processing, dairy, agriculture, aviation and aerospace, and bioscience. The property size is 26410 square feet.
Key Highlights
- Prime location in the Harrington Regional Medical Center, near major hospitals and Texas Tech University Health Sciences Center and School of Veterinary Medicine.
- Significant excess land (13.34 acres) offers considerable development potential or separate sale opportunity.
- Versatile building suitable for various uses beyond its current operation as an Agrilife Research & Extension Center, including office, classrooms, auditorium, and shop space.
Financial Insights
Estimated NOI and Cap Rate
NOI / Yr
$303,055
Cap Rate
6.74%
Suggested Prices Based on Cap Rates
Cap Rate 5%
$6,061,100
$6.1M
Cap Rate 7%
$4,329,357
$4.3M
Cap Rate 9%
$3,367,278
$3.4M
Market Conditions
NOI Build-Up for 26,410 SF
Gross rent
$475.4K $18.00/SF
− Vacancy
−$71.3K −$2.70/SF
EGI
$404.1K $15.30/SF
− OpEx
−$101.0K −$3.82/SF
NOI
$303.1K $11.48/SF
Area
Amarillo, TX
Vacancy
15.00%
Lease Rate
$18.00 /SF/Yr
Expense Ratio
25.00%
Simulate Cap Rate and NOI
Suggested Prices Based on Cap Rates
Cap Rate 5%
$6,061,100
Cap Rate 7%
$4,329,357
Cap Rate 9%
$3,367,278
Alternative Uses
Best Use
Office B
$4.33M
$3.79M – $5.05M
NOI $303,055 @ 7.0% cap · market cap 6.74%
Second Best
—
—
no second resolved use
Theoretical Best
Office A
$5.90M
$5.16M – $6.88M
NOI $412,757 @ 7.0% cap · market cap 9.18%
Zoning and permitted uses should be independently verified with authorities.
How Realmo checks its estimates
Property Analytics
Unlock full access to Insights
Subscribe to Realmo Intelligence
Open Analytics
Current Use
Location Intelligence
Trade Area within ½ mile
1,364
Businesses Nearby
Explore this area
Business Placement
Demographics for 79106, TX
27,692
Population
13,385
Households
2.1
Avg Household Size
37
Median Age
24%
College-Educated
87%
High-School Grad
8.6 sq mi
ZIP Area
3,220
Density / Sq Mi
$54,407
Median Household Income
$36,061
Median Earnings
$995
Median Rent
$163,100
Median Home Value
Check the figures for this property
Cap Rate, Value Estimation, Potential NOI and more
View Realmo Analytics
Market
Vacancy Rate% for Office in South region




Frequently Asked Questions
What type of property is this?
Office building - Versatile office building with classrooms, auditorium, and excess land.
Where is this office building located?
The property is located at 6500 Amarillo Blvd West Amarillo, TX.
What is the asking price?
The asking price for this property is $4,495,000.
What are key features of this property?
This property features: Prime location in the Harrington Regional Medical Center, near major hospitals and Texas Tech University Health Sciences Center and School of Veterinary Medicine.; Significant excess land (13.34 acres) offers considerable development potential or separate sale opportunity.; Versatile building suitable for various uses beyond its current operation as an Agrilife Research & Extension Center, including office, classrooms, auditorium, and shop space.


