Brick Flex Space with Industrial
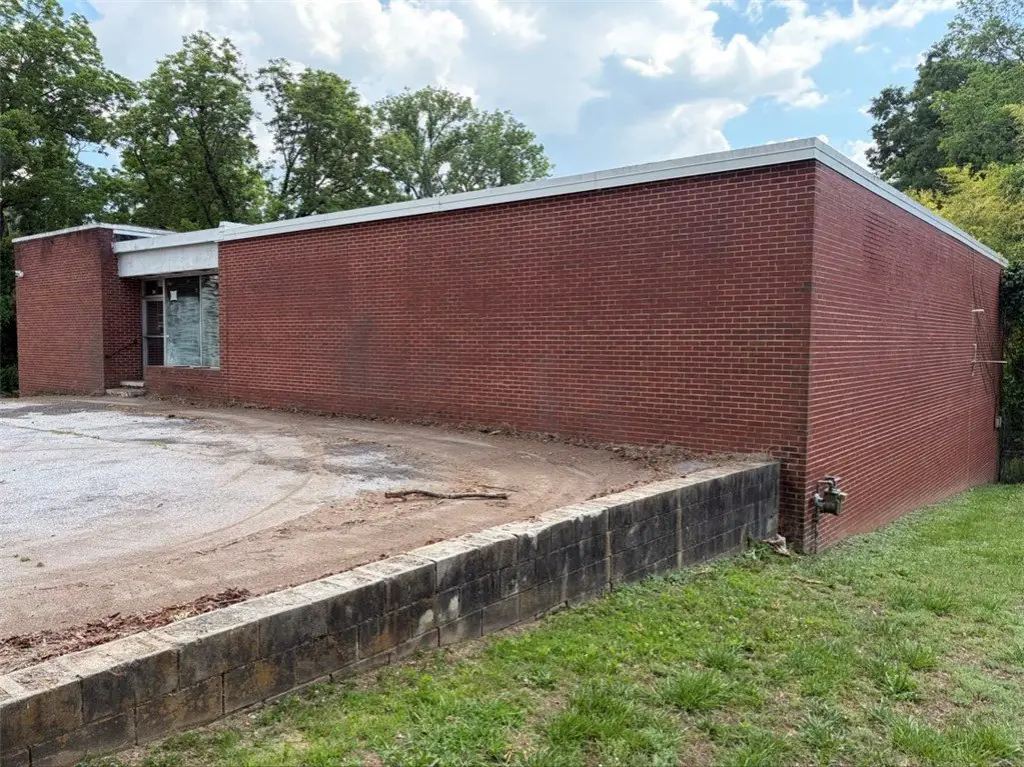
For Sale
$349,000
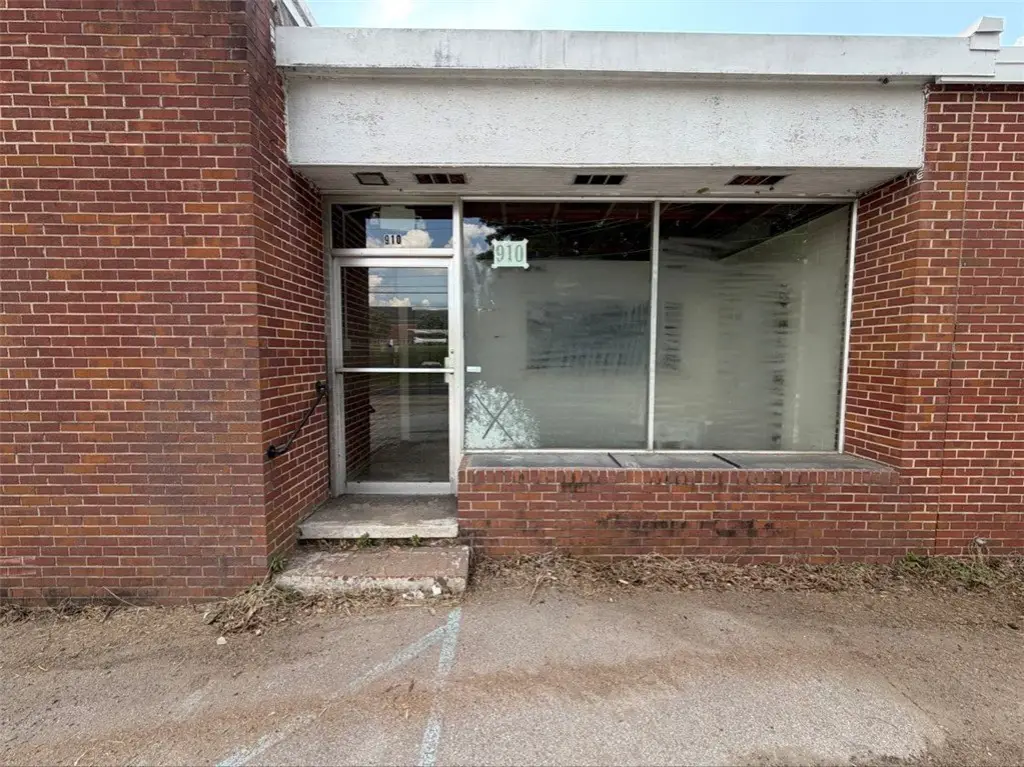
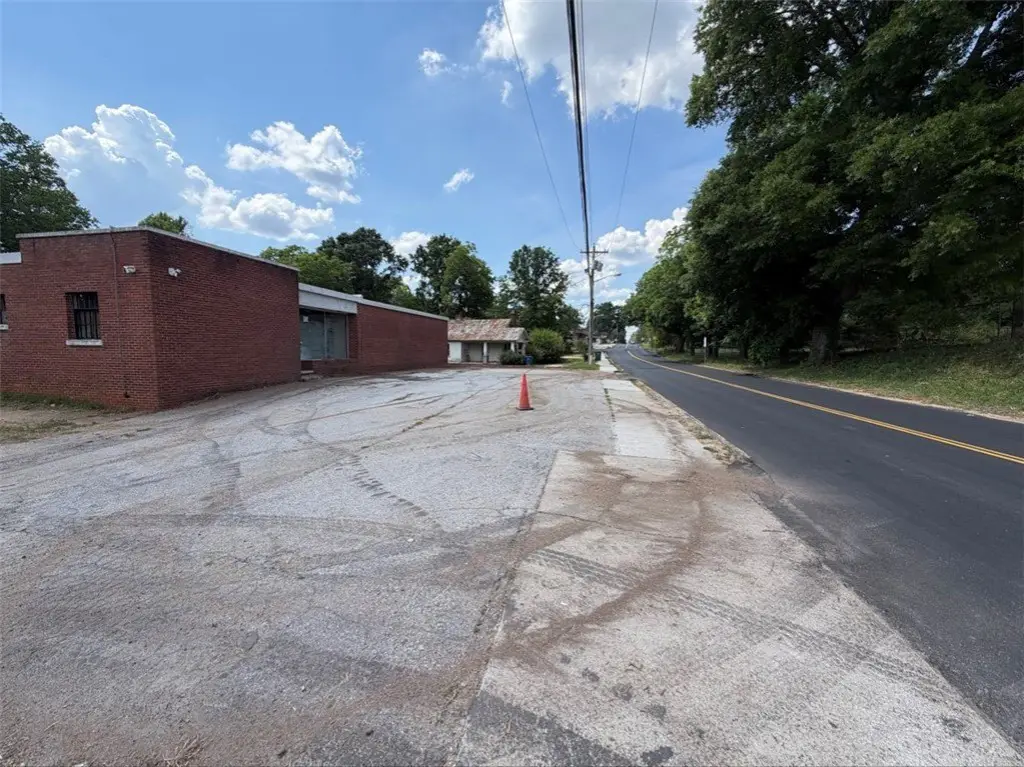
910 Edgefield Street, Greenwood, SC 29646
CommercialSale, Greenwood, SC
Property Size8,200 SF
Lot Size0.95 Acres
Price / SF$42.56
Days on Market145
Property Features for 910 Edgefield Street
General Information
Property type
Commercial Sale
Property subtype
Other
Lot features
City Lot, Level
Directions
USE GPS
Subdivision
520-Greenwood County, SC
Standard status
Active
APN
6845-923-669
Lot size
0.95 Acres
Utilities
Heating system
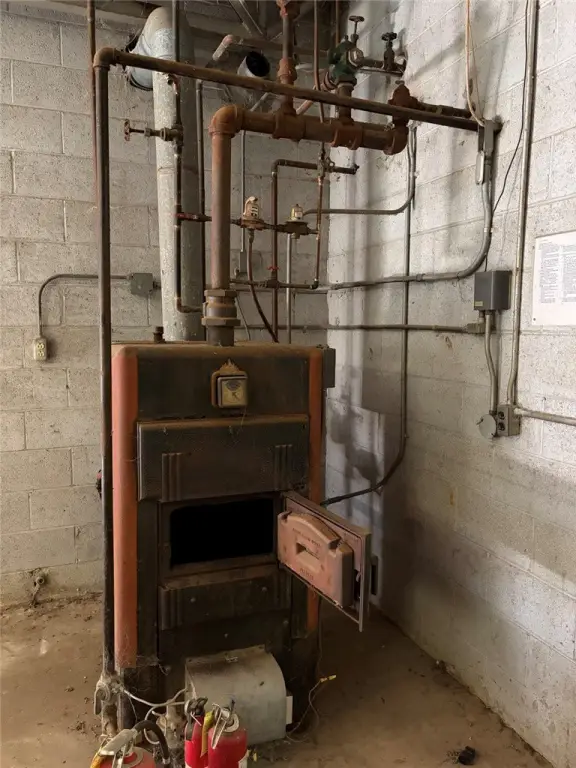
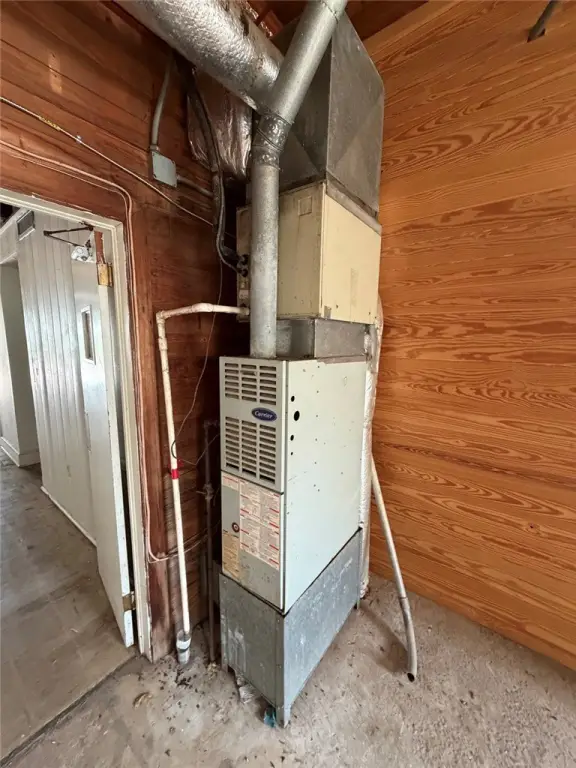
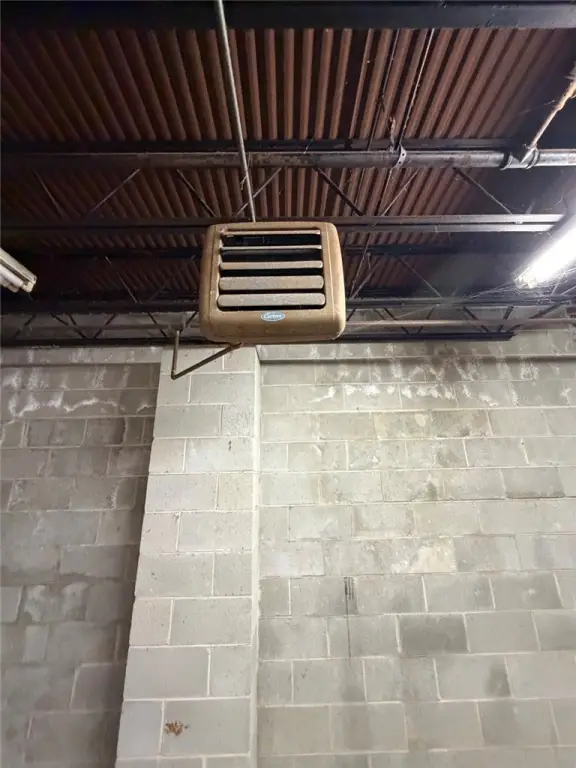
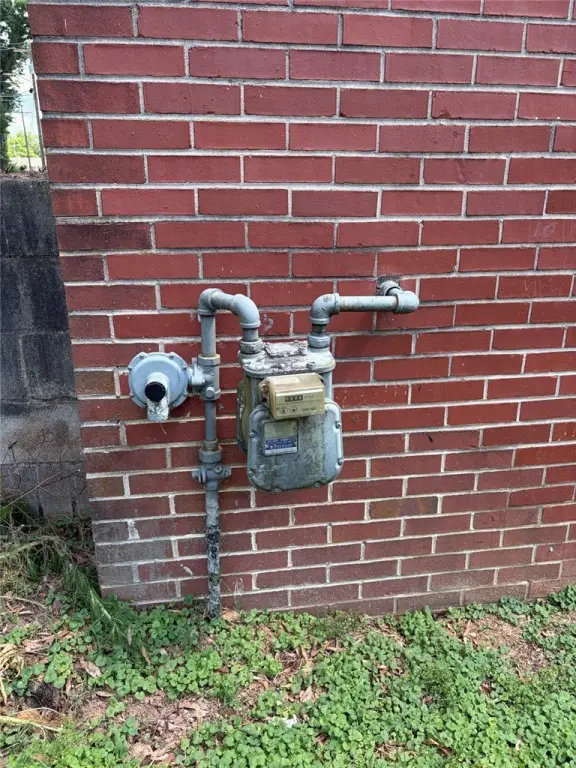
Wood, Natural Gas, Wood Stove, Oil
Cooling system
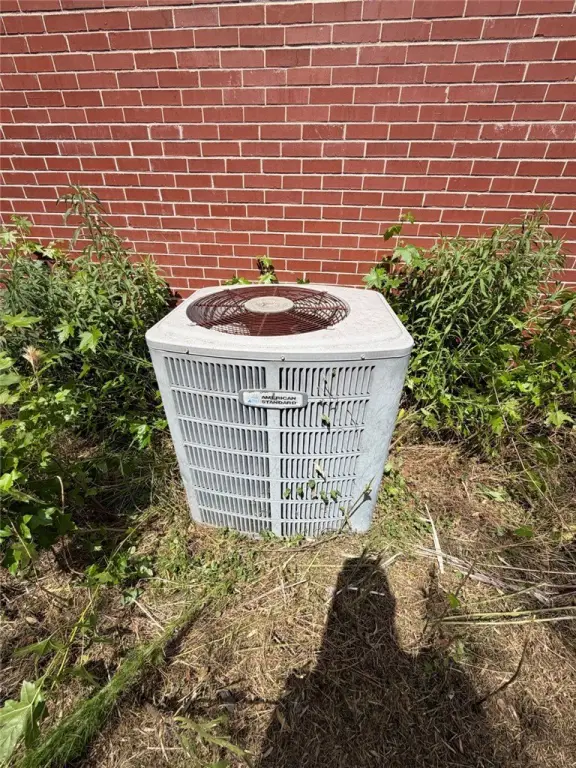
Central Air
Amenities
conference rooms
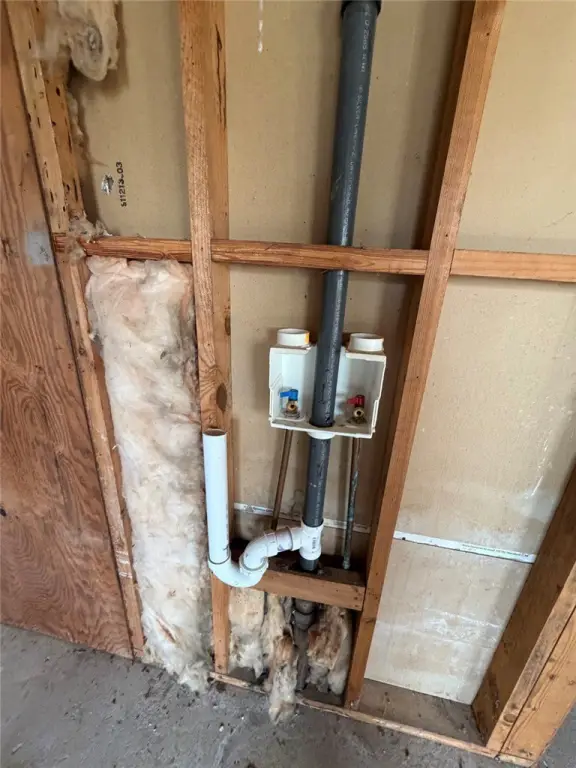
on-site washing station
Building Details
Year built
1955
Floors in Building
2
Flooring type
Concrete
Building materials
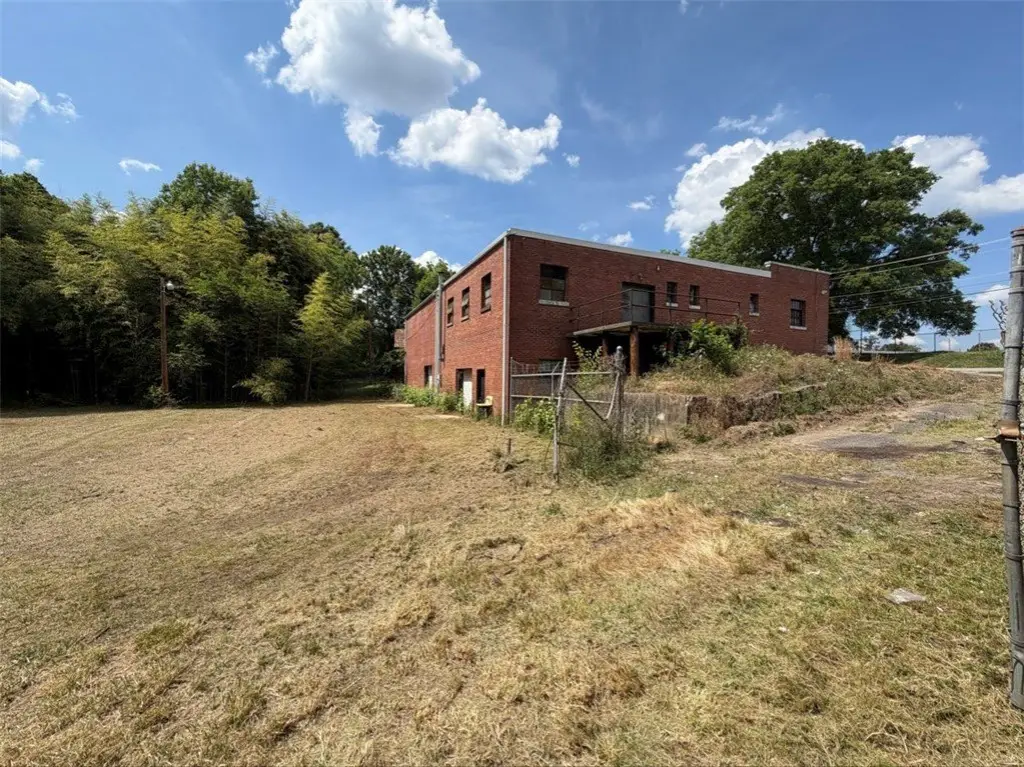
Brick, Block, Concrete
Roof type
Shingle, Composition
Listing Agency:
Epique Realty Inc
(864) 770-5243
Listed By:
Christian Brown · License #147084
(864) 230-3229
Added: May 25
Changed: Oct 14
Last Checked: Oct 16 at 12:06PM
MLS# 20301835
Copyright © 2026 Western Upstate Association of REALTORS®. All rights reserved. All information provided by the listing agent/broker is deemed reliable but is not guaranteed and should be independently verified.

Ask AI about this property
Review the available facts, identify missing information and prepare questions for the agent.
Investment Insights
Based on property information with market context.
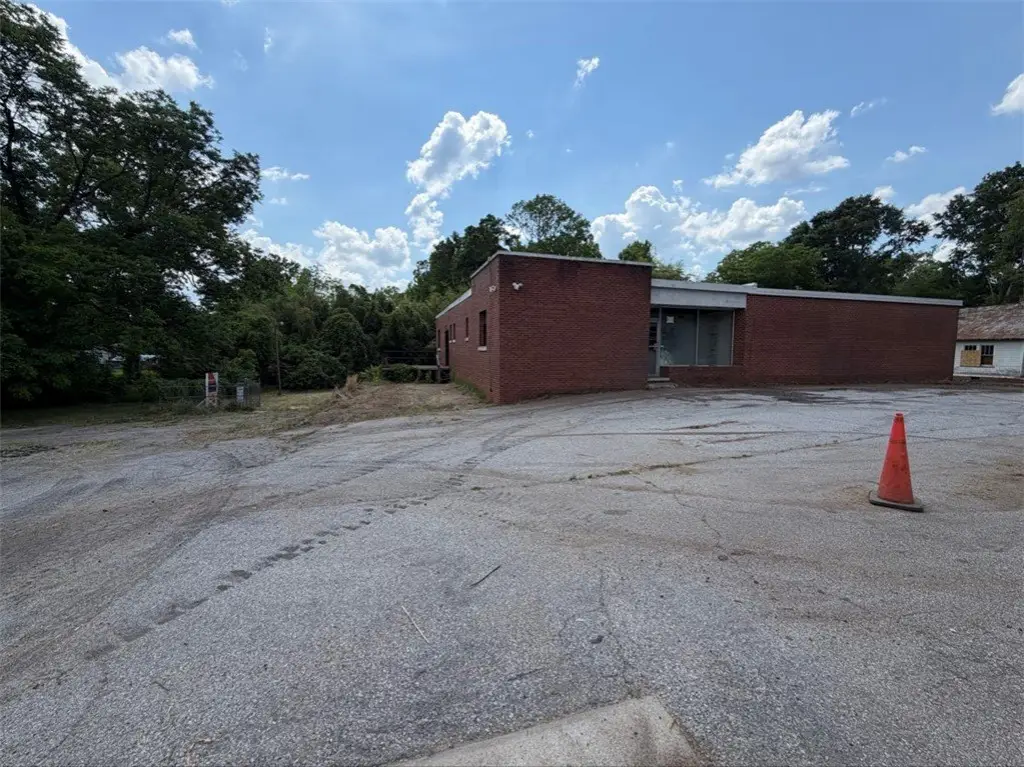
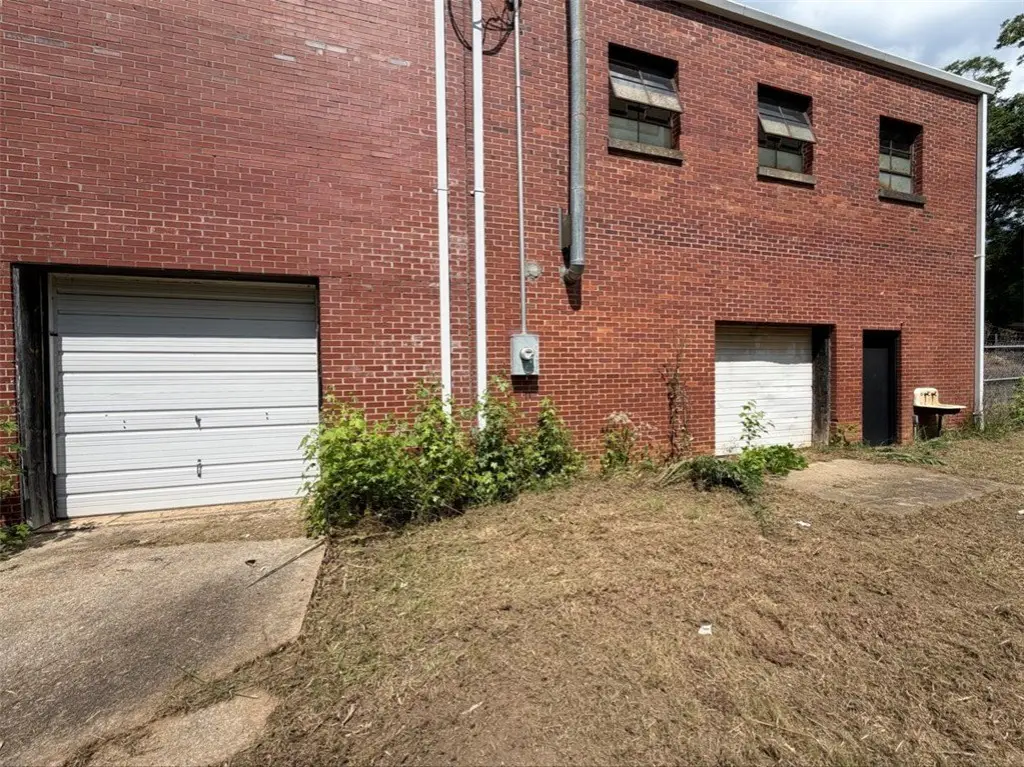
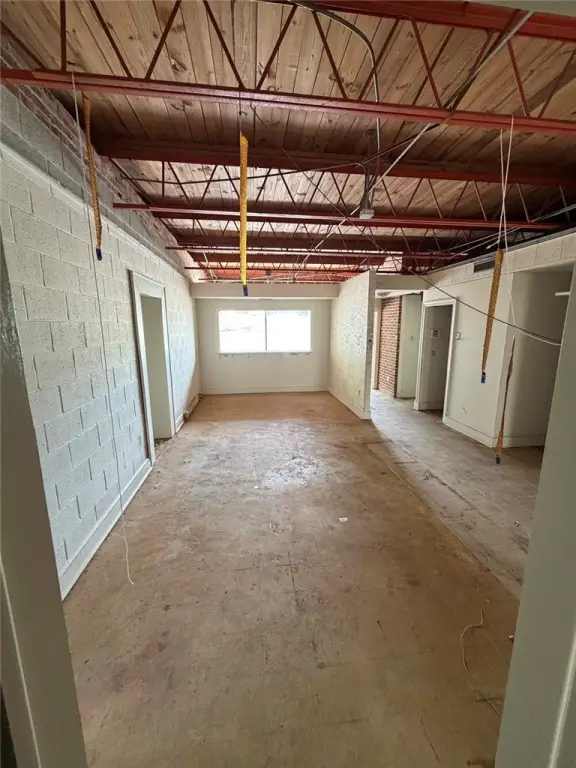
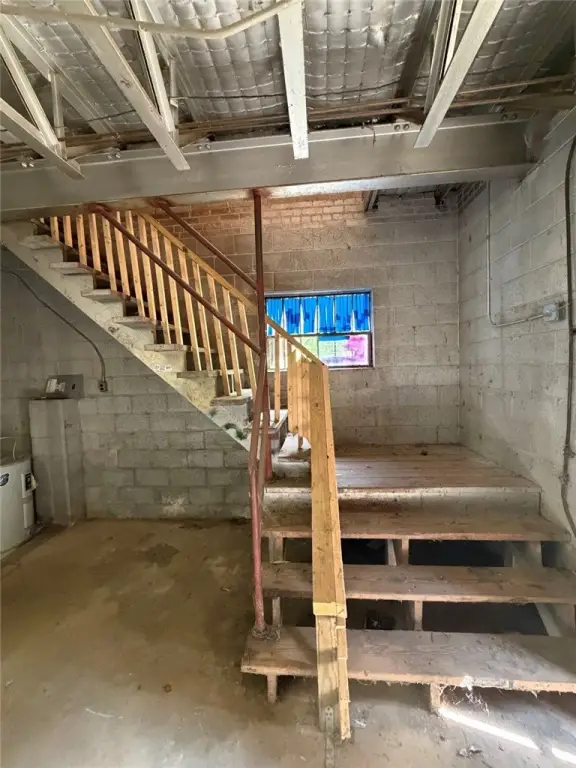
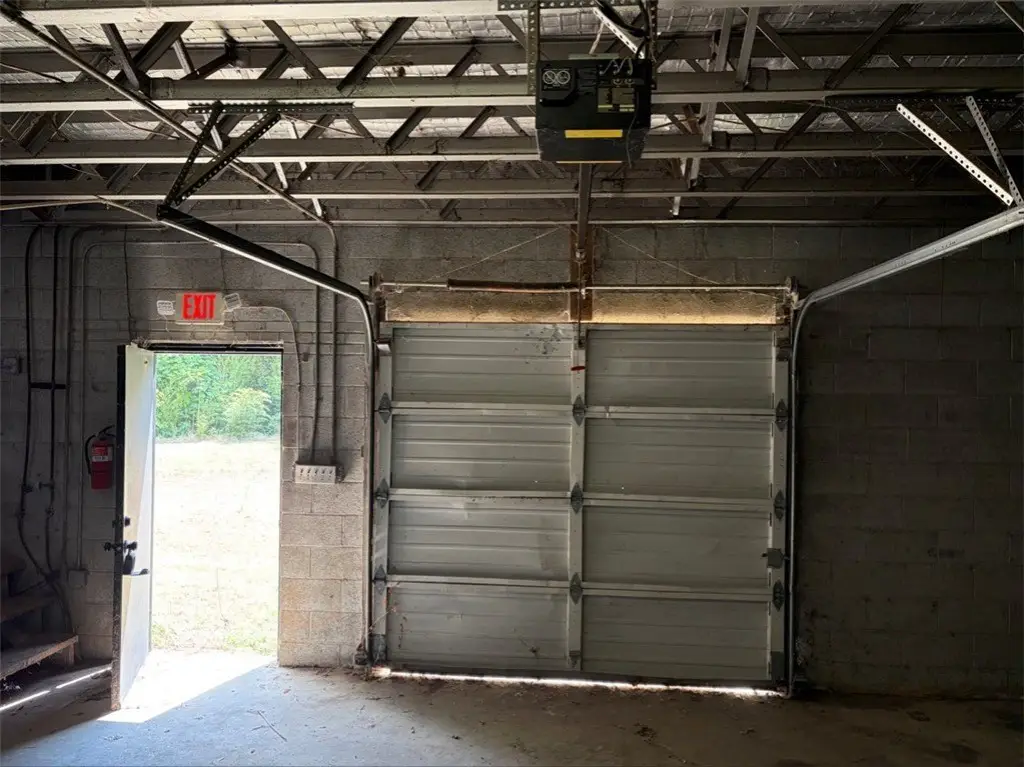
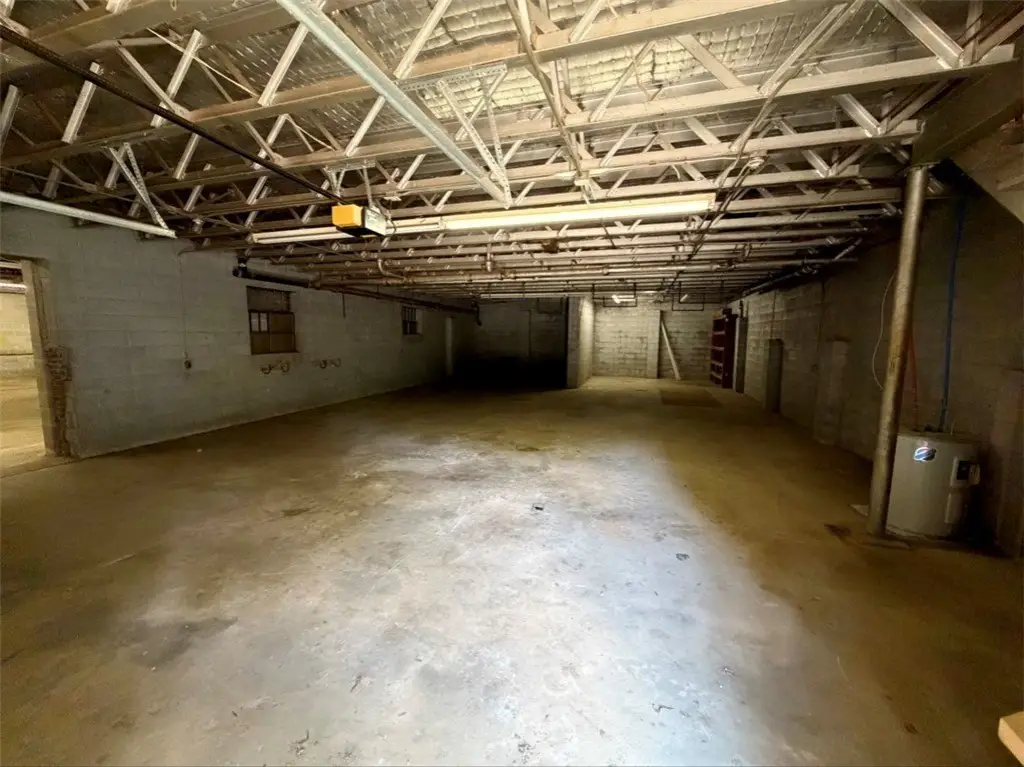
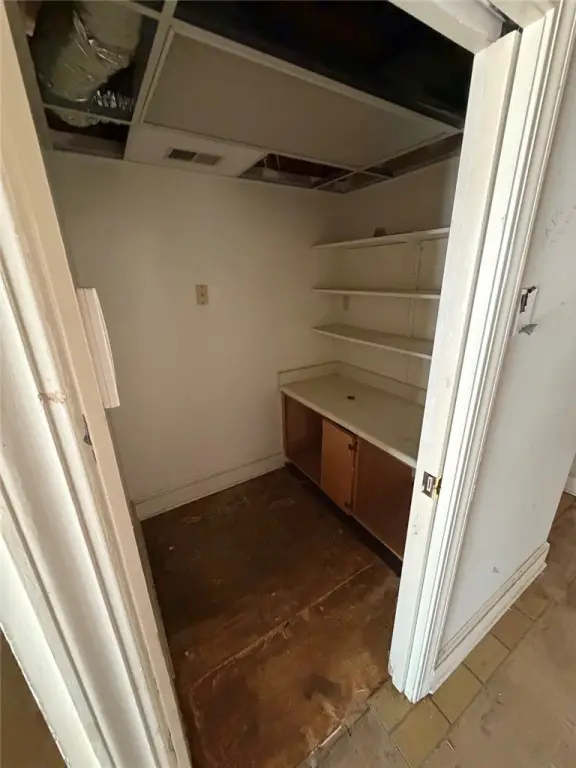
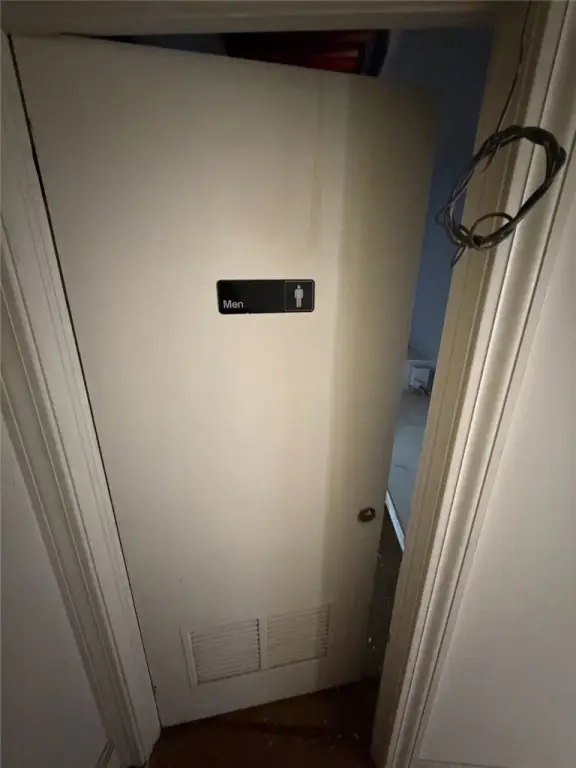
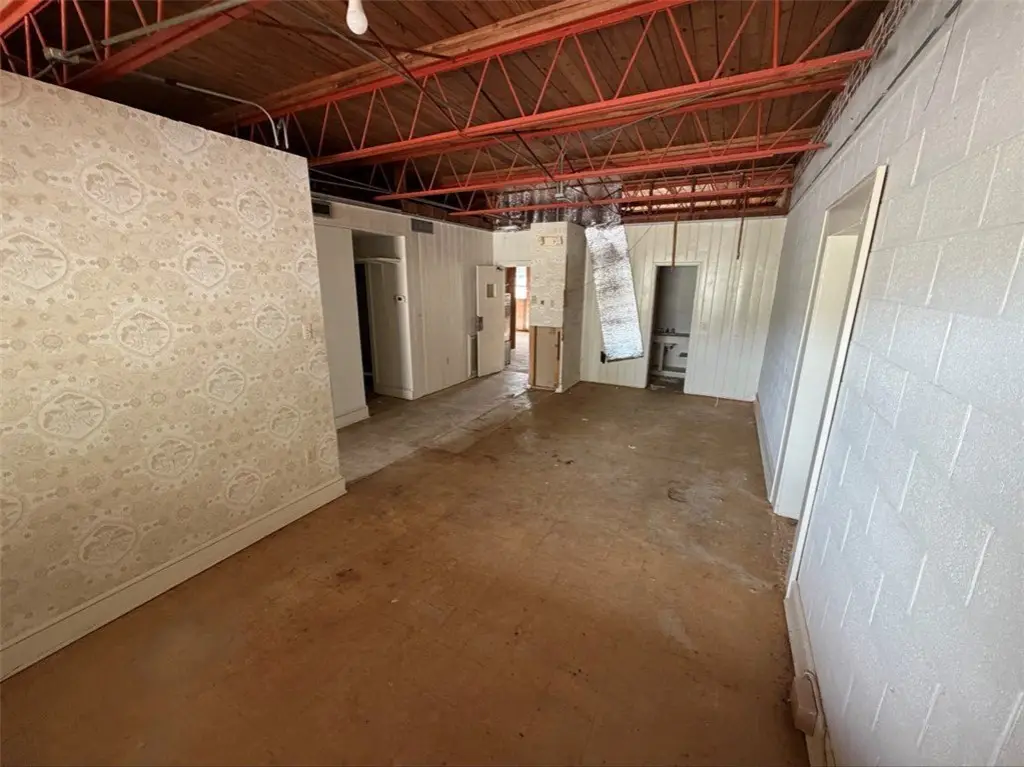
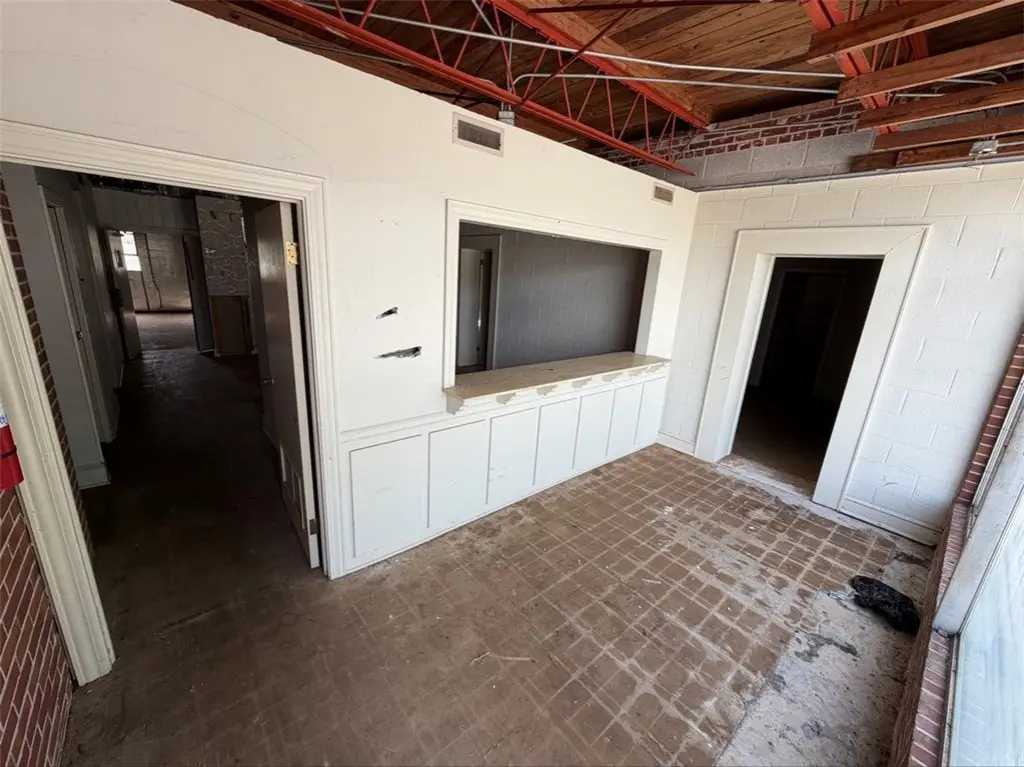
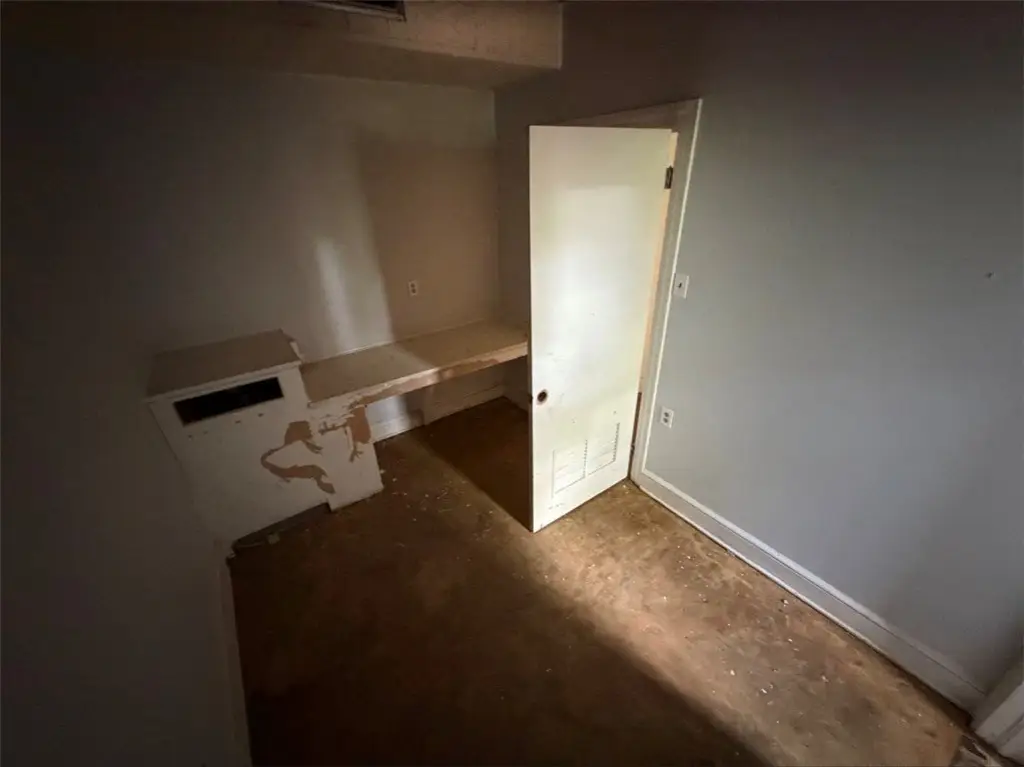
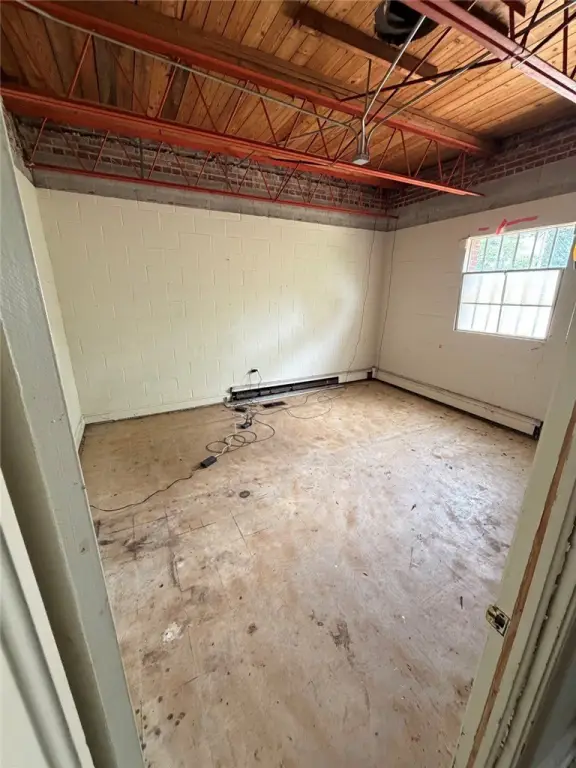
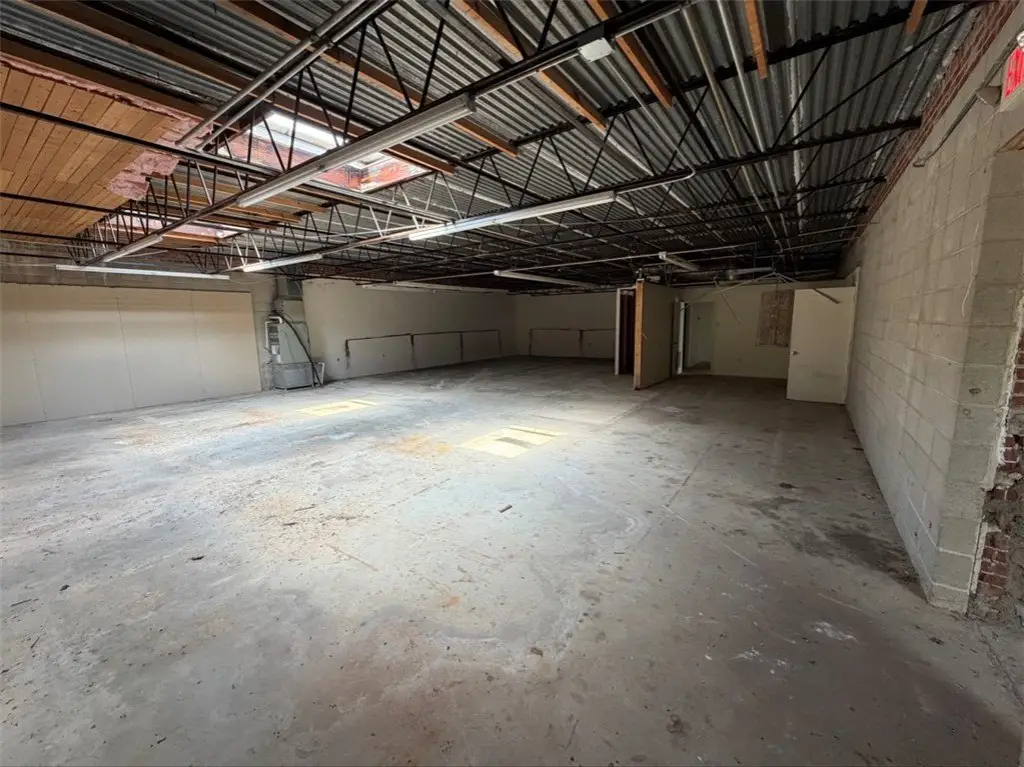
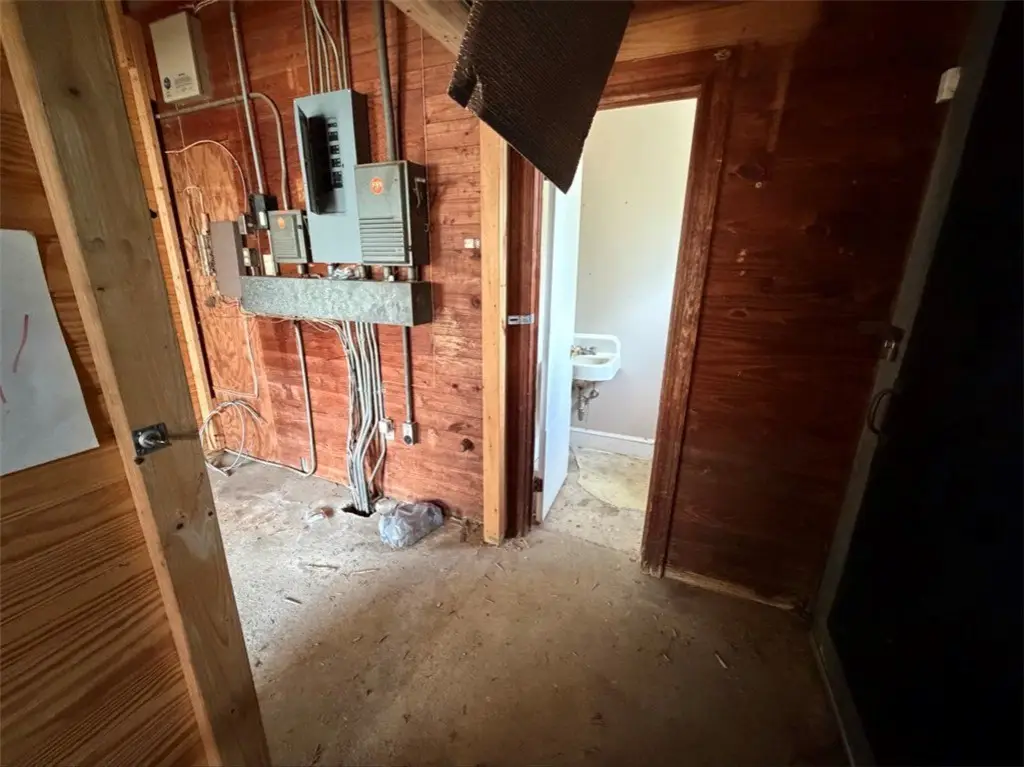
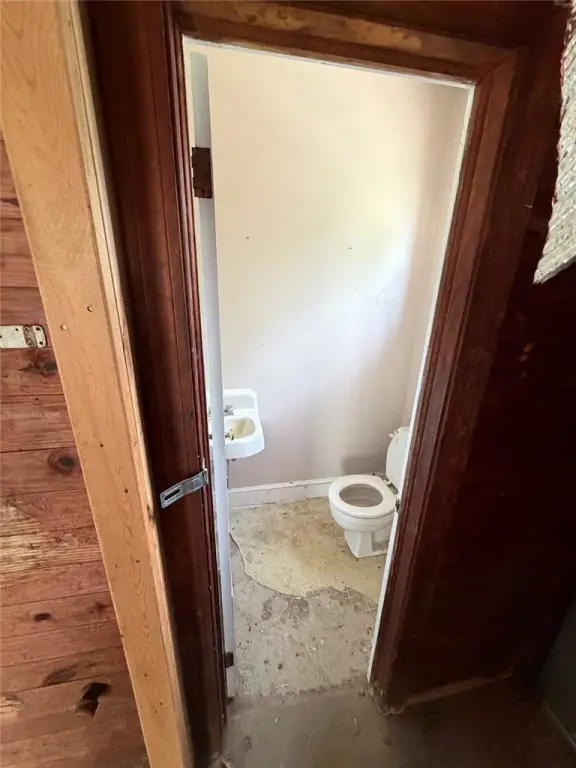
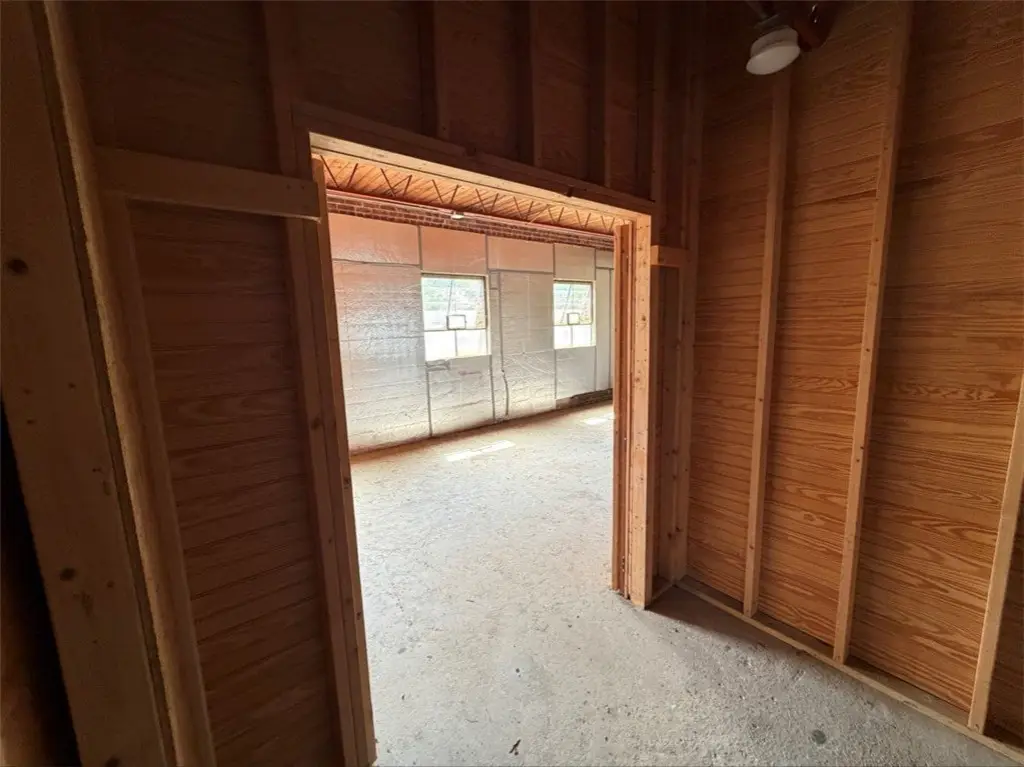
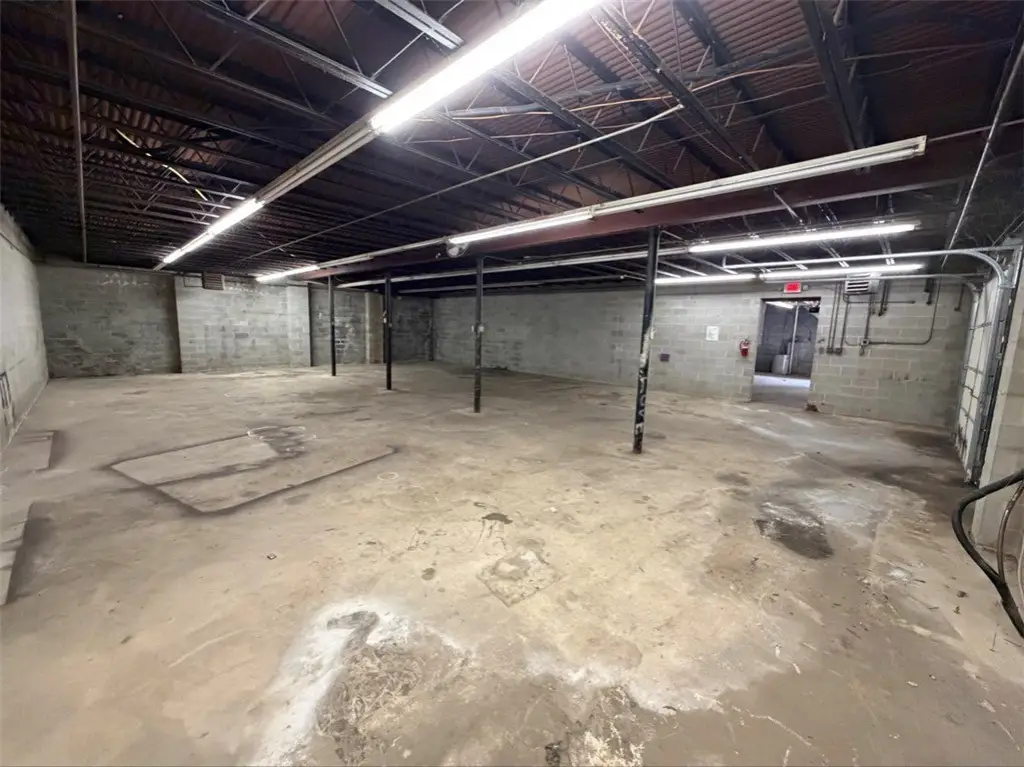
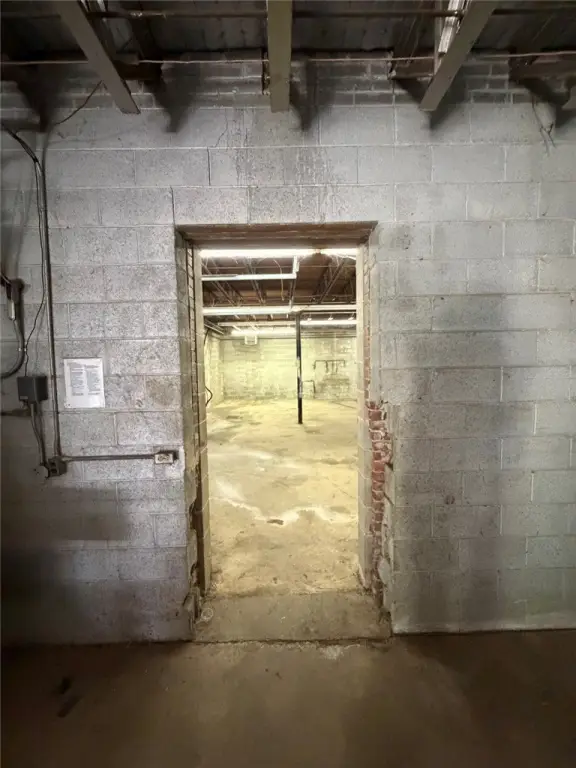
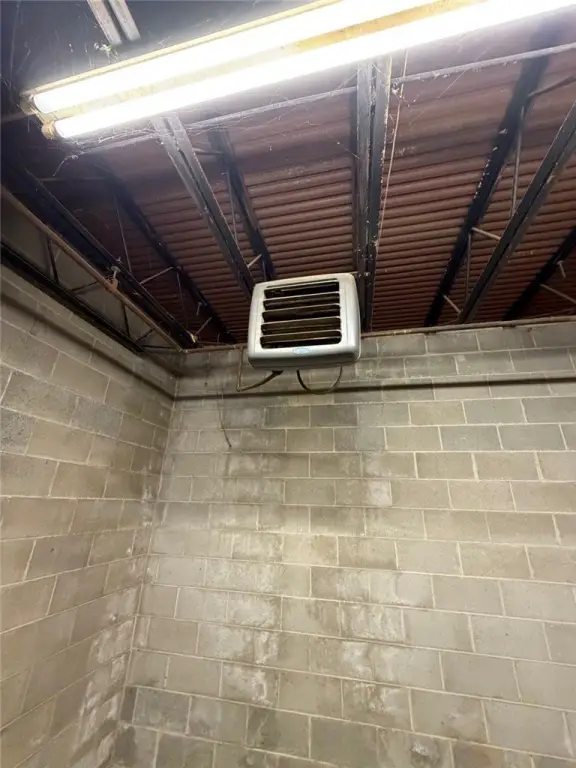
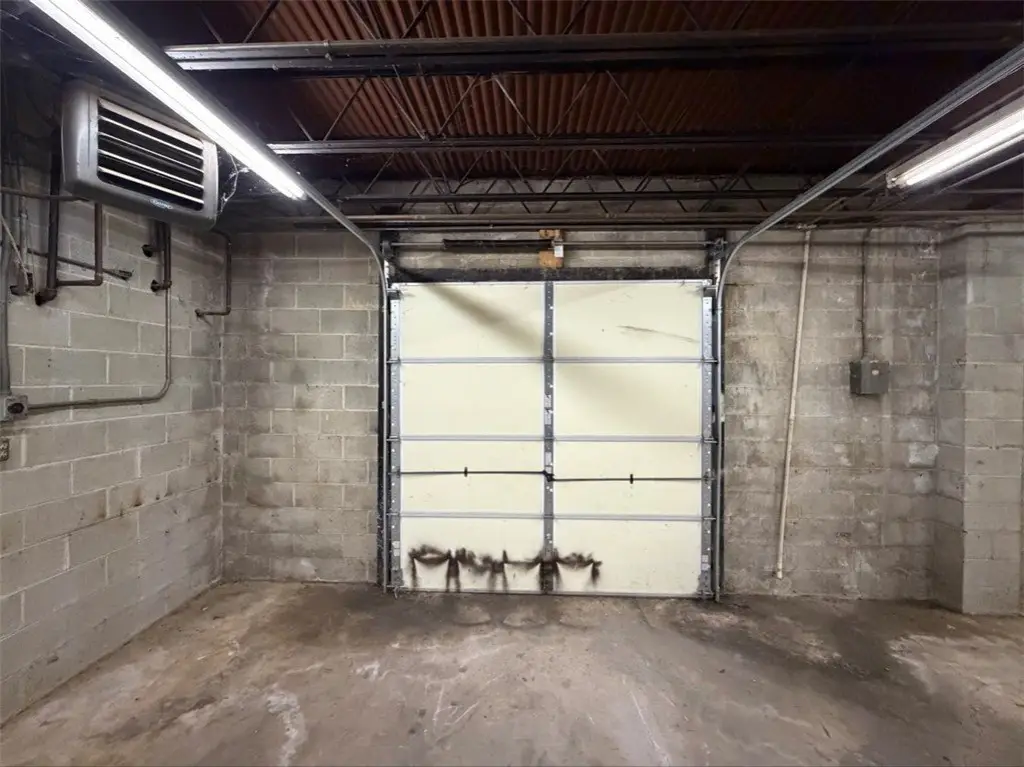
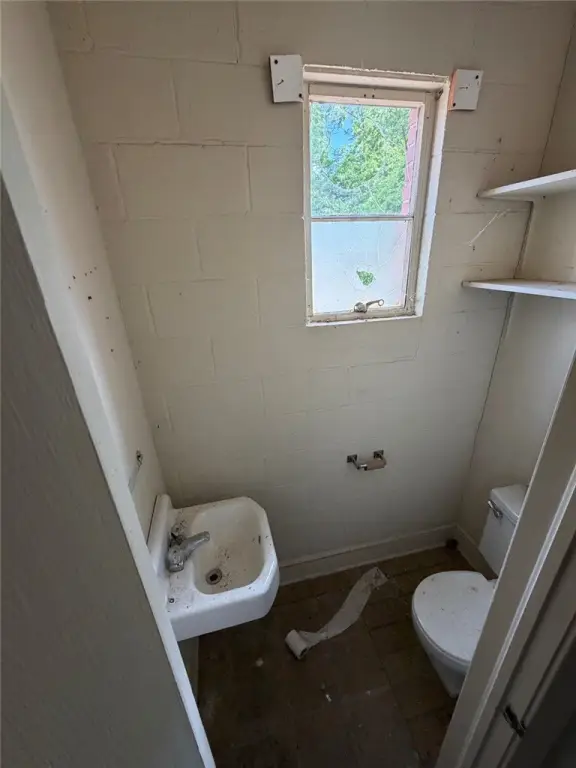
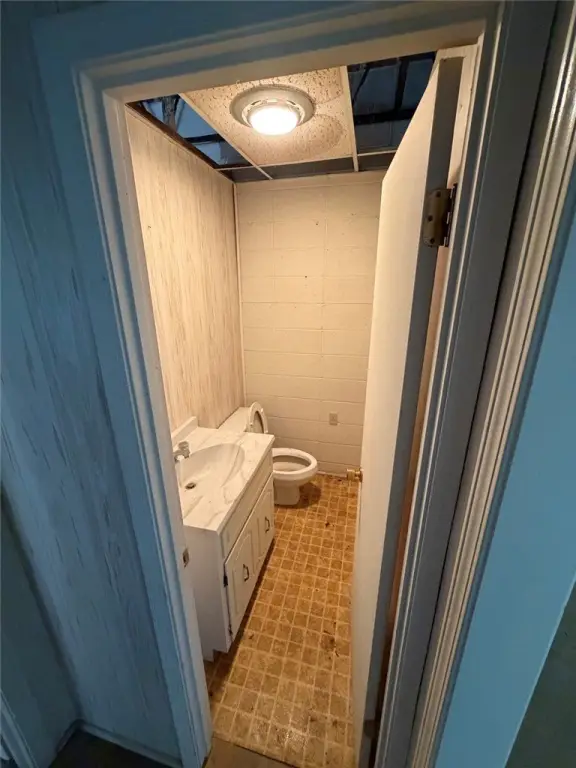
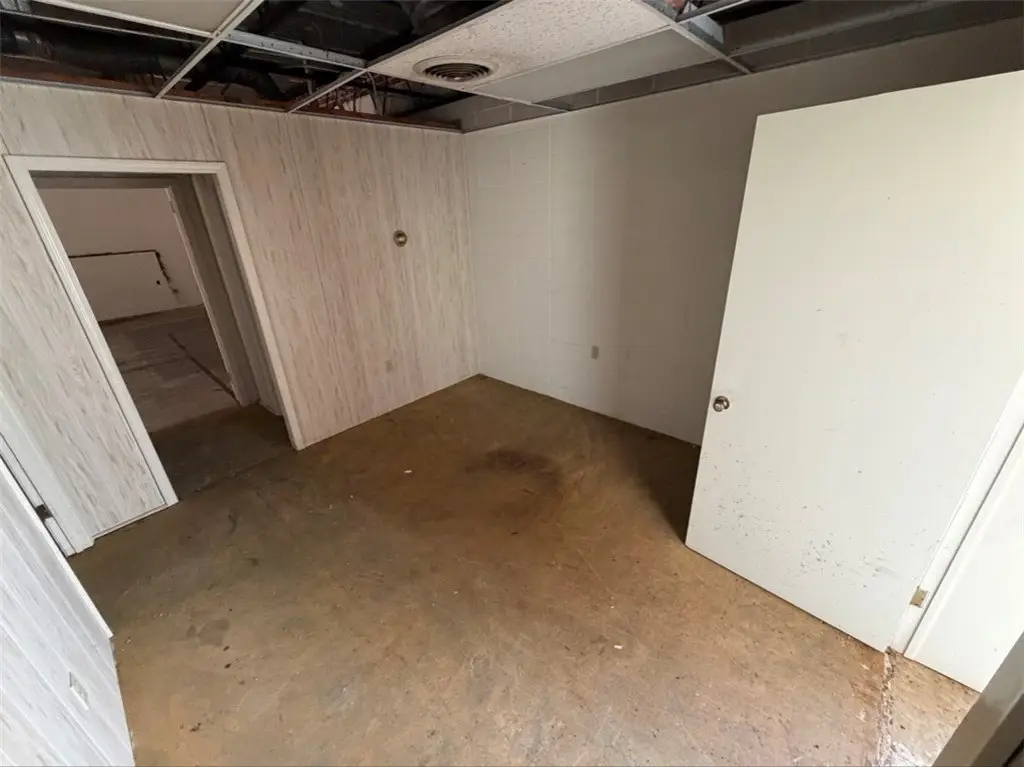
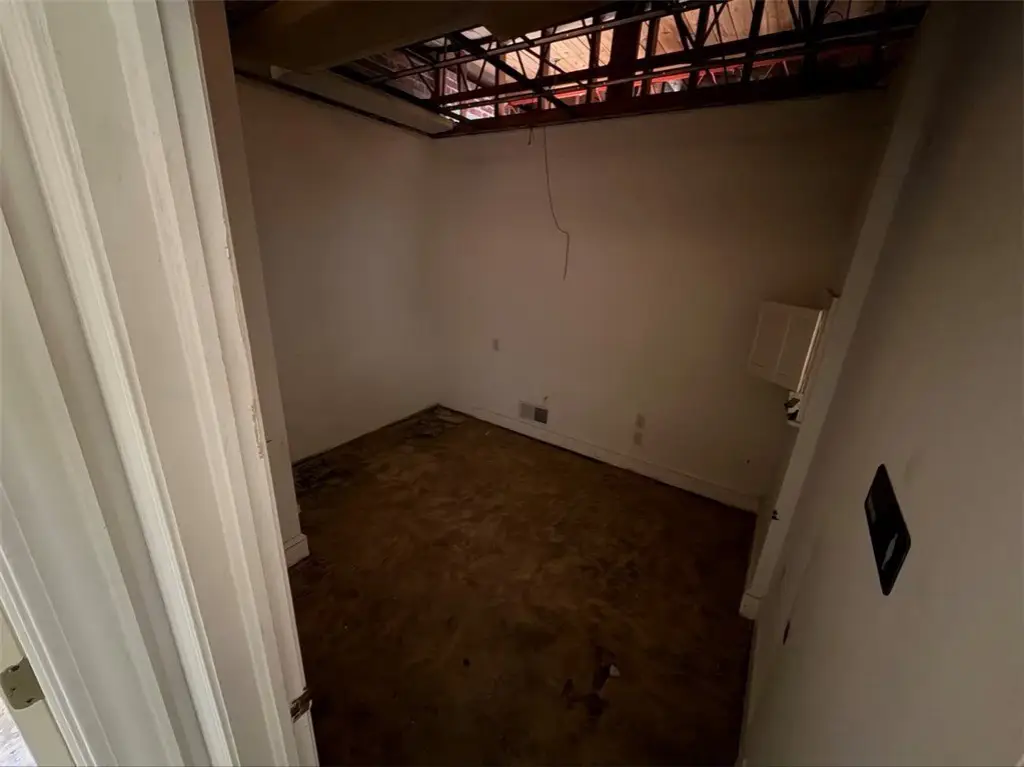
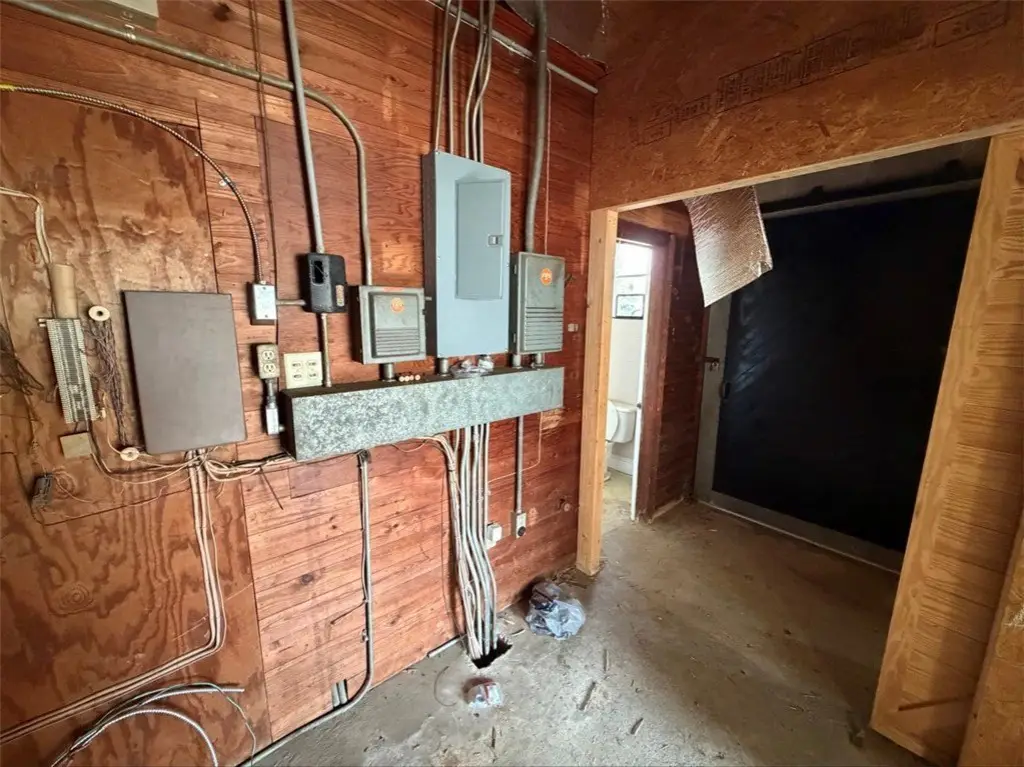
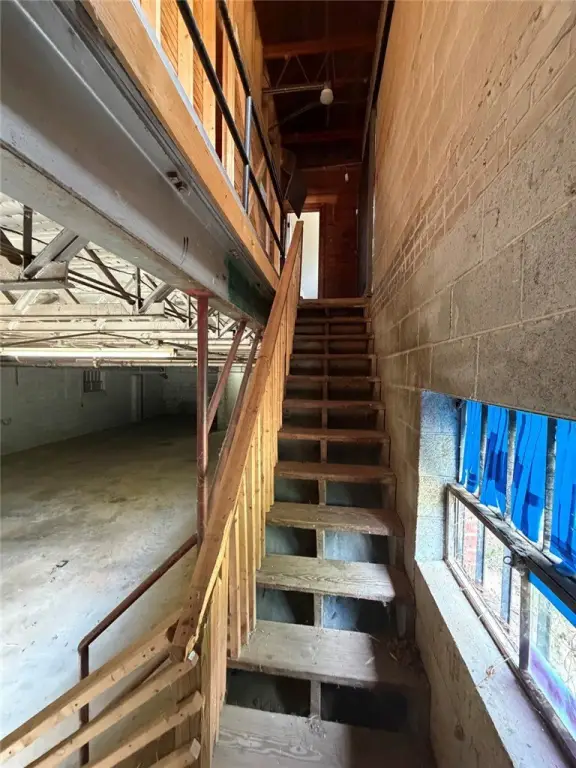
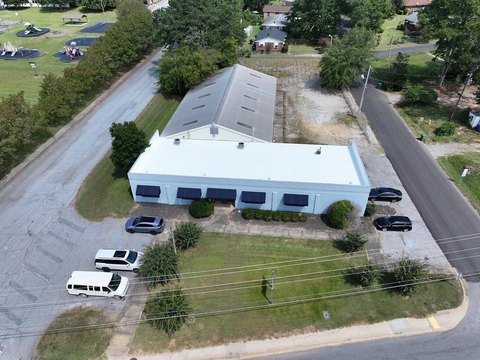
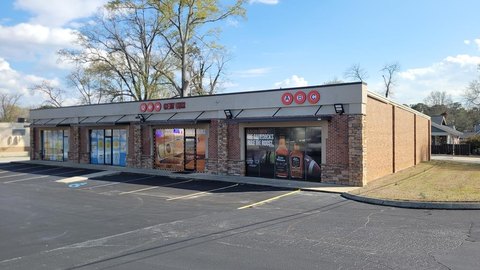
This brick flex space at 910 Edgefield Street is a two-level commercial building with an 8,200 SF total footprint. The upper floor provides 4,100 SF of reception, private offices, conference rooms, storage, and five restrooms. The lower floor contains 4,100 SF of industrial/flex area arranged as two warehouse or workshop bays, with clear-span space and two overhead drive-in doors.
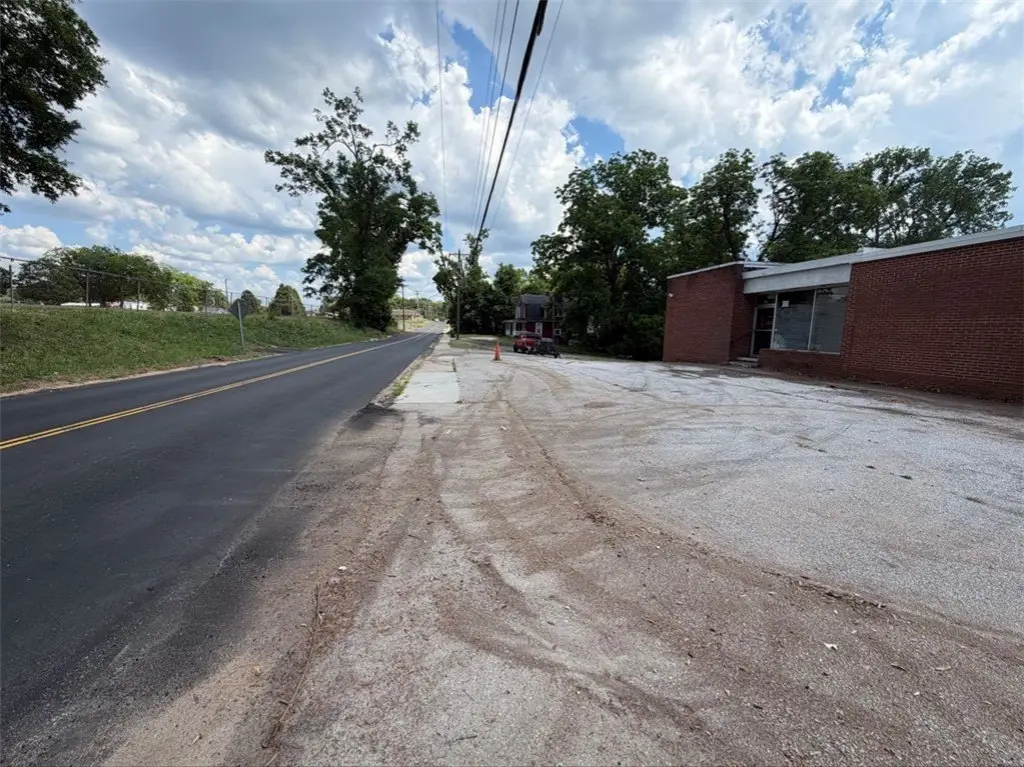
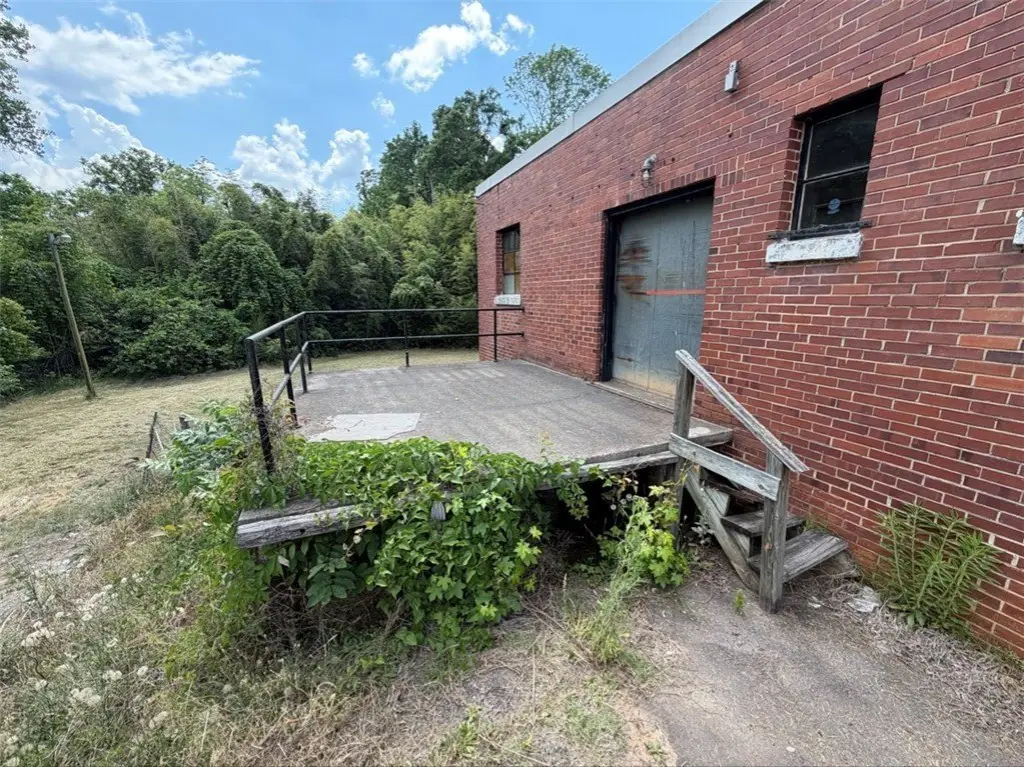
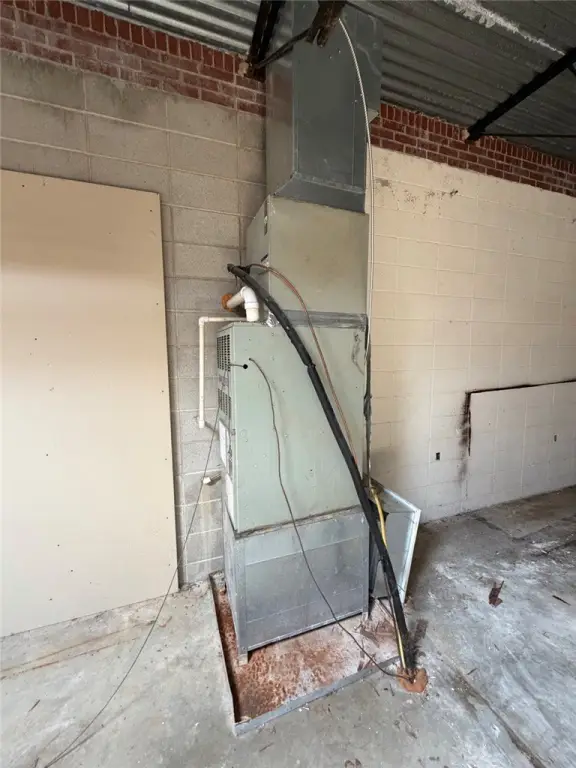
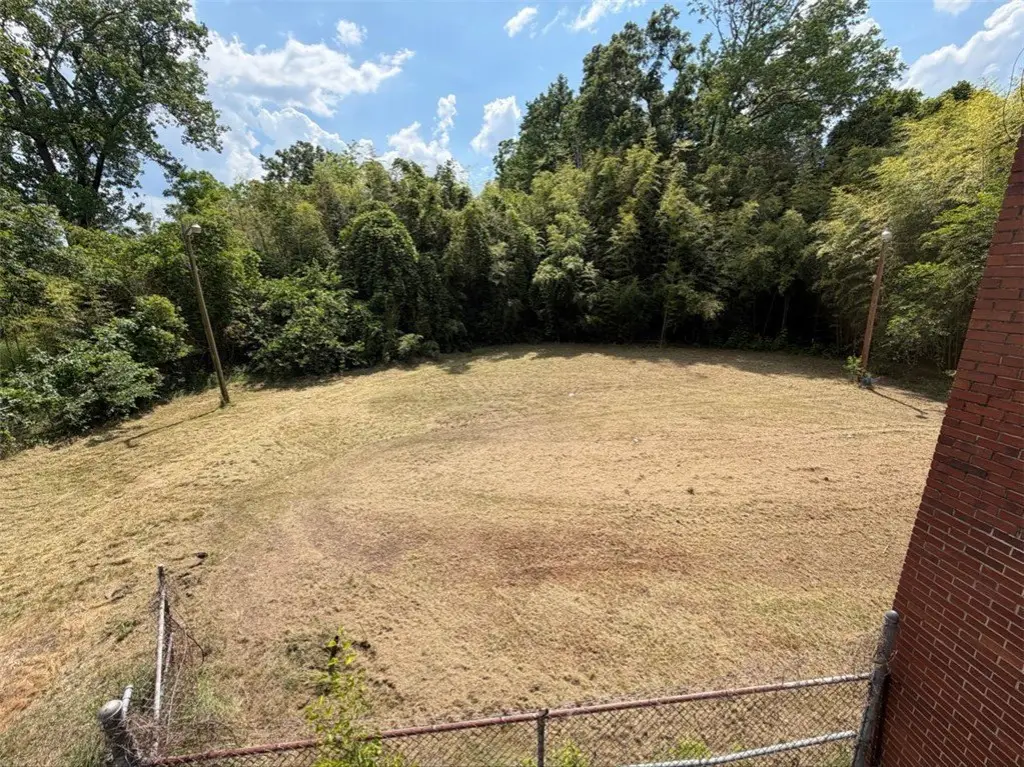
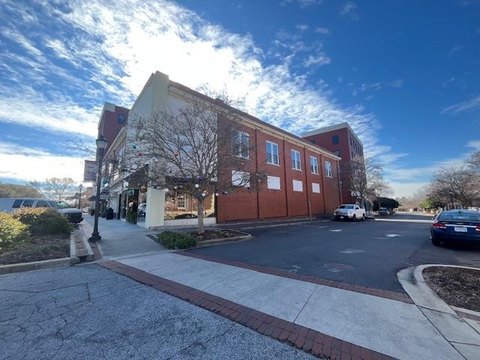
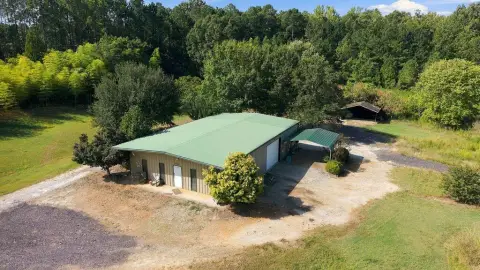
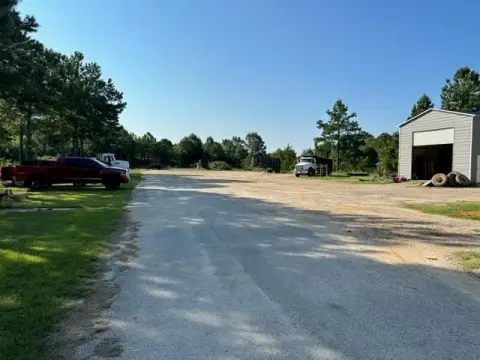
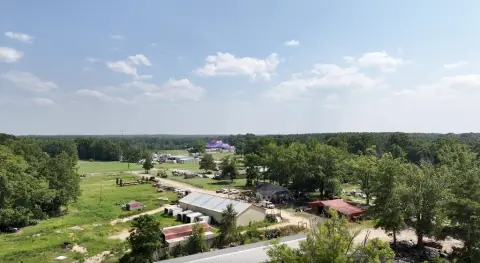
Operational features include a side-loading dock, a fenced 0.25-acre yard with a vehicle and equipment washing station, and dedicated parking. Bay sizes are 1,850 SF and 2,250 SF, and the bays may be occupied together or separately. The property is located on Edgefield Street, just off Main Street in downtown Greenwood, one-half mile north of the hospital. The site reports daily traffic of 4,800+ VPD and includes a 0.95-acre lot.
Operational features include a side-loading dock, a fenced 0.25-acre yard with a vehicle and equipment washing station, and dedicated parking. Bay sizes are 1,850 SF and 2,250 SF, and the bays may be occupied together or separately. The property is located on Edgefield Street, just off Main Street in downtown Greenwood, one-half mile north of the hospital. The site reports daily traffic of 4,800+ VPD and includes a 0.95-acre lot.
Key Highlights
- 8,200 SF split‑level commercial building with office and industrial/flex areas
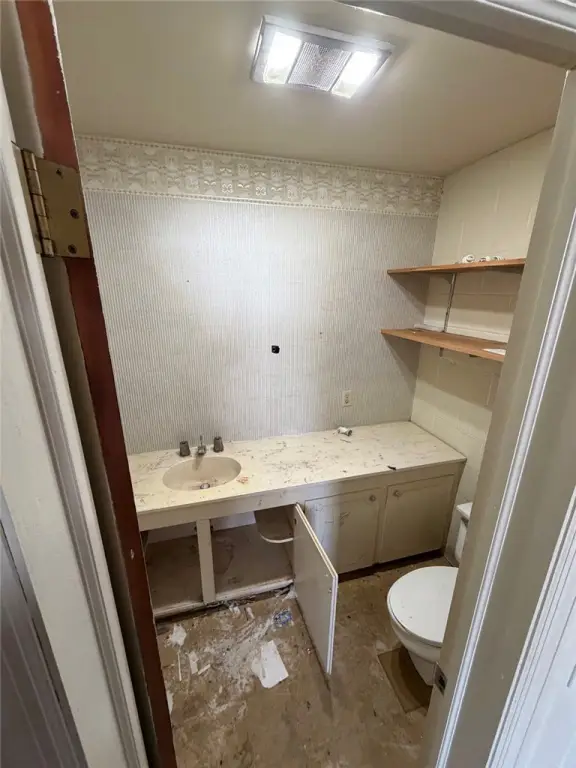
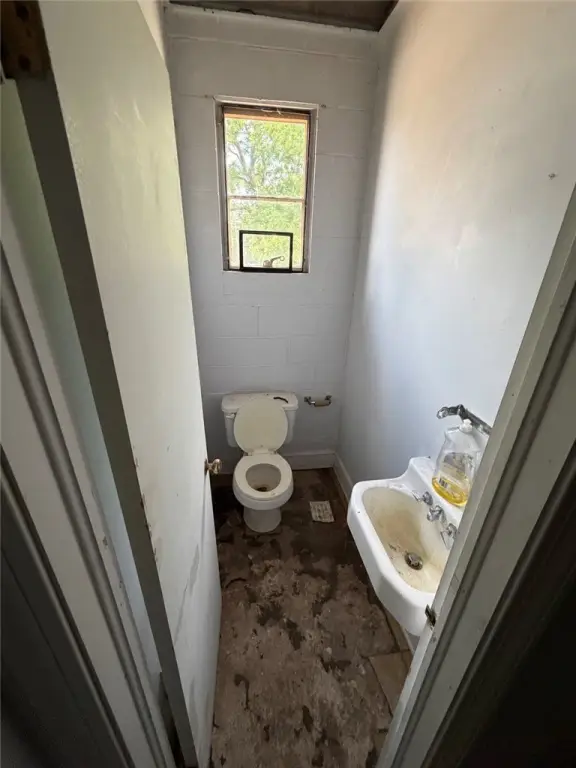
- 4,100 SF upper level with reception, private offices, conference rooms, storage, and 5 restrooms
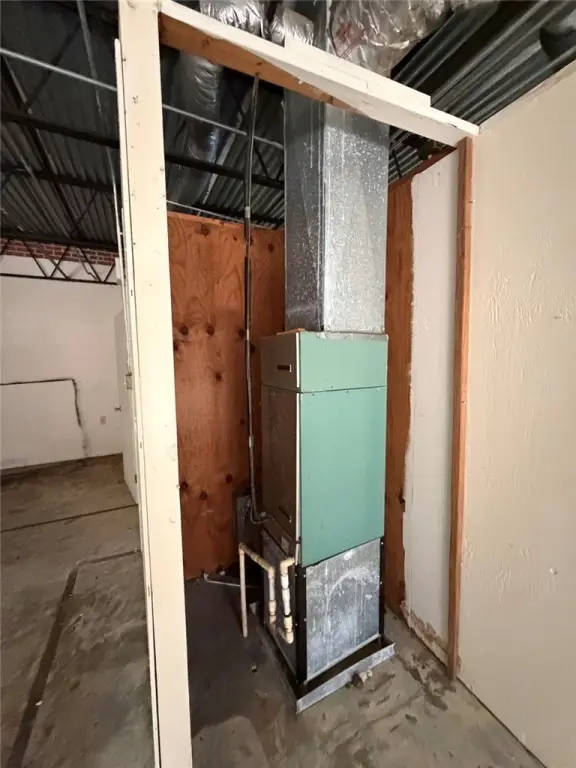
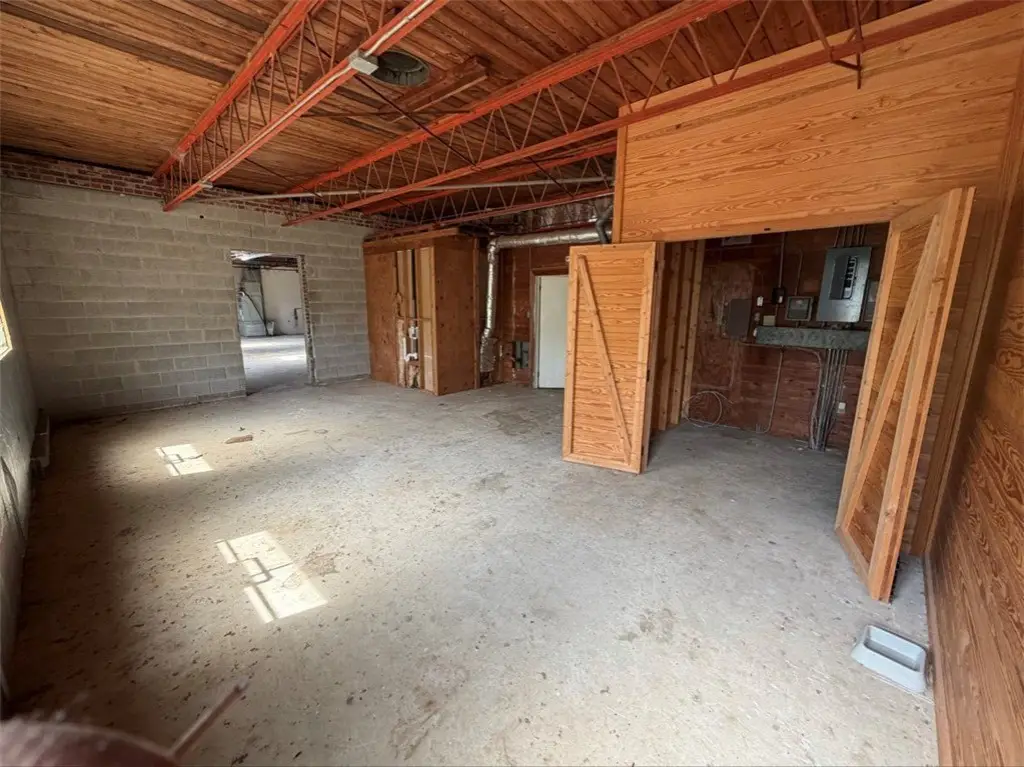
- 4,100 SF lower level with two warehouse/workshop bays and 2 overhead drive‑in doors
Financial Insights
Estimated NOI and Cap Rate
NOI / Yr
$26,012
Cap Rate
7.45%
Suggested Prices Based on Cap Rates
Cap Rate 5%
$520,240
$520.2K
Cap Rate 7%
$371,600
$371.6K
Cap Rate 9%
$289,022
$289.0K
Market Conditions
NOI Build-Up for 8,200 SF
Gross rent
$43.3K $5.28/SF
− Vacancy
−$3.3K −$0.40/SF
EGI
$40.0K $4.88/SF
− OpEx
−$14.0K −$1.71/SF
NOI
$26.0K $3.17/SF
Area
Greenwood County, SC
Vacancy
7.57%
Lease Rate
$5.28 /SF/Yr
Expense Ratio
35.00%
Simulate Cap Rate and NOI
Suggested Prices Based on Cap Rates
Cap Rate 5%
$520,240
Cap Rate 7%
$371,600
Cap Rate 9%
$289,022
Alternative Uses
Best Use
Office B
$2.00M
$1.75M – $2.33M
NOI $139,920 @ 7.0% cap · market cap 40.09%
Second Best
Warehouse
$837.9K
$733.2K – $977.6K
NOI $58,653 @ 7.0% cap · market cap 16.81%
Theoretical Best
Office A
$2.58M
$2.25M – $3.01M
NOI $180,316 @ 7.0% cap · market cap 51.67%
Zoning and permitted uses should be independently verified with authorities.
How Realmo checks its estimates
Property Analytics
Unlock full access to Insights
Subscribe to Realmo Intelligence
Open Analytics
Current Use
Lease Details
1
Dock-high doors
2
Drive-in doors
Multi-tenant
Tenancy
Yes
Fenced yard
Yes
Paved road access
Location Intelligence
Trade Area within ½ mile
1,057
Businesses Nearby
Balanced
Demand for This Use
Explore this area
Business Placement
Demographics for 29646, SC
26,783
Population
12,316
Households
2.2
Avg Household Size
40
Median Age
20%
College-Educated
84%
High-School Grad
101.4 sq mi
ZIP Area
264
Density / Sq Mi
$41,669
Median Household Income
$37,556
Median Earnings
$818
Median Rent
$130,900
Median Home Value
Check the figures for this property
Cap Rate, Value Estimation, Potential NOI and more
View Realmo Analytics
Market
Vacancy Rate% for Office in South region



Frequently Asked Questions
What type of property is this?
Flex space - Split-level commercial building combines client-facing offices, warehouse bays, drive-in access, and secured outdoor storage.
Where is this flex space located?
The property is located at 910 Edgefield Street Greenwood, SC.
What is the asking price?
The asking price for this property is $349,000.
What are key features of this property?
This property features: 8,200 SF split‑level commercial building with office and industrial/flex areas; 4,100 SF upper level with reception, private offices, conference rooms, storage, and 5 restrooms; 4,100 SF lower level with two warehouse/workshop bays and 2 overhead drive‑in doors


