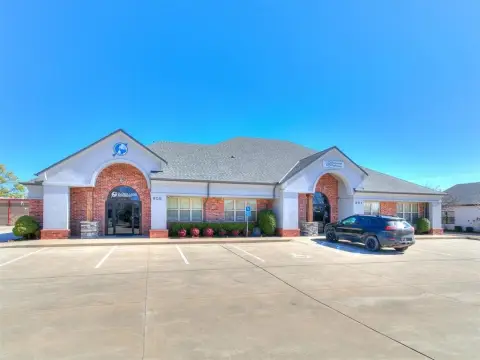
Two-Suite Office
For Sale
$1,150,000
909-901 Wall St, Norman, OK 73069
Partially occupied office property with one suite available for immediate occupancy and on-site parking.
Property Size5,031 SF
Price / SF$228.58
Days on Market243
Property Features for 909-901 Wall St
General Information
Standard status
Active
Size
5,031 SF
Listing Agency:
828 Real Estate LLC
(405) 701-8881
Listed By:
Chrystal Raprich
(405) 590-5863
Source:
Exprealty
Added: Feb 16
Changed: Oct 6
Last Checked: Oct 16 at 2:25PM
Displayed information is deemed reliable but is not guaranteed and should be independently verified. All listing content including descriptions, pricing, images are the copyrighted material of 828 Real Estate LLC

Ask AI about this property
Review the available facts, identify missing information and prepare questions for the agent.
Investment Insights
Based on property information with market context.
This 5,031-square-foot office building is configured as two separate suites. Suite 901 is leased and includes annual rent escalations through April 2029, while Suite 909 is vacant and available for immediate occupancy. The layout supports professional office use and gives an owner-user the ability to occupy one suite while retaining an in-place tenant in the other.
The property includes on-site parking and is positioned off 24th Ave SW in an established Norman business area. Major roadways, retail, and services are located nearby, supporting convenient access for employees, clients, and visitors. The 909-901 Wall St configuration combines existing occupancy with additional usable office space.
The property includes on-site parking and is positioned off 24th Ave SW in an established Norman business area. Major roadways, retail, and services are located nearby, supporting convenient access for employees, clients, and visitors. The 909-901 Wall St configuration combines existing occupancy with additional usable office space.
Key Highlights
- 5,031‑square‑foot office building with two separate suites
- Suite 901 is occupied under a lease with annual escalations through April 2029
- Suite 909 is vacant and ready for immediate occupancy
Financial Insights
Estimated NOI and Cap Rate
NOI / Yr
$42,668
Cap Rate
3.71%
Suggested Prices Based on Cap Rates
Cap Rate 5%
$853,360
$853.4K
Cap Rate 7%
$609,543
$609.5K
Cap Rate 9%
$474,089
$474.1K
Market Conditions
NOI Build-Up for 5,031 SF
Gross rent
$76.7K $15.24/SF
− Vacancy
−$19.8K −$3.93/SF
EGI
$56.9K $11.31/SF
− OpEx
−$14.2K −$2.83/SF
NOI
$42.7K $8.48/SF
Area
Norman, OK
Vacancy
25.80%
Lease Rate
$15.24 /SF/Yr
Expense Ratio
25.00%
Simulate Cap Rate and NOI
Suggested Prices Based on Cap Rates
Cap Rate 5%
$853,360
Cap Rate 7%
$609,543
Cap Rate 9%
$474,089
Alternative Uses
Best Use
Office B
$609.5K
$533.4K – $711.1K
NOI $42,668 @ 7.0% cap · market cap 3.71%
Second Best
—
—
no second resolved use
Theoretical Best
Specialty Retail
$869.4K
$760.7K – $1.01M
NOI $60,855 @ 7.0% cap · market cap 5.29%
Zoning and permitted uses should be independently verified with authorities.
How Realmo checks its estimates
Property Analytics
Current Use
Location Intelligence
Trade Area within ½ mile
1,142
Businesses Nearby
Explore this area
Business Placement
Demographics for 73069, OK
26,464
Population
12,719
Households
2.1
Avg Household Size
32
Median Age
45%
College-Educated
93%
High-School Grad
15.7 sq mi
ZIP Area
1,686
Density / Sq Mi
$55,699
Median Household Income
$34,151
Median Earnings
$1,031
Median Rent
$212,400
Median Home Value
Market
Vacancy Rate% for Office in South region




Frequently Asked Questions
What type of property is this?
Office building - Partially occupied office property with one suite available for immediate occupancy and on-site parking.
Where is this office building located?
The property is located at 909-901 Wall St Norman, OK.
What is the asking price?
The asking price for this property is $1,150,000.
What are key features of this property?
This property features: 5,031‑square‑foot office building with two separate suites; Suite 901 is occupied under a lease with annual escalations through April 2029; Suite 909 is vacant and ready for immediate occupancy