Mixed-Use Building with
For Sale
Contact for pricing
906 W BEECH ST, Long Beach, NY 11561
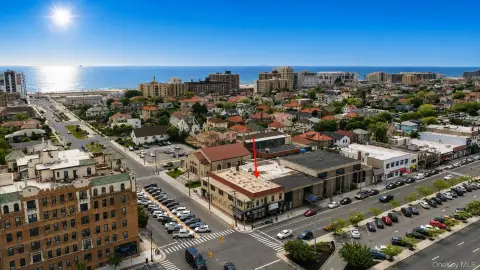
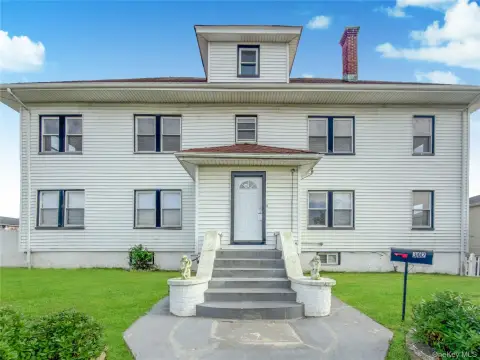
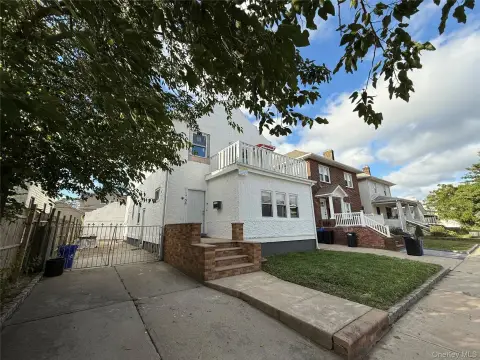
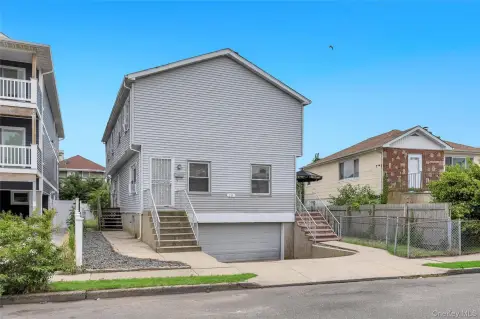
Ground-floor restaurant/bar space and second-floor office or commercial space within a corner mixed-use building.
Property Size4,066 SF
Price / SF$885.39
Days on Market96
Property Features for 906 W BEECH ST
General Information
Standard status
Active
Size
4,066 SF
Class
B
Property subtype
Retail
Occupancy
100%
Lease Type
NNN
Investment Type
Net Lease
Net Operating Income
$210,000
Building Details
Year Built
1922
Year Renovated
2025
Stories
2
Units
1
Tenancy
Single
Listing Agency:
Reliant Realty Group LLC
Listed By:
Lorena Costa · License #NY
Source:
Crexi
Added: Jul 16
Changed: Oct 3
Last Checked: Oct 19 at 6:09AM
Displayed information is deemed reliable but is not guaranteed and should be independently verified. All listing content including descriptions, pricing, images are the copyrighted material of Reliant Realty Group LLC

Ask AI about this property
Review the available facts, identify missing information and prepare questions for the agent.
Investment Insights
Based on property information with market context.
This mixed-use building includes fully built-out restaurant/bar space on the ground floor and additional office or commercial space on the second level. The property was originally constructed in 1922 and is configured to support multiple commercial uses under one roof.
Situated at 906 W. Beech Street on a corner location, the building is positioned with strong street presence and benefits from heavy pedestrian and vehicular traffic per the seller’s remarks. The property is described as being steps from the beach and surrounded by restaurants, nightlife, retail, and year-round residential density in Long Beach’s West End.
With both dining and workspace areas already in place, the building is well suited for investors seeking a multi-income structure or owner-users looking for a live-work retail concept, subject to municipal approvals for any continued or expanded use.
Situated at 906 W. Beech Street on a corner location, the building is positioned with strong street presence and benefits from heavy pedestrian and vehicular traffic per the seller’s remarks. The property is described as being steps from the beach and surrounded by restaurants, nightlife, retail, and year-round residential density in Long Beach’s West End.
With both dining and workspace areas already in place, the building is well suited for investors seeking a multi-income structure or owner-users looking for a live-work retail concept, subject to municipal approvals for any continued or expanded use.
Key Highlights
- Approximately 4,066 SF mixed‑use commercial building built in 1922 at 906 W. Beech Street
- Ground‑floor restaurant/bar space plus second‑floor office or commercial space with a flexible layout
- Corner location with heavy pedestrian and vehicular traffic for strong street‑level presence
Financial Insights
Estimated NOI and Cap Rate
NOI / Yr
$188,185
Cap Rate
5.23%
Suggested Prices Based on Cap Rates
Cap Rate 5%
$3,763,700
$3.8M
Cap Rate 7%
$2,688,357
$2.7M
Cap Rate 9%
$2,090,944
$2.1M
Market Conditions
NOI Build-Up for 4,066 SF
Gross rent
$268.4K $66.00/SF
− Vacancy
−$17.4K −$4.29/SF
EGI
$250.9K $61.71/SF
− OpEx
−$62.7K −$15.43/SF
NOI
$188.2K $46.28/SF
Area
Nassau County, NY
Vacancy
6.50%
Lease Rate
$66.00 /SF/Yr
Expense Ratio
25.00%
Simulate Cap Rate and NOI
Suggested Prices Based on Cap Rates
Cap Rate 5%
$3,763,700
Cap Rate 7%
$2,688,357
Cap Rate 9%
$2,090,944
Alternative Uses
Best Use
Specialty Retail
$2.69M
$2.35M – $3.14M
NOI $188,185 @ 7.0% cap · market cap 5.23%
Second Best
Office B
$998.8K
$874.0K – $1.17M
NOI $69,916 @ 7.0% cap · market cap 1.94%
Theoretical Best
—
—
same as Best Use
Zoning and permitted uses should be independently verified with authorities.
How Realmo checks its estimates
Property Analytics
Unlock full access to Insights
Subscribe to Realmo Intelligence
Open Analytics
Current Use
Location Intelligence
Trade Area within ½ mile
432
Businesses Nearby
Explore this area
Business Placement
Demographics for 11561, NY
39,132
Population
18,442
Households
2.1
Avg Household Size
45
Median Age
53%
College-Educated
96%
High-School Grad
4.0 sq mi
ZIP Area
9,783
Density / Sq Mi
$132,903
Median Household Income
$72,221
Median Earnings
$2,462
Median Rent
$676,600
Median Home Value
Check the figures for this property
Cap Rate, Value Estimation, Potential NOI and more
View Realmo Analytics
Market
Vacancy Rate% for Office in Northeast region



Frequently Asked Questions
What type of property is this?
Mixed-use property - Ground-floor restaurant/bar space and second-floor office or commercial space within a corner mixed-use building.
Where is this mixed-use property located?
The property is located at 906 W BEECH ST Long Beach, NY.
What is the asking price?
The asking price for this property is $3,600,000.
What are key features of this property?
This property features: Approximately 4,066 SF mixed‑use commercial building built in 1922 at 906 W. Beech Street; Ground‑floor restaurant/bar space plus second‑floor office or commercial space with a flexible layout; Corner location with heavy pedestrian and vehicular traffic for strong street‑level presence


