Renovated Drive-Through
For Sale
$549,000
900 N Broughton St, Sherman, TX 75090
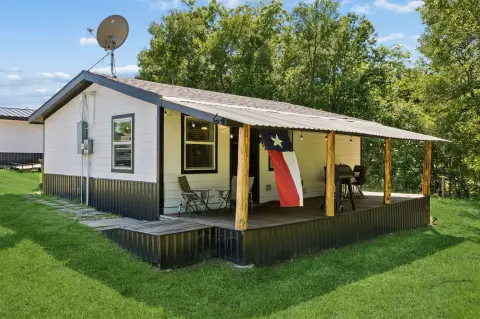
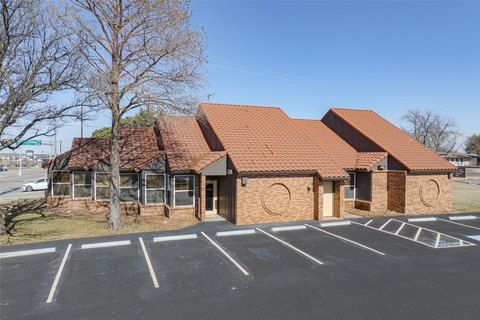
Freestanding restaurant with a drive-through, patio, storage house, and proximity to Austin College.
Property Size1,452 SF
Price / SF$378.10
Days on Market67
Property Features for 900 N Broughton St
General Information
Standard status
Active
Size
1,452 SF
Additional Details
Drive-Thru
Yes
Patio
Yes
Amenities
storage house
Building Details
Year Built
1988
Listing Agency:
Opportune Realty
Listed By:
Ari Besefki · License #TX-0655788
(214) 662-1941
Source:
Heritance
Added: Aug 16
Changed: Oct 5
Last Checked: Oct 7 at 4:19PM
Displayed information is deemed reliable but is not guaranteed and should be independently verified. All listing content including descriptions, pricing, images are the copyrighted material of Opportune Realty

Ask AI about this property
Review the available facts, identify missing information and prepare questions for the agent.
Investment Insights
Based on property information with market context.
This freestanding second-generation restaurant contains 1,452 square feet and includes a drive-through, patio, and separate storage-house area. The building underwent a full renovation, including a new metal roof, HVAC systems, plumbing, electrical panels, and exterior brick walls.
Built in 1988, the property is located a few blocks from Austin College in Sherman, Texas. Its existing restaurant configuration and drive-through component provide a defined setup for continued food-service use.
Built in 1988, the property is located a few blocks from Austin College in Sherman, Texas. Its existing restaurant configuration and drive-through component provide a defined setup for continued food-service use.
Key Highlights
- 1,452‑square‑foot freestanding second‑generation restaurant
- Drive‑through, patio, and storage‑house area included
- Renovated with new metal roof, HVAC systems, plumbing, and electrical panels
Financial Insights
Estimated NOI and Cap Rate
NOI / Yr
$25,822
Cap Rate
4.70%
Suggested Prices Based on Cap Rates
Cap Rate 5%
$516,440
$516.4K
Cap Rate 7%
$368,886
$368.9K
Cap Rate 9%
$286,911
$286.9K
Market Conditions
NOI Build-Up for 1,452 SF
Gross rent
$36.2K $24.96/SF
− Vacancy
−$1.8K −$1.25/SF
EGI
$34.4K $23.71/SF
− OpEx
−$8.6K −$5.93/SF
NOI
$25.8K $17.78/SF
Area
Grayson County, TX
Vacancy
5.00%
Lease Rate
$24.96 /SF/Yr
Expense Ratio
25.00%
Simulate Cap Rate and NOI
Suggested Prices Based on Cap Rates
Cap Rate 5%
$516,440
Cap Rate 7%
$368,886
Cap Rate 9%
$286,911
Alternative Uses
Best Use
Specialty Retail
$368.9K
$322.8K – $430.4K
NOI $25,822 @ 7.0% cap · market cap 4.70%
Second Best
—
—
no second resolved use
Theoretical Best
Hotel Hospitality
$744.9K
$651.8K – $869.0K
NOI $52,141 @ 7.0% cap · market cap 9.50%
Zoning and permitted uses should be independently verified with authorities.
How Realmo checks its estimates
Property Analytics
Who owns this building?
See the owner, sales and loan history
Open Analytics
Current Use
Location Intelligence
Trade Area within ½ mile
899
Businesses Nearby
Explore this area
Business Placement
Demographics for 75090, TX
25,002
Population
9,602
Households
2.6
Avg Household Size
35
Median Age
15%
College-Educated
84%
High-School Grad
78.5 sq mi
ZIP Area
318
Density / Sq Mi
$58,586
Median Household Income
$36,230
Median Earnings
$1,111
Median Rent
$163,500
Median Home Value
Check the figures for this property
Cap Rate, Value Estimation, Potential NOI and more
View Realmo Analytics
Market
Vacancy Rate% for Retail in South region






Frequently Asked Questions
What type of property is this?
Drive through restaurant - Freestanding restaurant with a drive-through, patio, storage house, and proximity to Austin College.
Where is this drive through restaurant located?
The property is located at 900 N Broughton St Sherman, TX.
What is the asking price?
The asking price for this property is $549,000.
What are key features of this property?
This property features: 1,452‑square‑foot freestanding second‑generation restaurant; Drive‑through, patio, and storage‑house area included; Renovated with new metal roof, HVAC systems, plumbing, and electrical panels


