Corner Single-Family Home with Side
For Sale
$758,888
90 Elson Street, Staten Island, NY 10314
Residential, Duplex, Staten Island, NY
Property Size1,800 SF
Lot Size0.06 Acres
Price / SF$421.60
Days on Market138
Property Features for 90 Elson Street
General Information
Property type
Residential
Property subtype
Duplex
Zoning
R3-2
Bedrooms
3
Bathrooms
3
Full bathrooms
1
Half bathrooms
2
Rooms
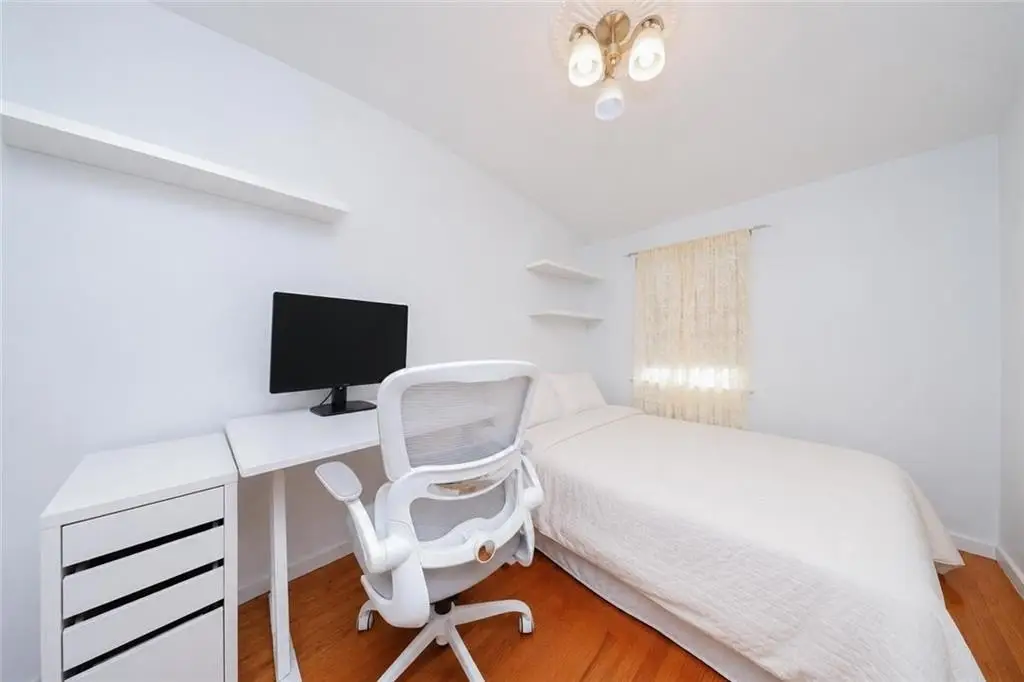
Bedroom 3, Bedroom 1, Bedroom 2, Bathroom 1, Bathroom 2, Bathroom 3
Parking features
Garage
Interior features
Refrigerator, Stove
Subdivision
Bulls Head
Standard status
Active
Size
1,800 SF
Lot size
0.06 Acres
Taxes and HOA fees
Tax Annual Amount
6685
Building Details
Year built
1986
Floors in Building
3
Flooring type
Tile, Hardwood
Roof type
Flat
Architectural style
Other
Listing Agency:
Tiger Realty
(917) 708-9966
Listed By:
Pengyi Eridani Zhou
(929) 533-9333
Added: Jun 1
Changed: Oct 16
Last Checked: Oct 16 at 8:06PM
MLS# 501912
Copyright © 2026 Brooklyn New York Multiple Listing Service. All rights reserved. All information provided by the listing agent/broker is deemed reliable but is not guaranteed and should be independently verified.

Ask AI about this property
Review the available facts, identify missing information and prepare questions for the agent.
Investment Insights
Based on property information with market context.
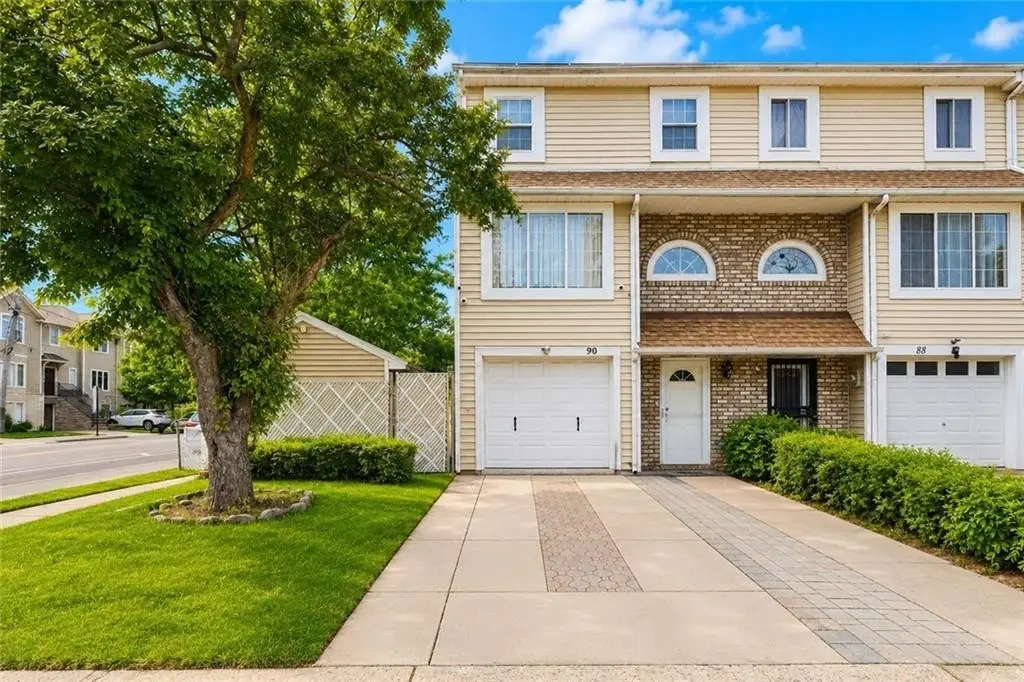
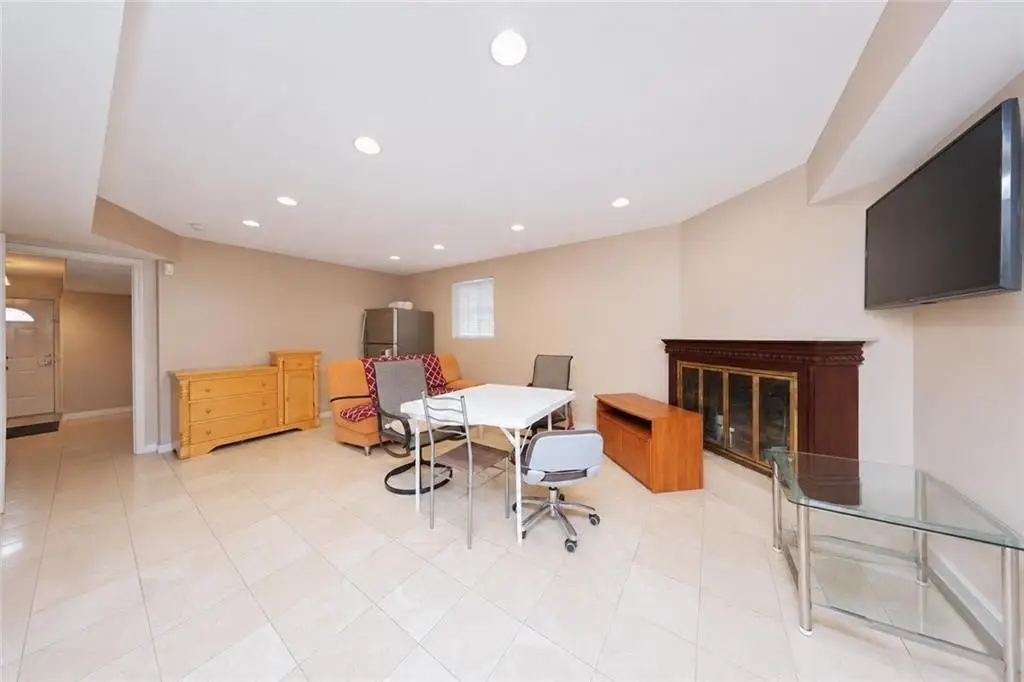
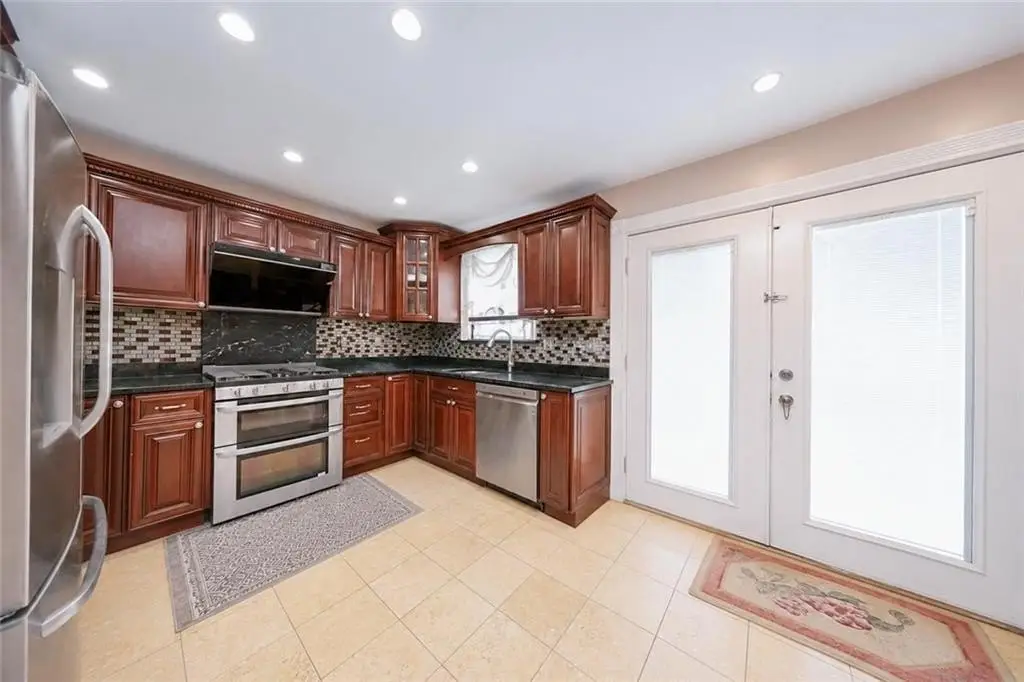
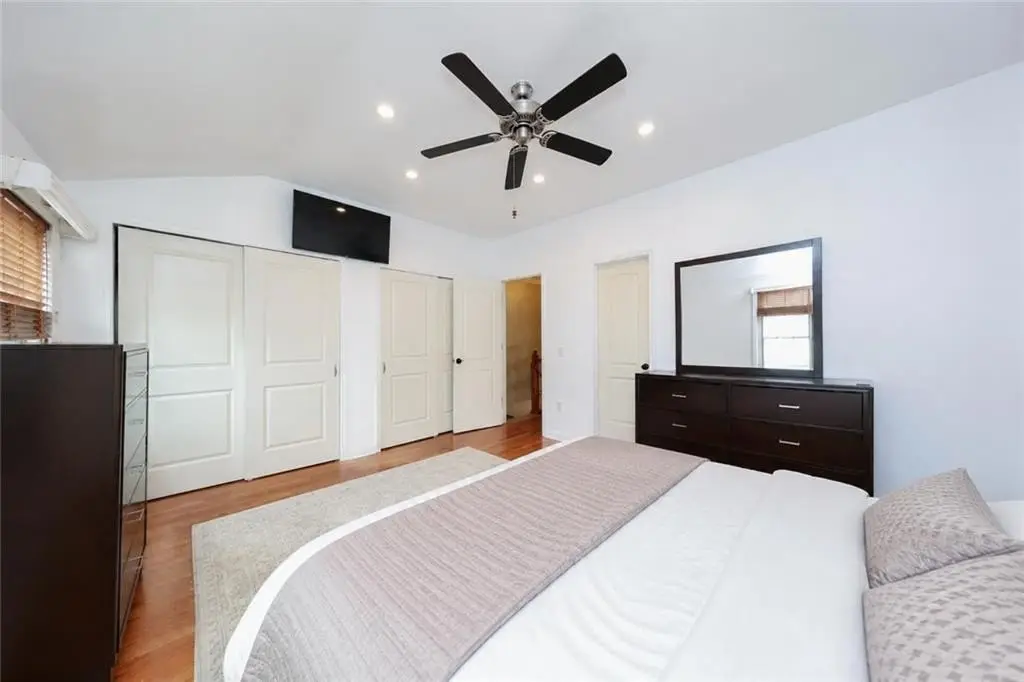
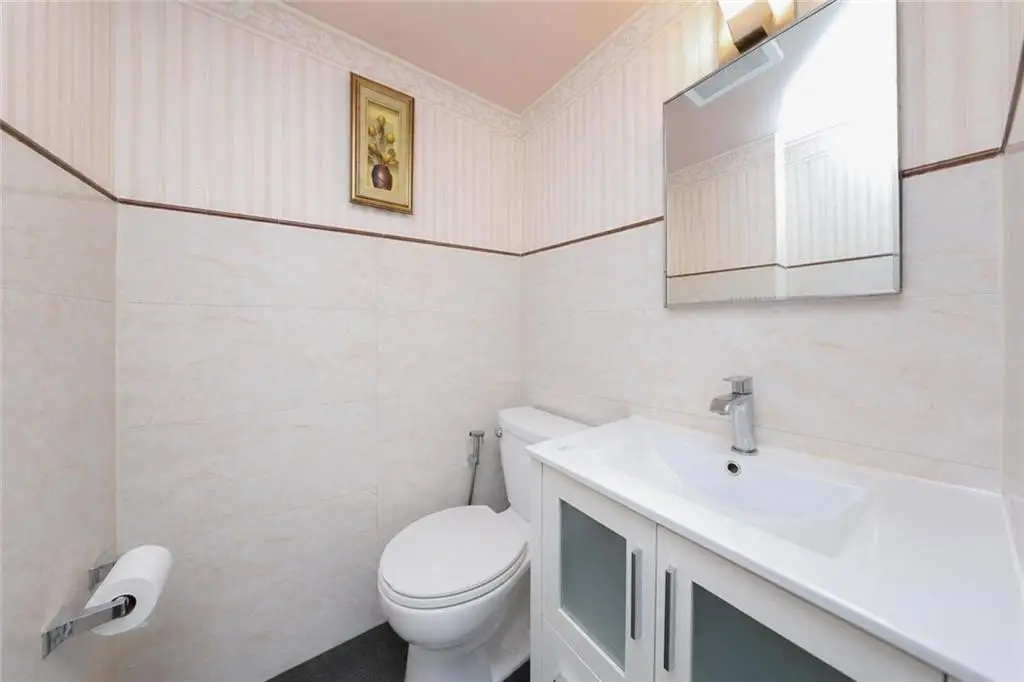
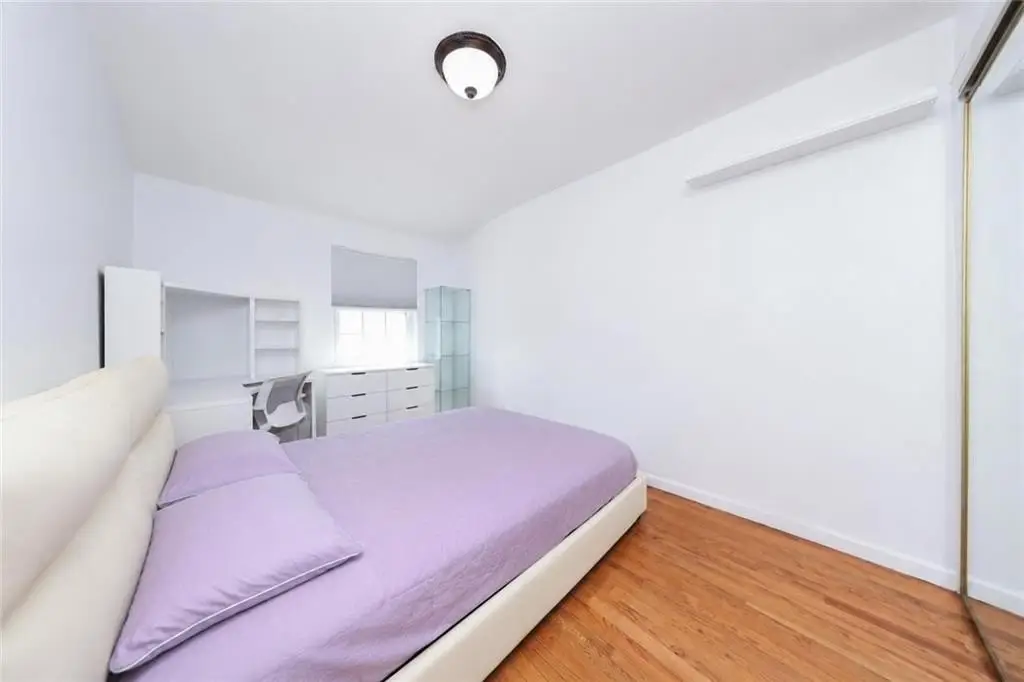
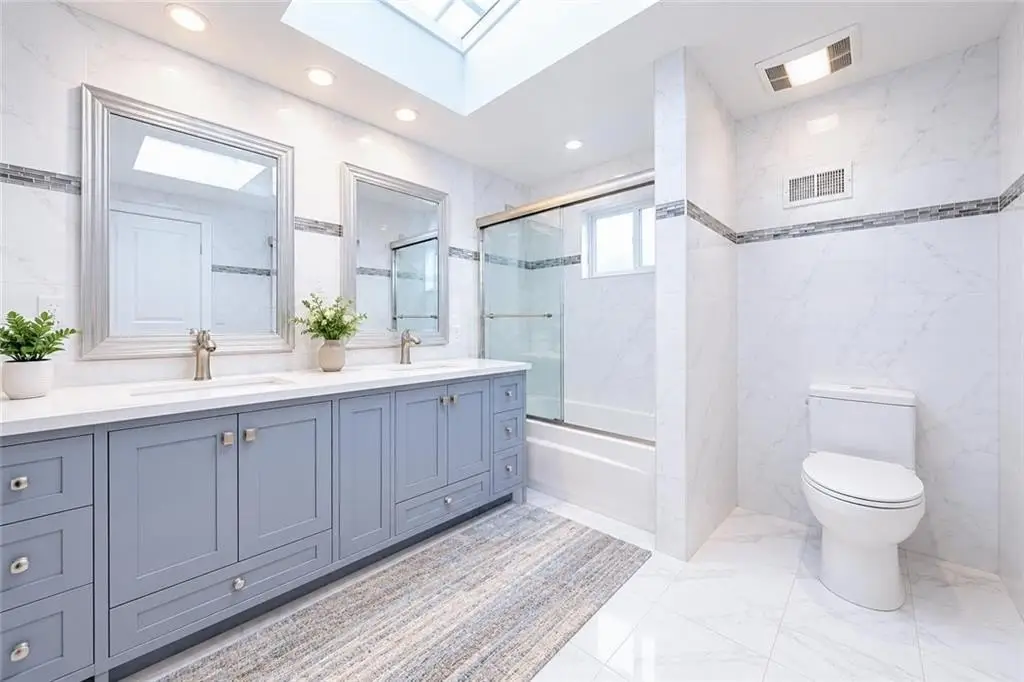
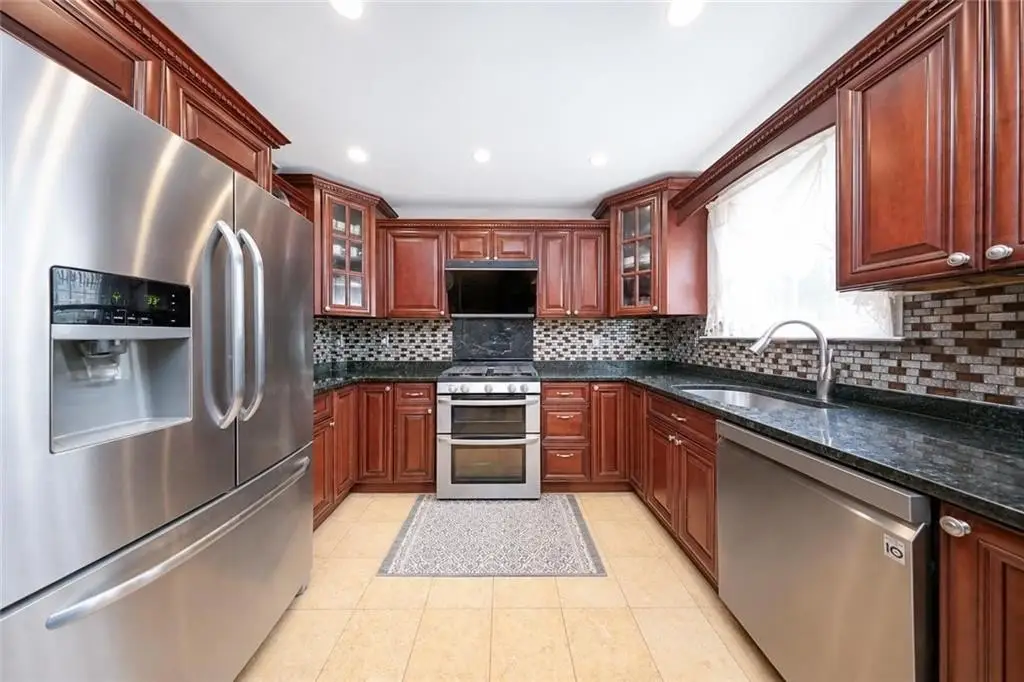
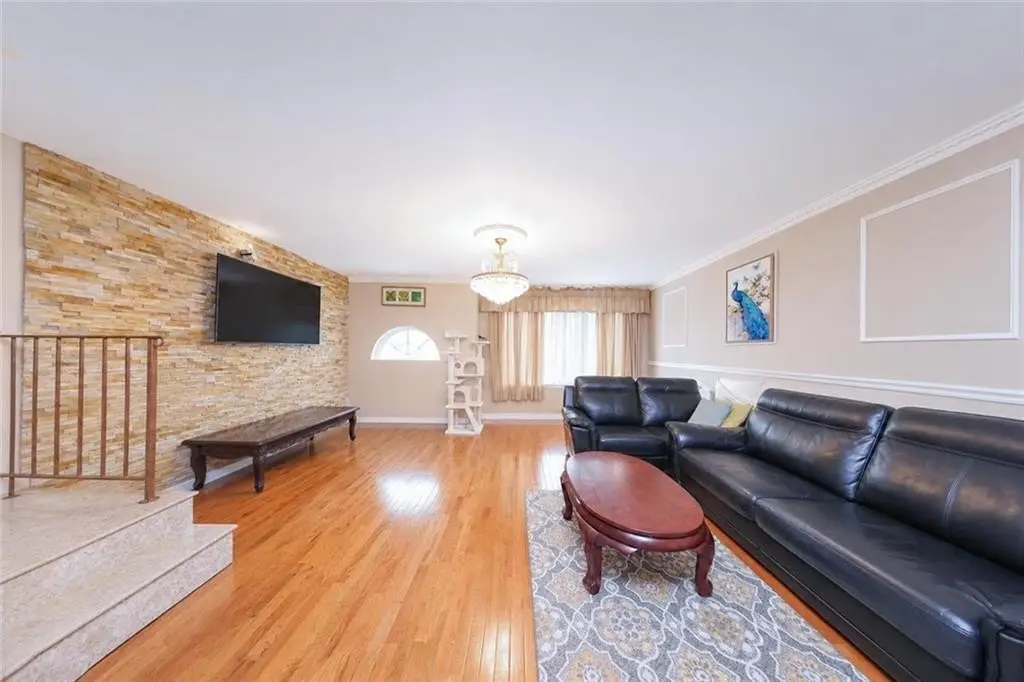
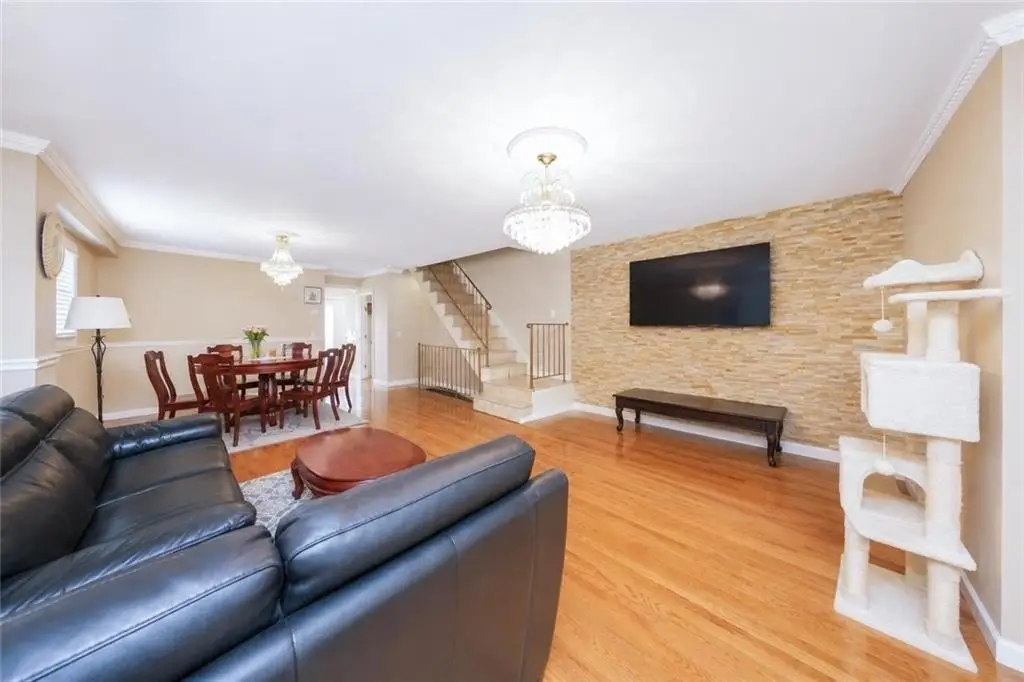
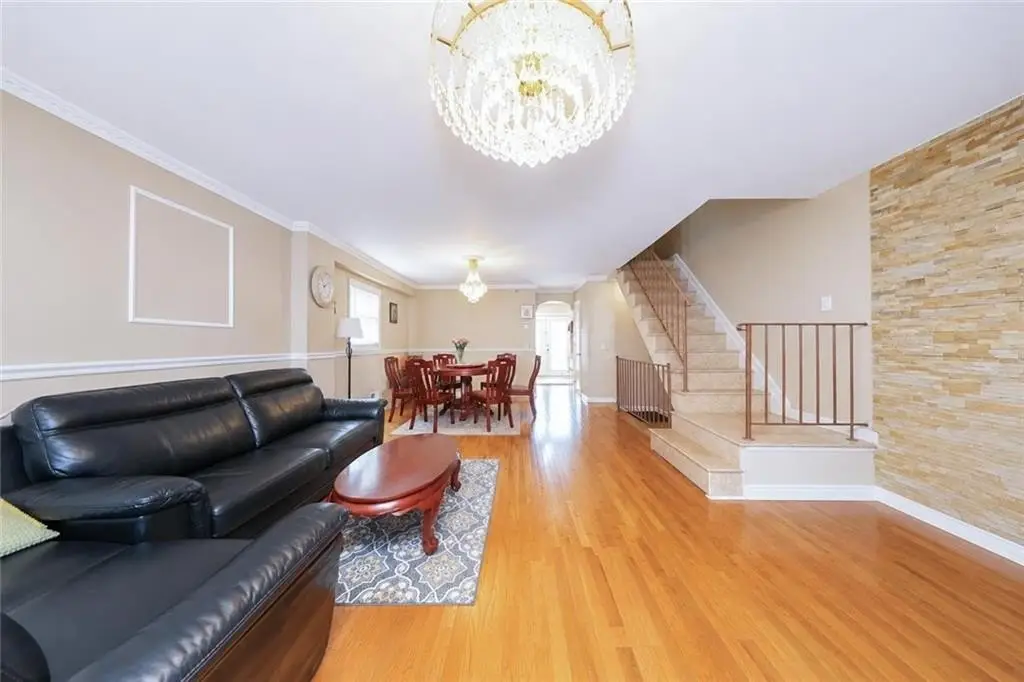
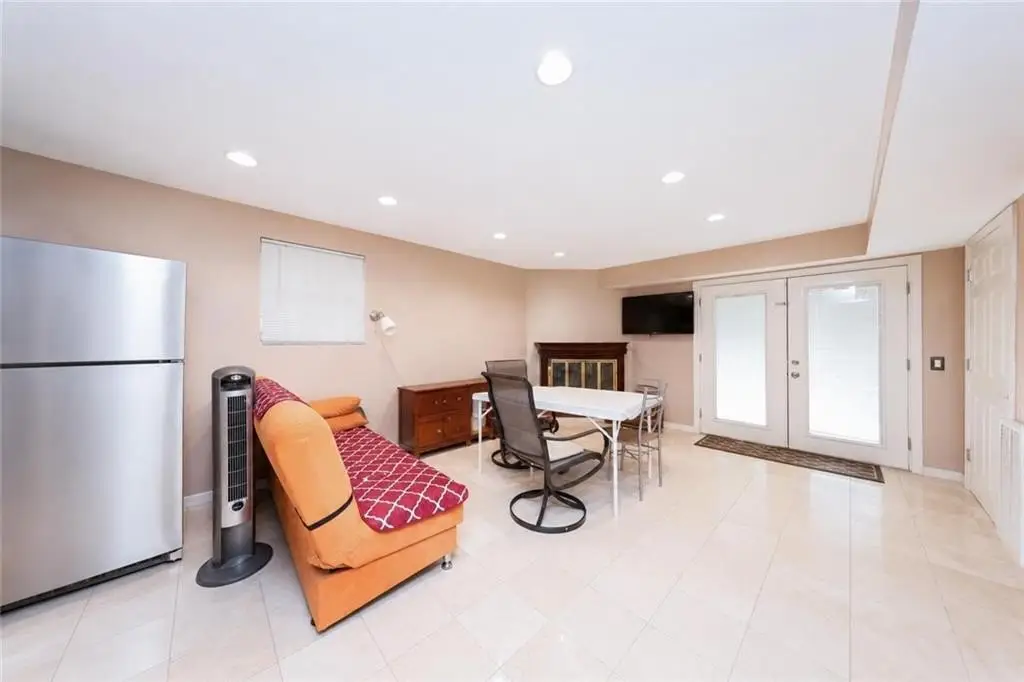
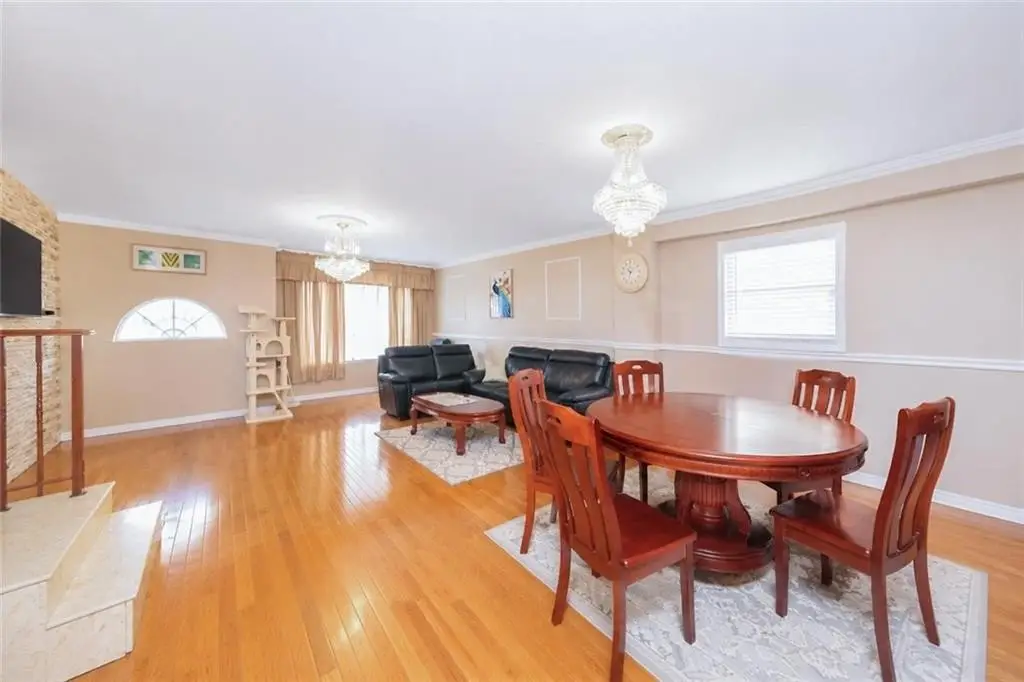
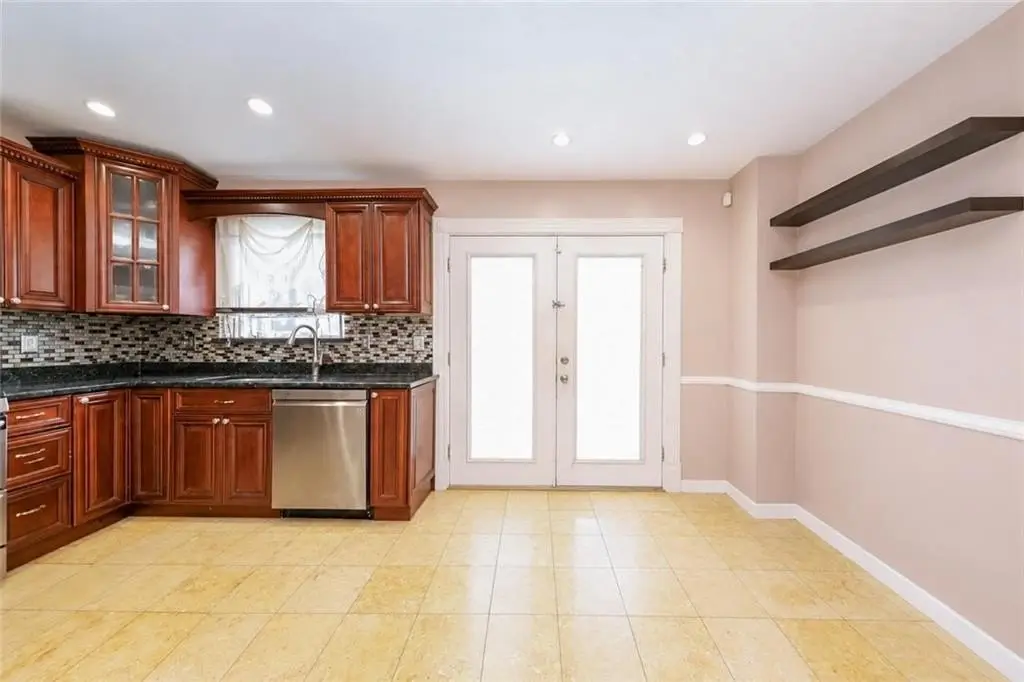
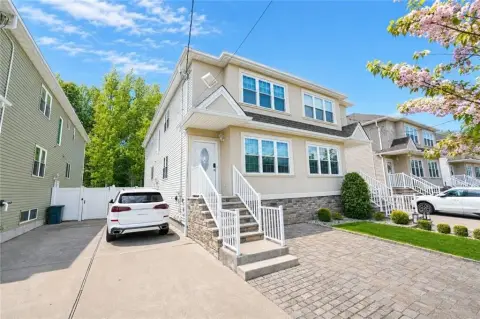
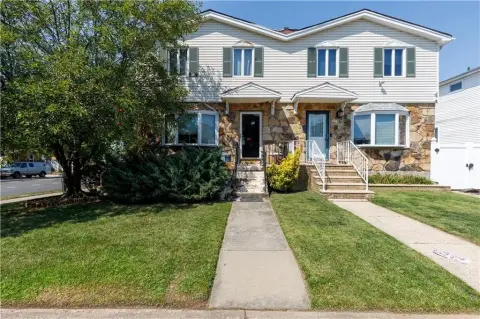
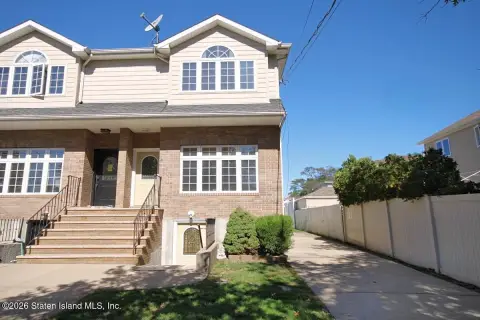
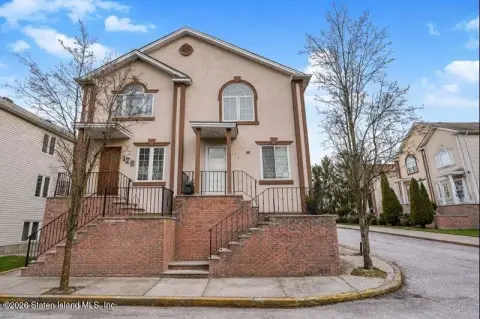
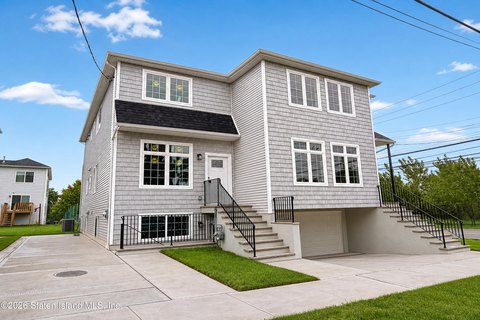
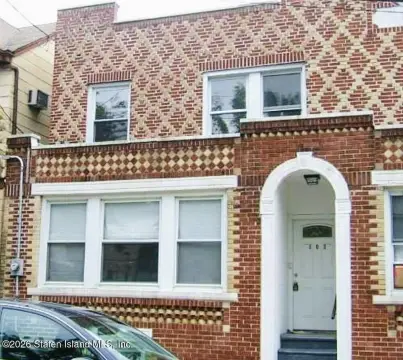
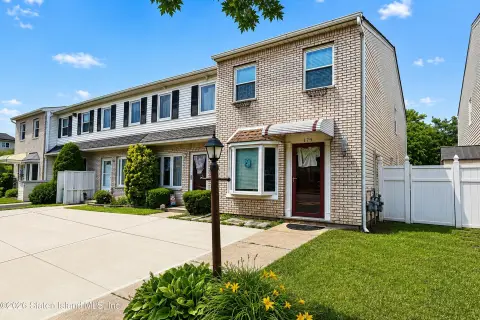
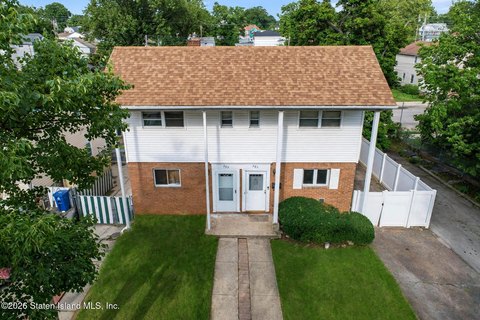
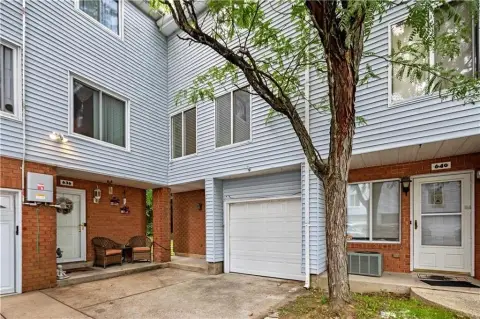
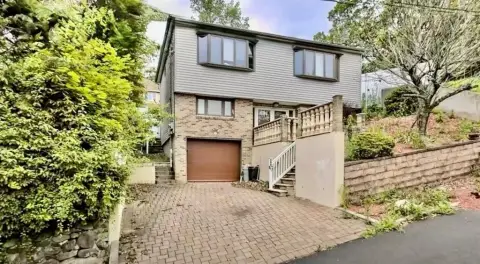
This fully renovated semi-detached bungalow is positioned as a corner home and offers three bedrooms with one full bathroom and two half bathrooms across three levels. Interior highlights include marble floors and a marble staircase, along with an eat-in kitchen that opens into a large formal dining room and living room featuring a real wood-burning fireplace. A finished basement adds additional versatility, and an attic provides extra storage.
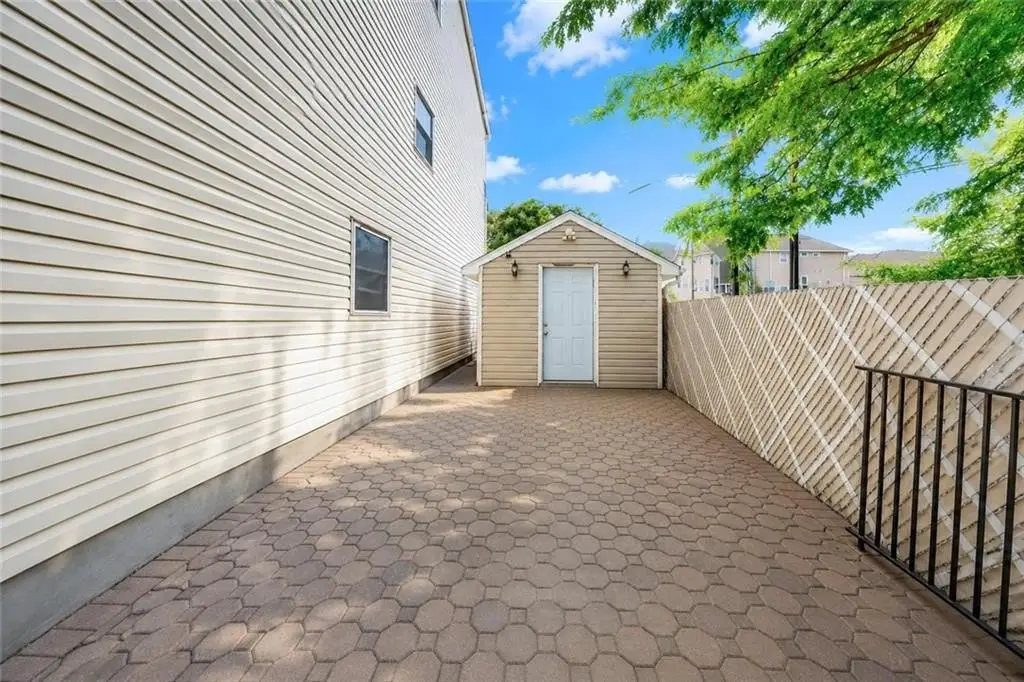
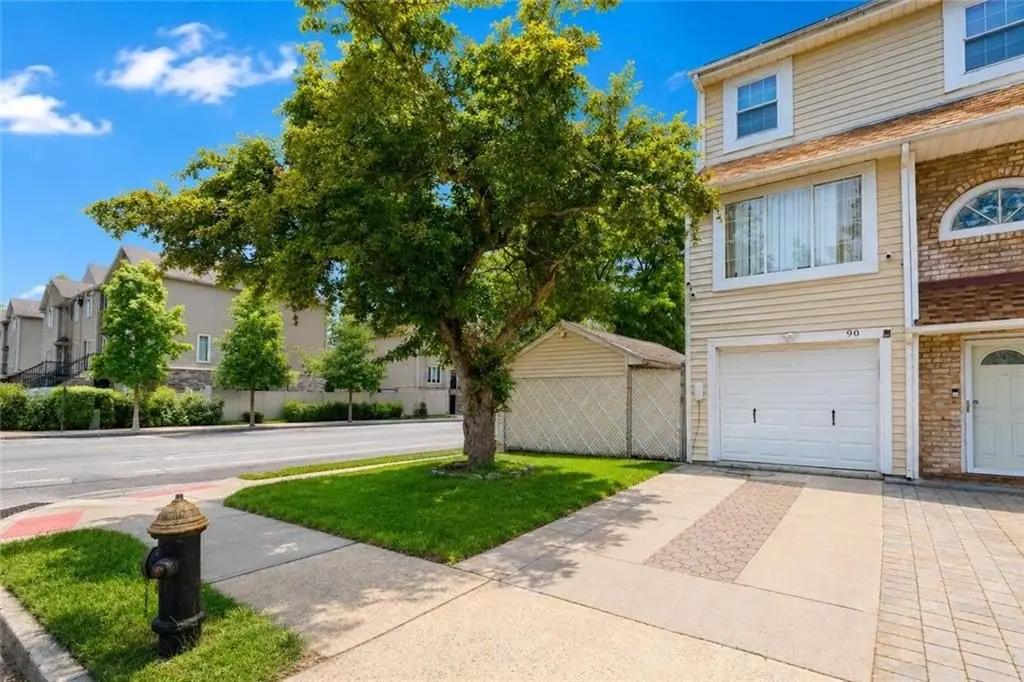
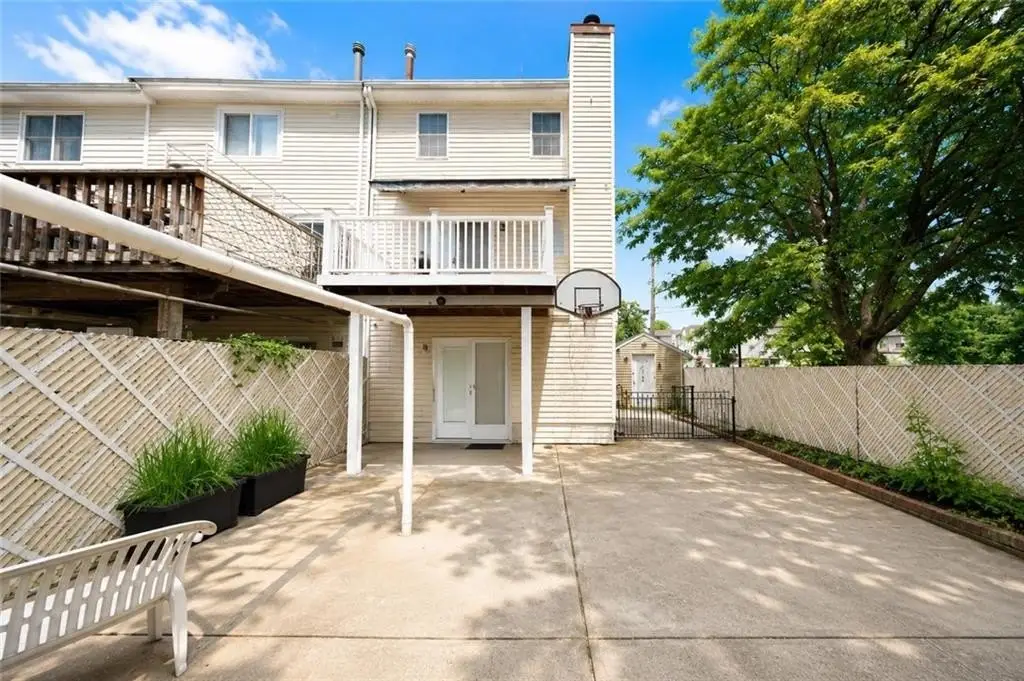
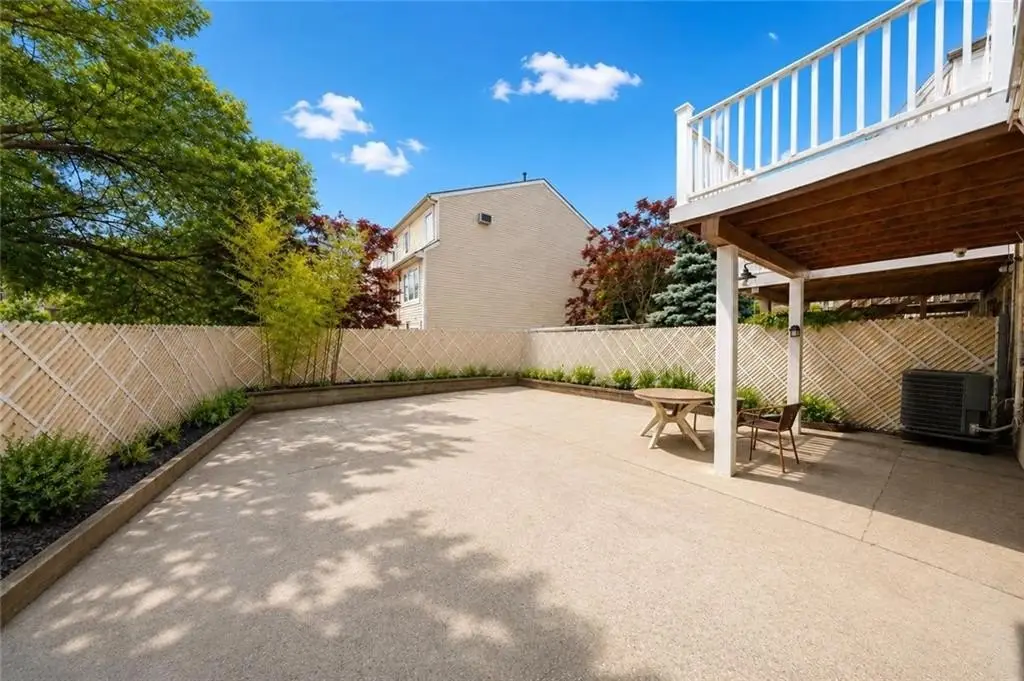
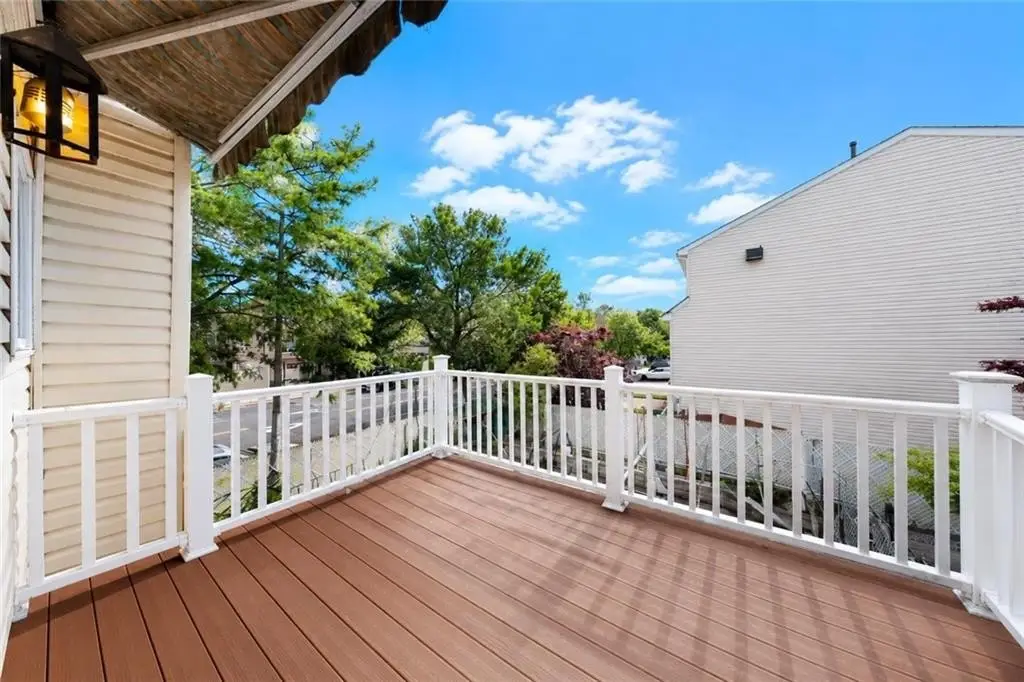
Outside, the property includes a huge side yard along with an oversized backyard. There is also a built-in garage with a private driveway, and a deck to support indoor-outdoor living.
The home is located at 90 Elson Street in Staten Island, NY 10314 within zoning R3-2. The association provides community amenities including a clubhouse, large adult pool, kids’ pool, and a children’s playground, with HOA dues listed at $170 per month.
Outside, the property includes a huge side yard along with an oversized backyard. There is also a built-in garage with a private driveway, and a deck to support indoor-outdoor living.
The home is located at 90 Elson Street in Staten Island, NY 10314 within zoning R3-2. The association provides community amenities including a clubhouse, large adult pool, kids’ pool, and a children’s playground, with HOA dues listed at $170 per month.
Key Highlights
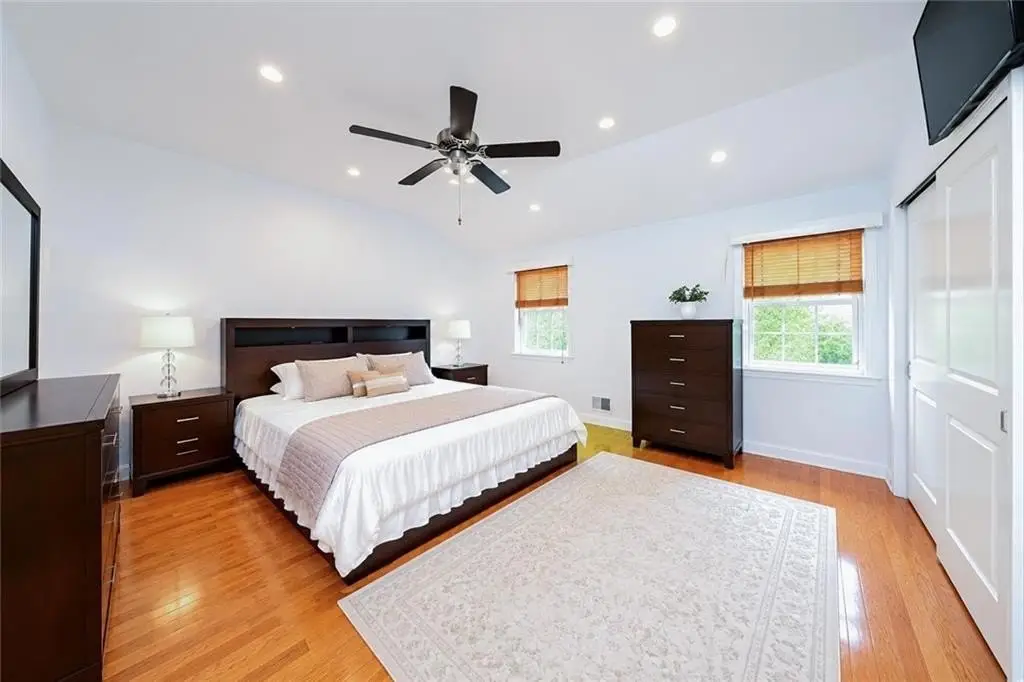
- Fully renovated semi‑detached bungalow on a corner lot with 3 bedrooms and approx. 1,800 SF across three levels
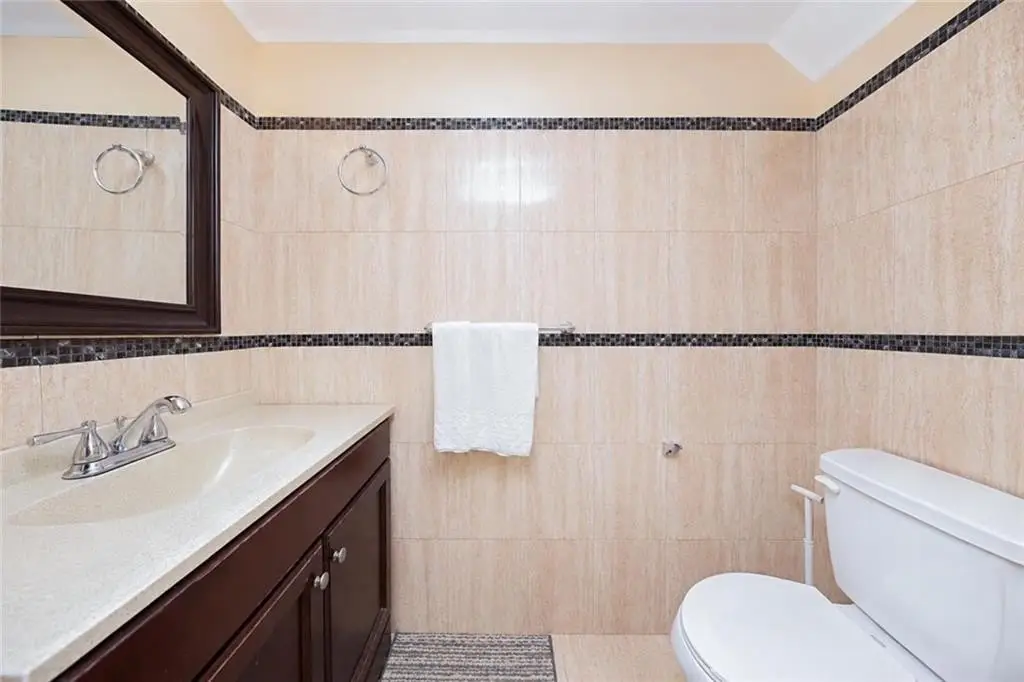
- 3 bathrooms total: 1 full bath and 2 half baths
- Eat‑in kitchen with refrigerator and stove, plus a formal dining room and living room with a wood‑burning fireplace
Financial Insights
Estimated NOI and Cap Rate
NOI / Yr
$45,524
Cap Rate
6.00%
Suggested Prices Based on Cap Rates
Cap Rate 5%
$910,480
$910.5K
Cap Rate 7%
$650,343
$650.3K
Cap Rate 9%
$505,822
$505.8K
Market Conditions
NOI Build-Up for 1,800 SF
Gross rent
$86.4K $48.00/SF
− Vacancy
−$3.6K −$2.02/SF
EGI
$82.8K $45.98/SF
− OpEx
−$37.2K −$20.69/SF
NOI
$45.5K $25.29/SF
Area
ZIP 10314
Vacancy
4.20%
Lease Rate
$48.00 /SF/Yr
Expense Ratio
45.00%
Simulate Cap Rate and NOI
Suggested Prices Based on Cap Rates
Cap Rate 5%
$910,480
Cap Rate 7%
$650,343
Cap Rate 9%
$505,822
Alternative Uses
Best Use
Apartment 5plus
$650.3K
$569.1K – $758.7K
NOI $45,524 @ 7.0% cap · market cap 6.00%
Second Best
—
—
no second resolved use
Theoretical Best
Office A
$858.9K
$751.5K – $1.00M
NOI $60,120 @ 7.0% cap · market cap 7.92%
Zoning and permitted uses should be independently verified with authorities.
How Realmo checks its estimates
Property Analytics
Unlock full access to Insights
Subscribe to Realmo Intelligence
Open Analytics
Current Use
Location Intelligence
Trade Area within ½ mile
890
Businesses Nearby
Explore this area
Business Placement
Demographics for 10314, NY
92,157
Population
33,554
Households
2.7
Avg Household Size
41
Median Age
37%
College-Educated
89%
High-School Grad
13.0 sq mi
ZIP Area
7,089
Density / Sq Mi
$104,655
Median Household Income
$58,769
Median Earnings
$1,726
Median Rent
$665,500
Median Home Value
Check the figures for this property
Cap Rate, Value Estimation, Potential NOI and more
View Realmo Analytics
Frequently Asked Questions
What type of property is this?
Single family property - Fully renovated semi-detached bungalow with three bedrooms, marble finishes, and a large side yard plus private driveway.
Where is this single family property located?
The property is located at 90 Elson Street Staten Island, NY.
What is the asking price?
The asking price for this property is $758,888.
What are key features of this property?
This property features: Fully renovated semi‑detached bungalow on a corner lot with 3 bedrooms and approx. 1,800 SF across three levels; 3 bathrooms total: 1 full bath and 2 half baths; Eat‑in kitchen with refrigerator and stove, plus a formal dining room and living room with a wood‑burning fireplace


