Remodeled Multifamily Investment
For Sale
Contact for pricing
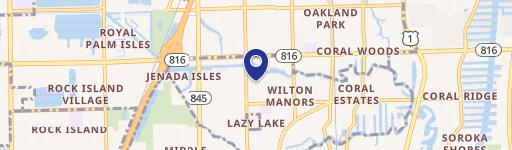
2201 NE 14th Ave, Wilton Manors, FL 33305
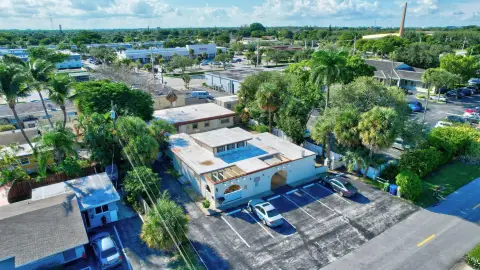
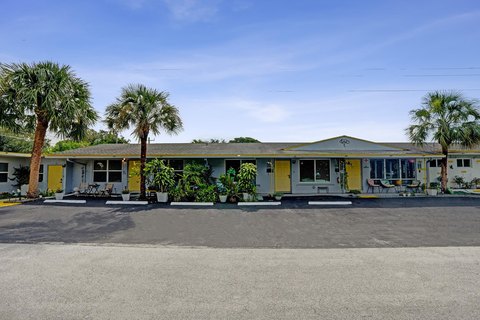
9-unit multifamily property in Wilton Manors, fully leased.
Property Size7,551 SF
Price / SF$330.68
Days on Market886
Property Features for 2201 NE 14th Ave
General Information
Standard status
Active
Size
7,551 SF
Total Parking Spaces
14
Property subtype
Multifamily
Zoning
RM-16
Building Details
Year Built
1959
Units
9
Listing Agency:
Miami Masterpiece
Listed By:
Carla Contreras · License #3267434
Source:
Crexi
Added: May 17, 2024
Changed: Oct 3
Last Checked: Oct 16 at 9:04AM
Displayed information is deemed reliable but is not guaranteed and should be independently verified. All listing content including descriptions, pricing, images are the copyrighted material of Miami Masterpiece

Ask AI about this property
Review the available facts, identify missing information and prepare questions for the agent.
Investment Insights
Based on property information with market context.
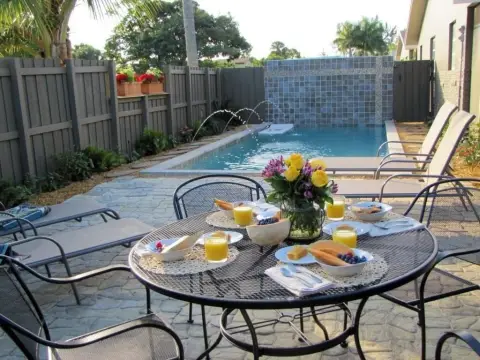
This is a 9-unit multifamily property located in Wilton Manors. The property features eight 1-bedroom, 1-bathroom units, each with a private patio, and one 2-bedroom, 1-bathroom unit. The property has been remodeled and includes a new roof, hurricane impact windows, and a full electrical system upgrade. The property has completed its 40-year certification. All units have central air. A coin laundry is located on-site. The property is 100% leased with annual leases. The property is located near shopping, dining, nightlife, and beaches. It is suitable for investors seeking cash flow, appreciation, and long-term value. The property has a strong rental history with consistent demand and upside potential. The property size is 7551 square feet.
Key Highlights
- Fully remodeled 9‑unit multifamily property featuring 8 (1BR/1BA) units and 1 (2BR/1BA) unit.
- 100% leased with annual leases, ensuring immediate and stable income.
- New roof, hurricane impact windows, and upgraded electrical system, with completed 40‑year certification.
Financial Insights
Estimated NOI and Cap Rate
NOI / Yr
$116,129
Cap Rate
4.65%
Suggested Prices Based on Cap Rates
Cap Rate 5%
$2,322,580
$2.3M
Cap Rate 7%
$1,658,986
$1.7M
Cap Rate 9%
$1,290,322
$1.3M
Market Conditions
NOI Build-Up for 7,551 SF
Gross rent
$221.1K $29.28/SF
− Vacancy
−$9.9K −$1.32/SF
EGI
$211.1K $27.96/SF
− OpEx
−$95.0K −$12.58/SF
NOI
$116.1K $15.38/SF
Area
Broward County, FL
Vacancy
4.50%
Lease Rate
$29.28 /SF/Yr
Expense Ratio
45.00%
Simulate Cap Rate and NOI
Suggested Prices Based on Cap Rates
Cap Rate 5%
$2,322,580
Cap Rate 7%
$1,658,986
Cap Rate 9%
$1,290,322
Alternative Uses
Best Use
Apartment 5plus
$1.66M
$1.45M – $1.94M
NOI $116,129 @ 7.0% cap · market cap 4.65%
Second Best
—
—
no second resolved use
Theoretical Best
Office A
$3.83M
$3.35M – $4.47M
NOI $268,166 @ 7.0% cap · market cap 10.74%
Zoning and permitted uses should be independently verified with authorities.
How Realmo checks its estimates
Property Analytics
Unlock full access to Insights
Subscribe to Realmo Intelligence
Open Analytics
Current Use
Location Intelligence
Trade Area within ½ mile
2,037
Businesses Nearby
Explore this area
Business Placement
Demographics for 33305, FL
12,044
Population
8,285
Households
1.5
Avg Household Size
52
Median Age
54%
College-Educated
96%
High-School Grad
2.2 sq mi
ZIP Area
5,475
Density / Sq Mi
$89,944
Median Household Income
$60,924
Median Earnings
$1,850
Median Rent
$558,200
Median Home Value
Check the figures for this property
Cap Rate, Value Estimation, Potential NOI and more
View Realmo Analytics
Market
Vacancy Rate% for Multifamily in South region





Frequently Asked Questions
What type of property is this?
Apartment building - 9-unit multifamily property in Wilton Manors, fully leased.
Where is this apartment building located?
The property is located at 2201 NE 14th Ave Wilton Manors, FL.
What is the asking price?
The asking price for this property is $2,497,000.
What are key features of this property?
This property features: Fully remodeled 9‑unit multifamily property featuring 8 (1BR/1BA) units and 1 (2BR/1BA) unit.; 100% leased with annual leases, ensuring immediate and stable income.; New roof, hurricane impact windows, and upgraded electrical system, with completed 40‑year certification.


