Restaurant with Drive-Thru For
For Sale
Contact for pricing
4021 W Saginaw Hwy, Lansing, MI 48917
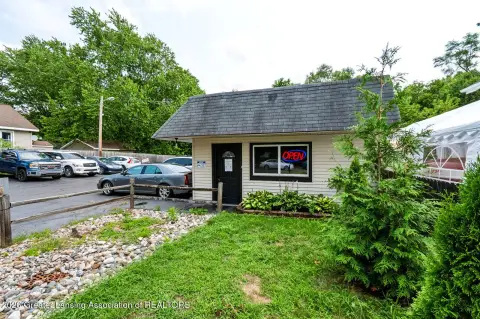
Free-standing restaurant with drive-thru on 1.32 acres.
Property Size2,856 SF
Lot Size1.32 Acres
Price / SF$311.27
Days on Market1438
Property Features for 4021 W Saginaw Hwy
General Information
Standard status
Active
Size
2,856 SF
Lot size
1.32 Acres
Property subtype
Retail
Zoning
C
Occupancy
100%
Lease Type
NNN
Building Details
Year Built
1980
Year Renovated
2013
Tenancy
Single
Listing Agency:
Woodworth Commercial Okemos
Listed By:
Todd Kosta · License #MI 6501346341
(517) 679-8633
Source:
Crexi
Added: Nov 9, 2022
Changed: Oct 10
Last Checked: Oct 16 at 6:20AM
Displayed information is deemed reliable but is not guaranteed and should be independently verified. All listing content including descriptions, pricing, images are the copyrighted material of Woodworth Commercial Okemos

Ask AI about this property
Review the available facts, identify missing information and prepare questions for the agent.
Investment Insights
Based on property information with market context.
This free-standing restaurant, complete with a drive-thru, is situated on W. Saginaw Hwy, adjacent to McDonald's and one block from the Waverly Rd intersection. The property, comprising four parcels, totals 1.32 acres, offering ample parking and ingress/egress from both W. Saginaw and N Dibble Ave. The location is suitable for various fast-casual restaurant concepts, including fast-food, coffee shops, and sandwich shops. It is easily accessible to nearby residential areas and a new multi-family/commercial development at the corner of Waverly and Saginaw. Located across from West Saginaw Plaza, the surrounding area includes Arby's, Advance Auto Parts, Little Caesars Pizza, CVS Pharmacy, Walgreen's, Wendy's, AutoZone, Popeye's and JoAnn Fabric. The existing tenant has occupied the 2,856 square foot building for 10 years.
Key Highlights
- Prime location on W. Saginaw Hwy next to McDonald's
- Free‑standing restaurant with drive‑thru
- High‑traffic area with excellent visibility and accessibility
Financial Insights
Estimated NOI and Cap Rate
NOI / Yr
$30,536
Cap Rate
3.43%
Suggested Prices Based on Cap Rates
Cap Rate 5%
$610,720
$610.7K
Cap Rate 7%
$436,229
$436.2K
Cap Rate 9%
$339,289
$339.3K
Market Conditions
NOI Build-Up for 2,856 SF
Gross rent
$46.3K $16.20/SF
− Vacancy
−$5.6K −$1.94/SF
EGI
$40.7K $14.26/SF
− OpEx
−$10.2K −$3.56/SF
NOI
$30.5K $10.69/SF
Area
Lansing, MI
Vacancy
12.00%
Lease Rate
$16.20 /SF/Yr
Expense Ratio
25.00%
Simulate Cap Rate and NOI
Suggested Prices Based on Cap Rates
Cap Rate 5%
$610,720
Cap Rate 7%
$436,229
Cap Rate 9%
$339,289
Alternative Uses
Best Use
Specialty Retail
$436.2K
$381.7K – $508.9K
NOI $30,536 @ 7.0% cap · market cap 3.43%
Second Best
—
—
no second resolved use
Theoretical Best
Office A
$587.9K
$514.4K – $685.9K
NOI $41,152 @ 7.0% cap · market cap 4.63%
Zoning and permitted uses should be independently verified with authorities.
How Realmo checks its estimates
Property Analytics
Unlock full access to Insights
Subscribe to Realmo Intelligence
Open Analytics
Current Use
Location Intelligence
Trade Area within ½ mile
457
Businesses Nearby
Explore this area
Business Placement
Demographics for 48917, MI
32,679
Population
15,975
Households
2
Avg Household Size
41
Median Age
40%
College-Educated
94%
High-School Grad
24.0 sq mi
ZIP Area
1,362
Density / Sq Mi
$73,259
Median Household Income
$47,739
Median Earnings
$1,085
Median Rent
$211,300
Median Home Value
Check the figures for this property
Cap Rate, Value Estimation, Potential NOI and more
View Realmo Analytics


Frequently Asked Questions
What type of property is this?
Drive through restaurant - Free-standing restaurant with drive-thru on 1.32 acres.
Where is this drive through restaurant located?
The property is located at 4021 W Saginaw Hwy Lansing, MI.
What is the asking price?
The asking price for this property is $889,000.
What are key features of this property?
This property features: Prime location on W. Saginaw Hwy next to McDonald's; Free‑standing restaurant with drive‑thru; High‑traffic area with excellent visibility and accessibility


