Legal Four-Family
For Sale
Contact for pricing
898 Hancock Street, Brooklyn, NY 11233
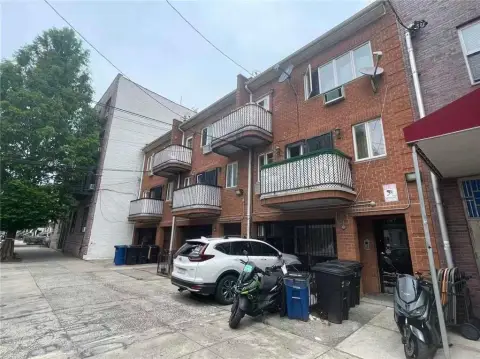
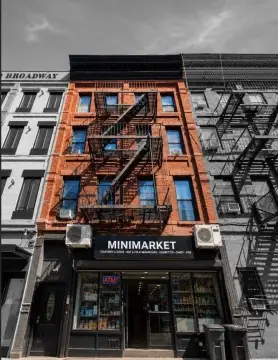
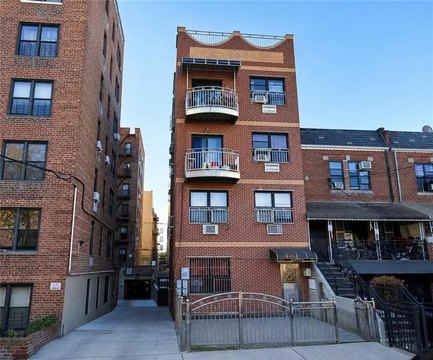
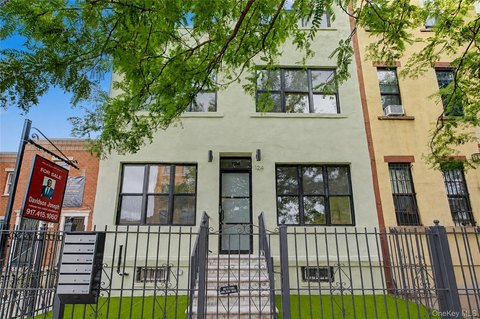
Fully vacant four-family building with a Certificate of Occupancy issued in 2005 and a 2,000 SF garden floor.
Property Size6,110 SF
Price / SF$425.53
Days on Market172
Property Features for 898 Hancock Street
General Information
Standard status
Active
Size
6,110 SF
Property subtype
Multifamily
Zoning
R6B
Investment Type
Value Add
Additional Details
Clear Height
7 ft
Multifamily Units
4
Building Details
Year Built
2005
Buildings
1
Units
4
Listing Agency:
Marcus & Millichap - Manhattan
Listed By:
Andrew Bronsteen · License #NY10401314581
Source:
Crexi
Added: May 5
Changed: Oct 11
Last Checked: Oct 23 at 4:11AM
Displayed information is deemed reliable but is not guaranteed and should be independently verified. All listing content including descriptions, pricing, images are the copyrighted material of Marcus & Millichap - Manhattan

Ask AI about this property
Review the available facts, identify missing information and prepare questions for the agent.
Investment Insights
Based on property information with market context.
898 Hancock Street presents a fully vacant, legal four-family building in Brooklyn, delivered completely empty for immediate control. The property is 26.67 feet wide and includes a Certificate of Occupancy issued in 2005, reducing uncertainty commonly associated with older multifamily buildings.
The building provides 6,110 square feet plus an additional 2,000 SF garden floor with 7’ ceilings. This layout offers substantial interior depth and ceiling height in the garden level, supporting a range of renovation and reconfiguration options.
The building is located near the J and Z trains, with direct access to Manhattan while remaining in a neighborhood context where renovated multifamily product is actively pursued. The combination of legal configuration, vacancy at delivery, and sizable total area makes this a straightforward acquisition for buyers seeking a four-family asset ready for renovation or conversion planning.
The building provides 6,110 square feet plus an additional 2,000 SF garden floor with 7’ ceilings. This layout offers substantial interior depth and ceiling height in the garden level, supporting a range of renovation and reconfiguration options.
The building is located near the J and Z trains, with direct access to Manhattan while remaining in a neighborhood context where renovated multifamily product is actively pursued. The combination of legal configuration, vacancy at delivery, and sizable total area makes this a straightforward acquisition for buyers seeking a four-family asset ready for renovation or conversion planning.
Key Highlights
- Fully vacant legal four‑family building in Brooklyn with a Certificate of Occupancy issued in 2005.
- Delivered empty with no tenants in place.
- 26.67' wide building with 6,110 SF plus a 2,000 SF garden floor featuring 7' ceilings.
Financial Insights
Estimated NOI and Cap Rate
NOI / Yr
$213,983
Cap Rate
8.23%
Suggested Prices Based on Cap Rates
Cap Rate 5%
$4,279,660
$4.3M
Cap Rate 7%
$3,056,900
$3.1M
Cap Rate 9%
$2,377,589
$2.4M
Market Conditions
NOI Build-Up for 6,110 SF
Gross rent
$311.6K $51.00/SF
− Vacancy
−$5.9K −$0.97/SF
EGI
$305.7K $50.03/SF
− OpEx
−$91.7K −$15.01/SF
NOI
$214.0K $35.02/SF
Area
Brooklyn, NY
Vacancy
1.90%
Lease Rate
$51.00 /SF/Yr
Expense Ratio
30.00%
Simulate Cap Rate and NOI
Suggested Prices Based on Cap Rates
Cap Rate 5%
$4,279,660
Cap Rate 7%
$3,056,900
Cap Rate 9%
$2,377,589
Alternative Uses
Best Use
Multifamily LT 5
$3.06M
$2.67M – $3.57M
NOI $213,983 @ 7.0% cap · market cap 8.23%
Second Best
Apartment 5plus
$2.66M
$2.33M – $3.11M
NOI $186,532 @ 7.0% cap · market cap 7.17%
Theoretical Best
Specialty Retail
$5.06M
$4.43M – $5.90M
NOI $354,136 @ 7.0% cap · market cap 13.62%
Zoning and permitted uses should be independently verified with authorities.
How Realmo checks its estimates
Property Analytics
Unlock full access to Insights
Subscribe to Realmo Intelligence
Open Analytics
Lease Details
7 ft
Clear height
4
Residential units
Location Intelligence
Trade Area within ½ mile
3,625
Businesses Nearby
Explore this area
Business Placement
Demographics for 11233, NY
75,399
Population
34,412
Households
2.2
Avg Household Size
35
Median Age
33%
College-Educated
86%
High-School Grad
1.3 sq mi
ZIP Area
57,999
Density / Sq Mi
$62,034
Median Household Income
$47,149
Median Earnings
$1,613
Median Rent
$1,013,000
Median Home Value
Check the figures for this property
Cap Rate, Value Estimation, Potential NOI and more
View Realmo Analytics
Market
Vacancy Rate% for Multifamily in Northeast region




Frequently Asked Questions
What type of property is this?
Quadplex - Fully vacant four-family building with a Certificate of Occupancy issued in 2005 and a 2,000 SF garden floor.
Where is this quadplex located?
The property is located at 898 Hancock Street Brooklyn, NY.
What is the asking price?
The asking price for this property is $2,600,000.
What are key features of this property?
This property features: Fully vacant legal four‑family building in Brooklyn with a Certificate of Occupancy issued in 2005.; Delivered empty with no tenants in place.; 26.67' wide building with 6,110 SF plus a 2,000 SF garden floor featuring 7' ceilings.


