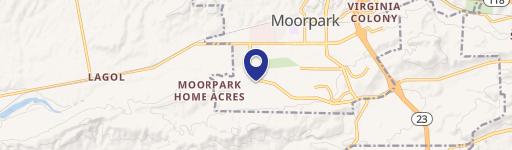
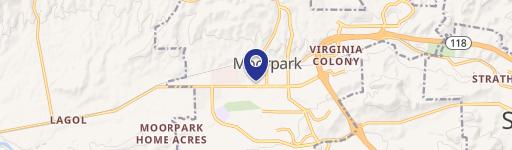
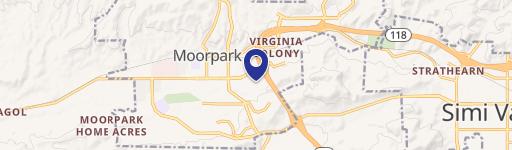
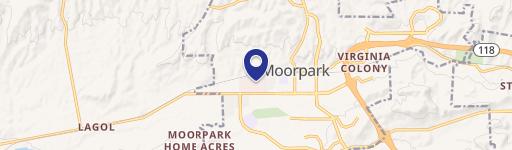
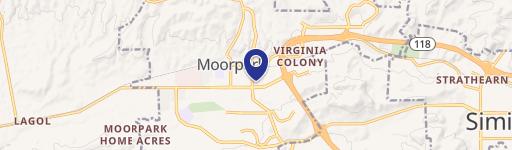
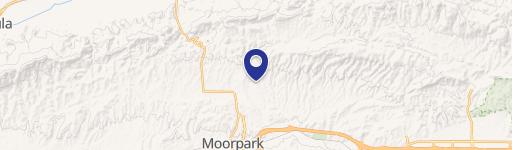
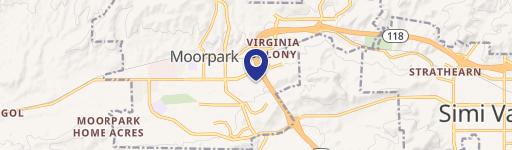
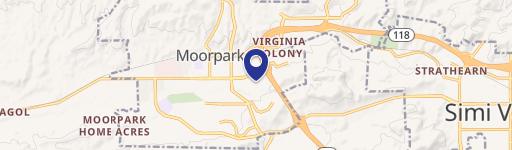
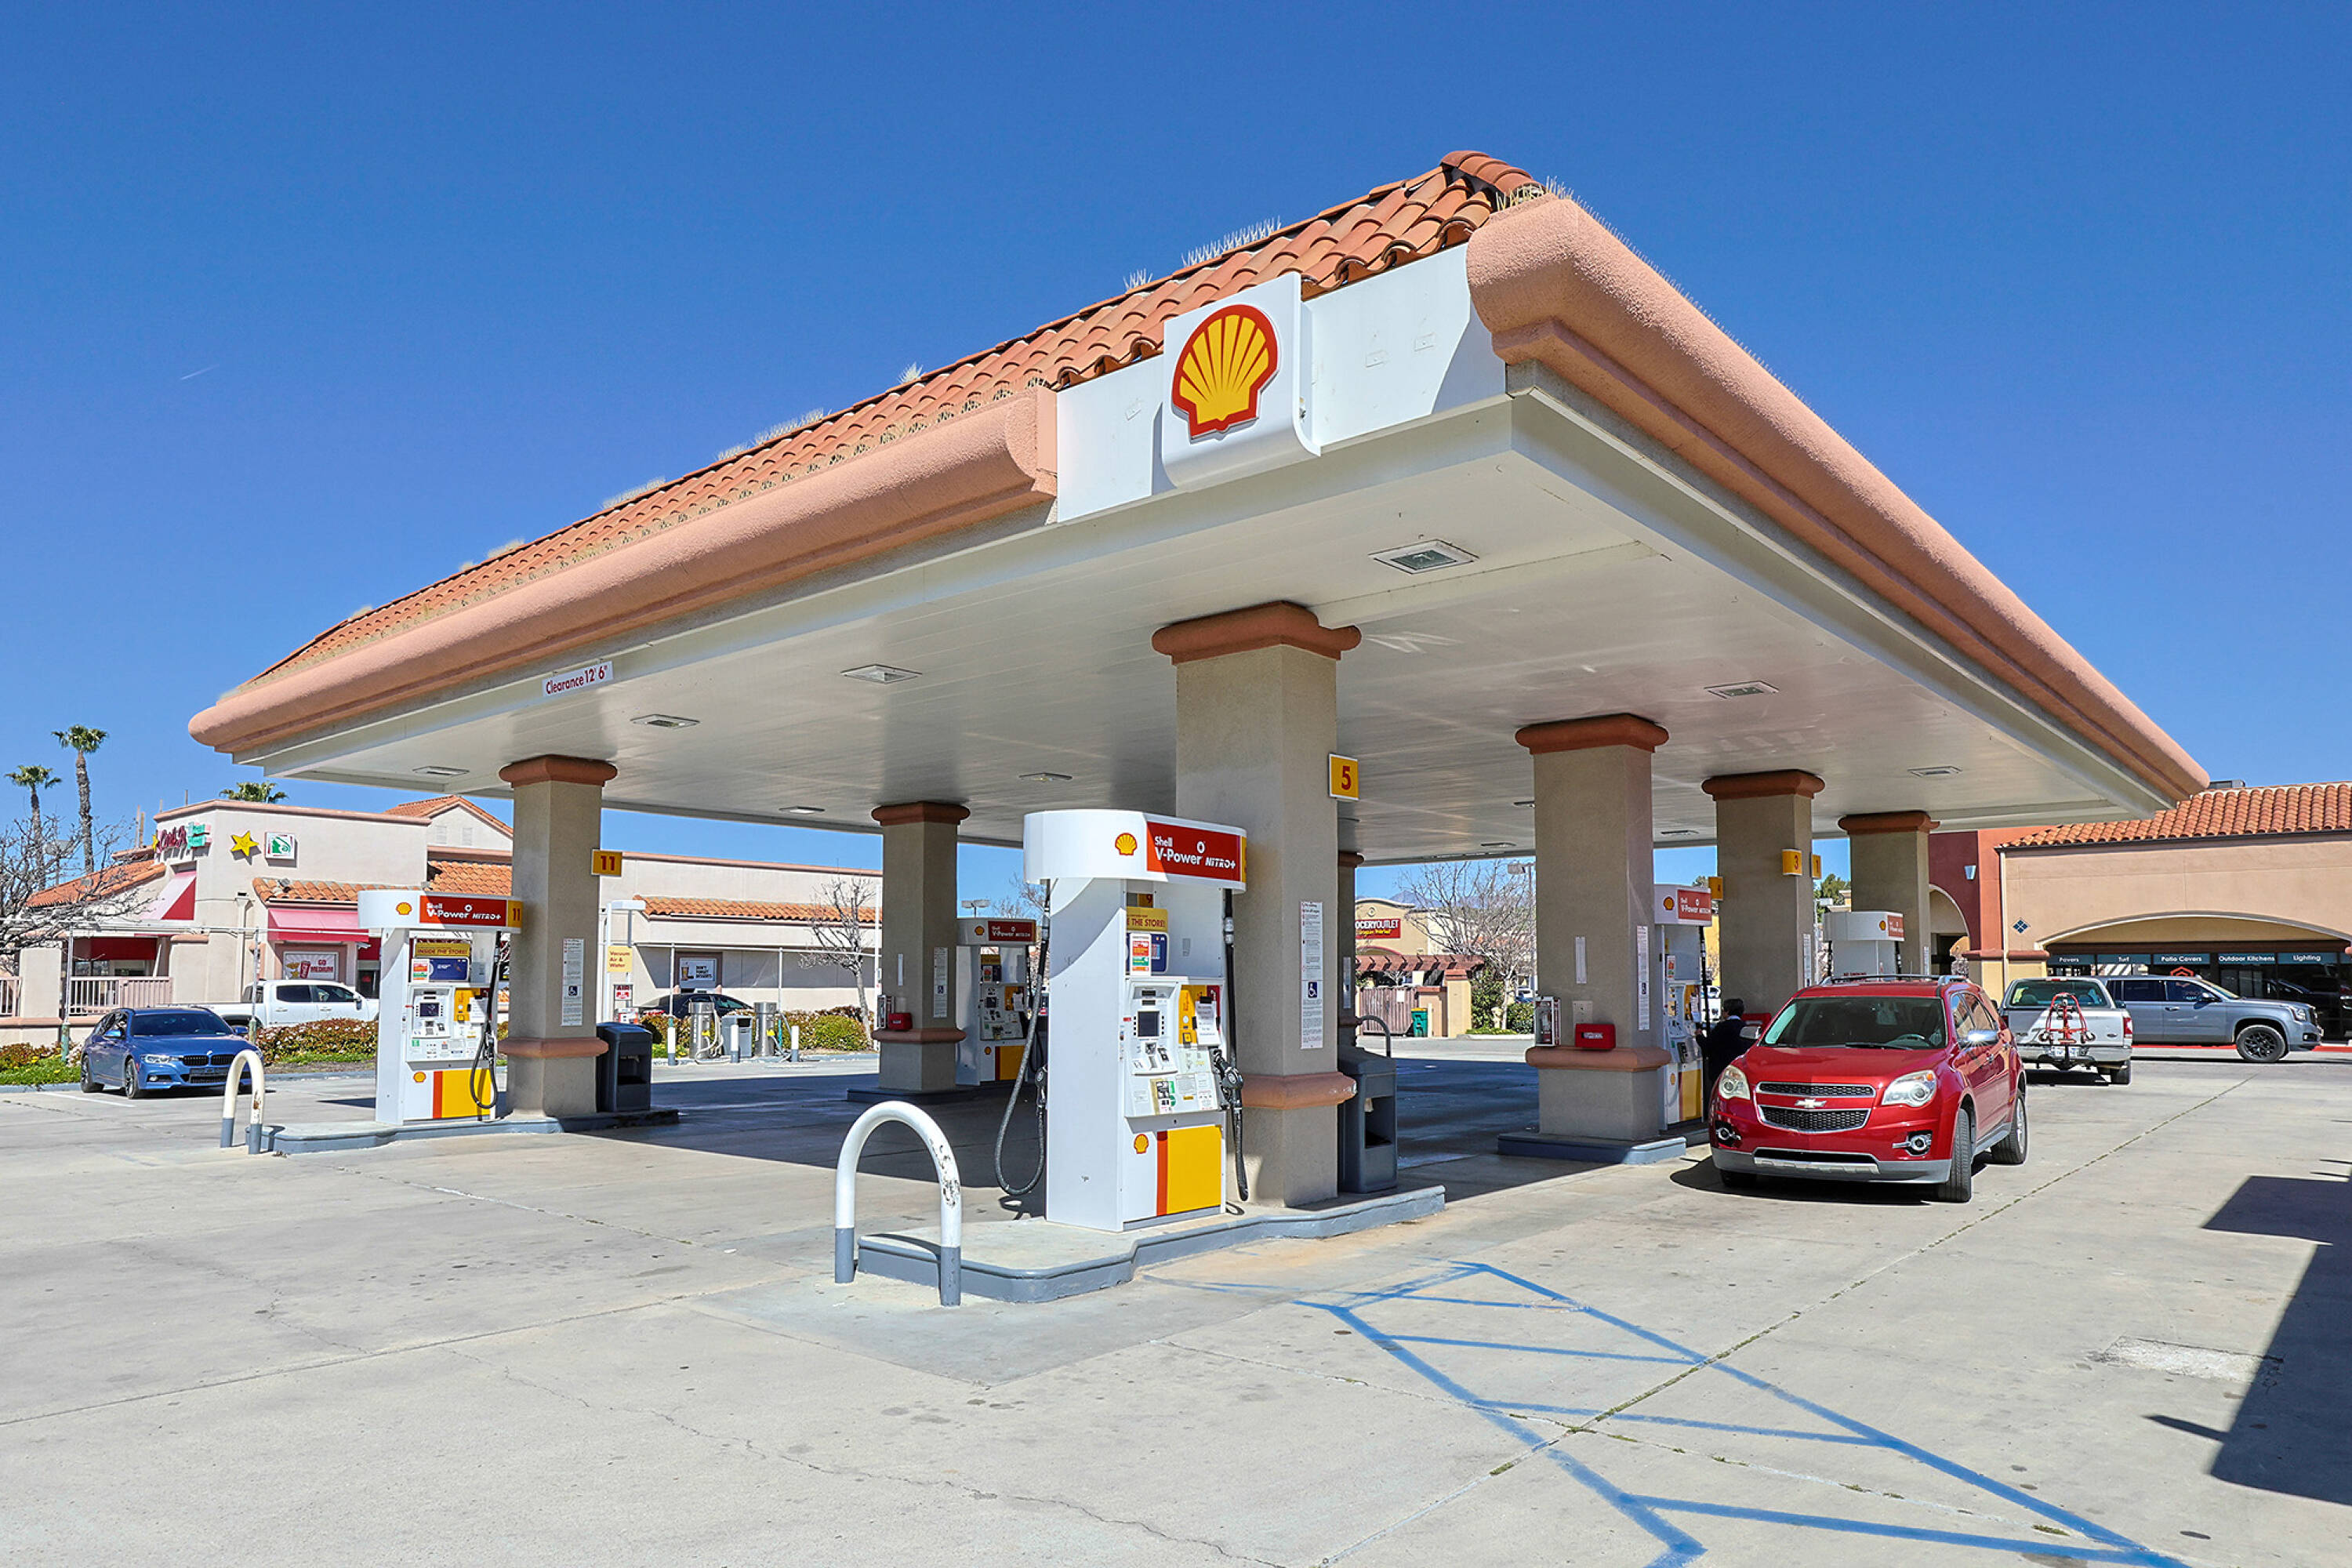
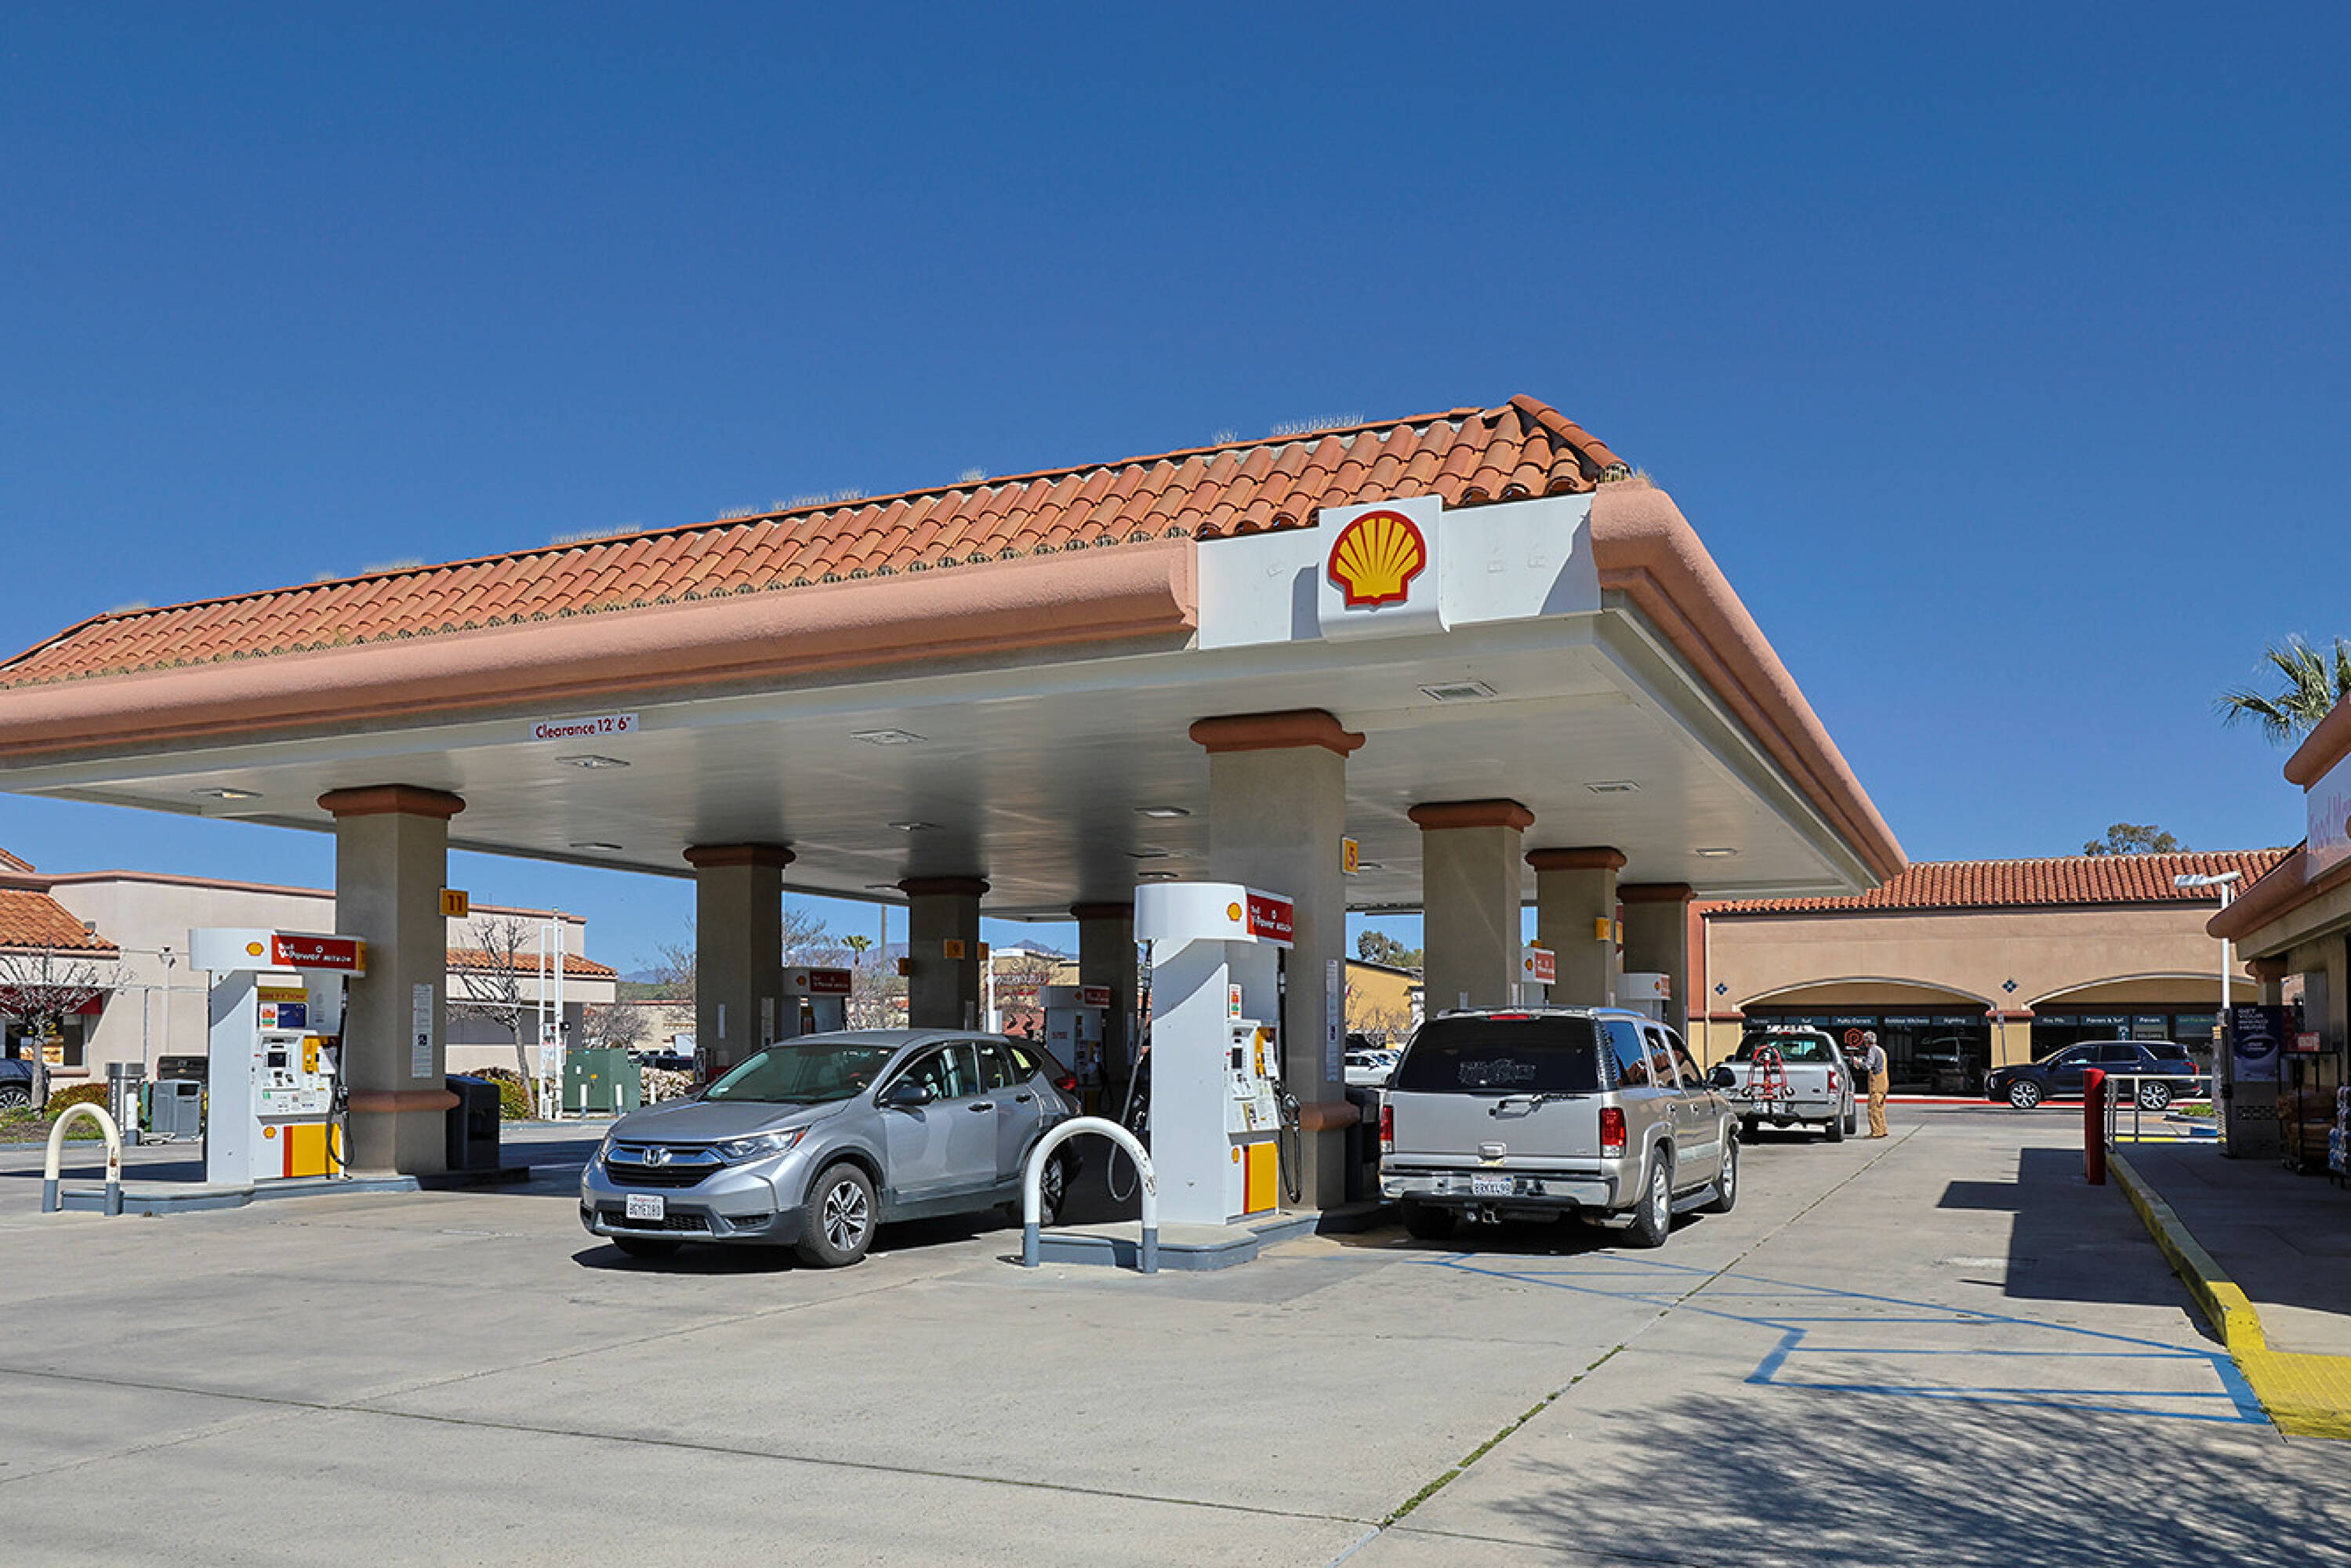
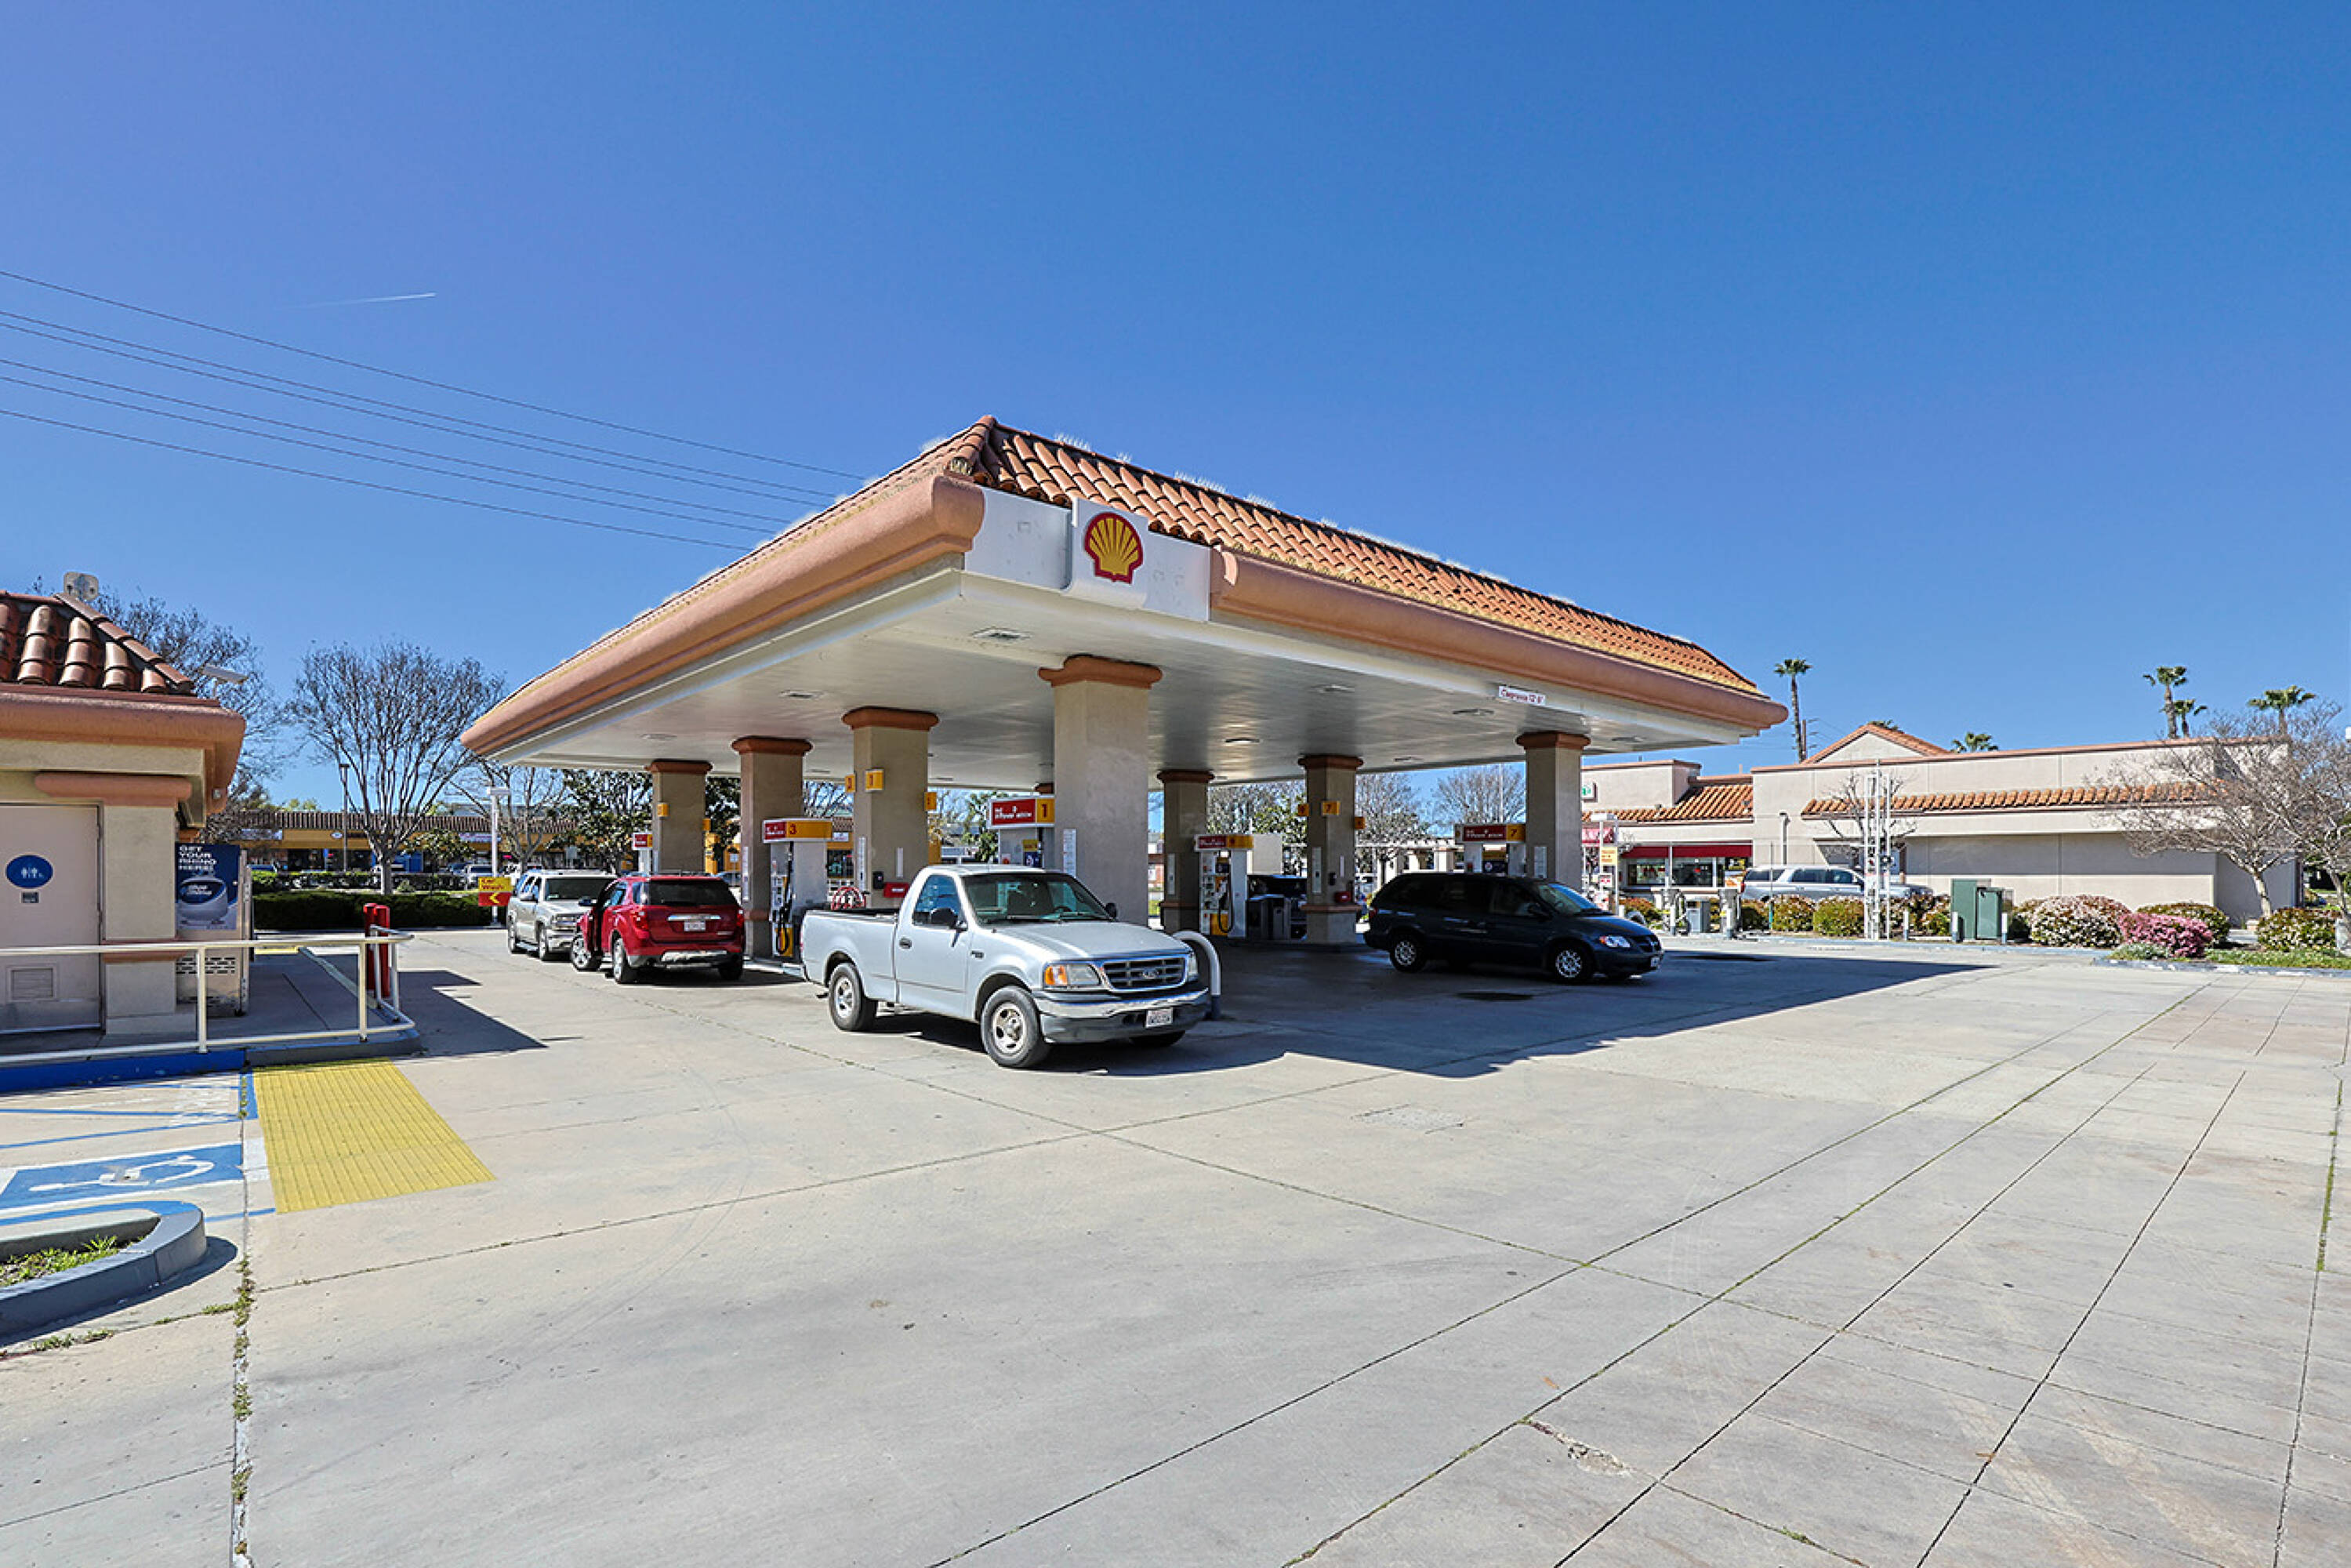
301 Los Angeles Ave, Moorpark, CA 93021
NNN leased Shell gas station with 7-Eleven guarantee.
- Added:
- May 17, 2023
- Days on Market:
- 1116
- Last Refresh:
- May 12 at 10:59 pm
Property Features for 301 Los Angeles Ave
General Information
- Standard status
- Active
- Size
- 2,300 SF
- Lot size
- 0.74 Acres
- Property subtype
- Retail
Building Details
- Year Built
- 1992

Listing agent Kyle Miller License #CA 01716644
Listing office Newmark | Los Angeles - Downtown
Listing date May 17, 2023
Source Crexi
Displayed information is deemed reliable but is not guaranteed and should be independently verified.
All listing content including descriptions, pricing, images are the copyrighted material of Newmark | Los Angeles - Downtown
HighLights
- NNN Ground Lease with Investment Grade Tenant (S&P: AA-) Shell, guaranteed by 7‑Eleven, Inc.
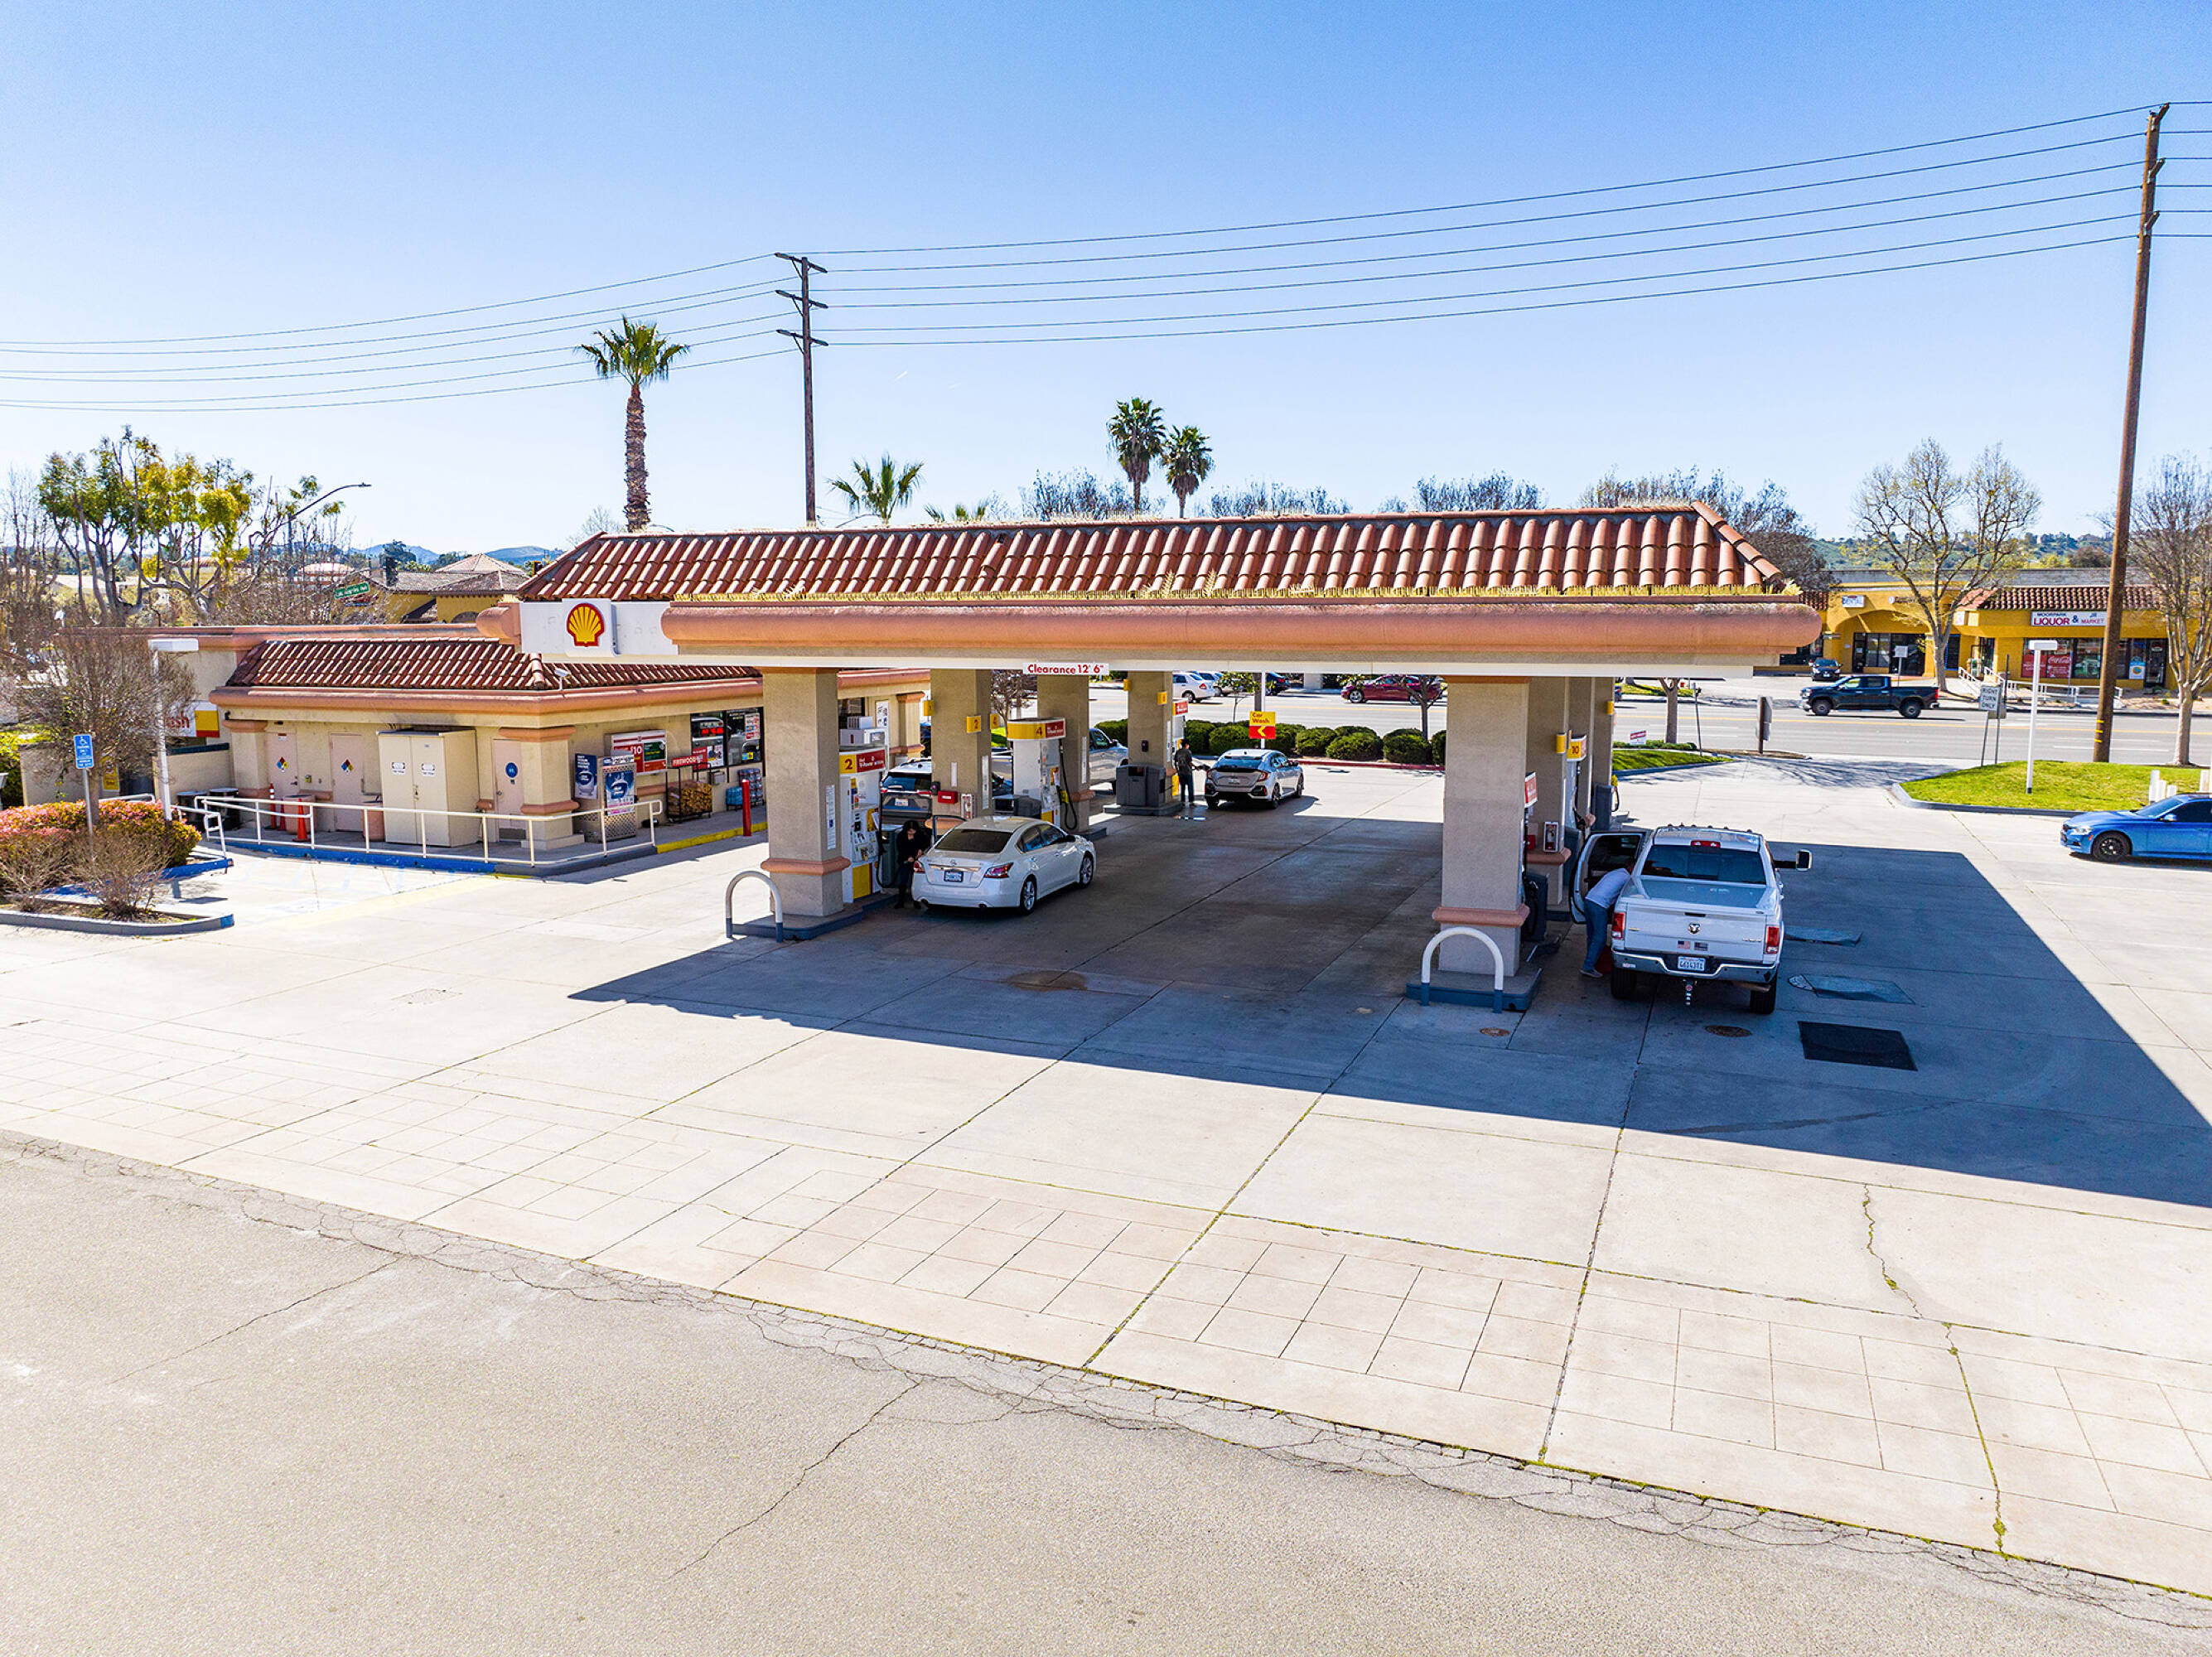
- Located on a signalized hard corner in affluent Moorpark, CA with high average household incomes.
- Recently extended 10‑year lease with two (2) five (5) year options at FMV.
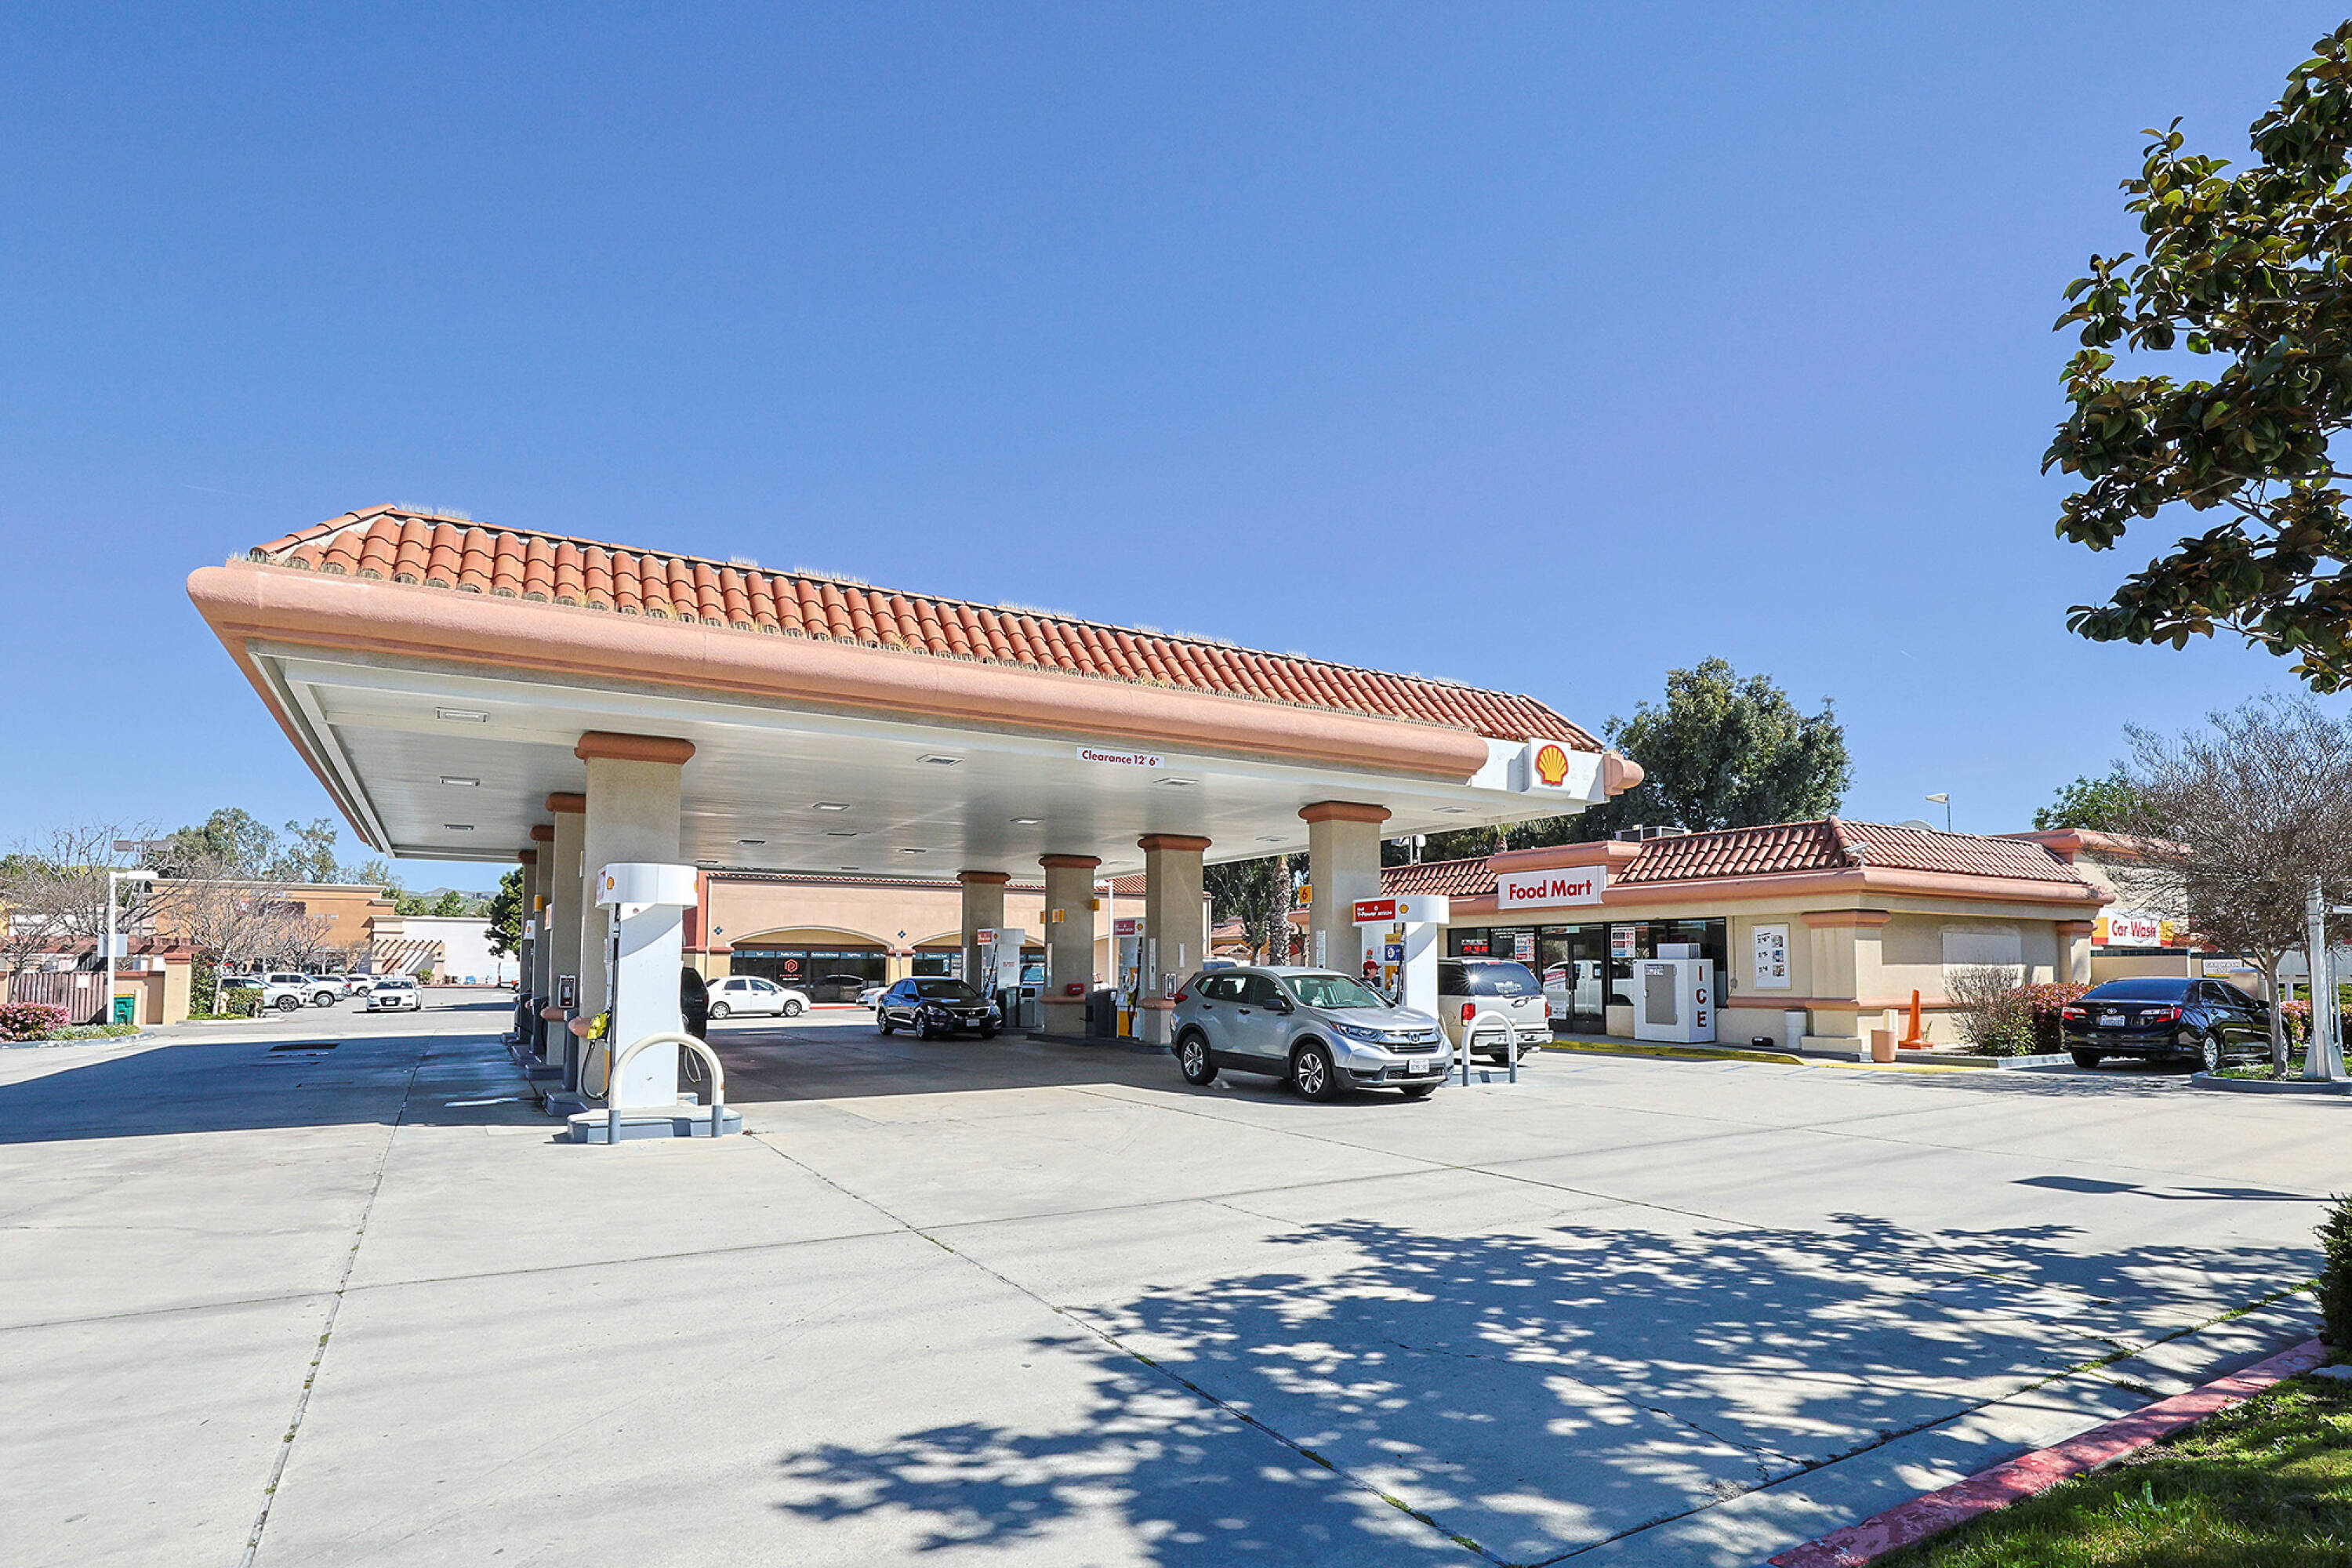
- Seasoned location operating since 1992, featuring ten gas pumps, convenience store, and car wash.
- Lease features 3% annual increases, providing a hedge against inflation.
- Located on the primary corner outparcel to Mission Bell Plaza, a 113,682 sf shopping center with strong co‑tenancy.
Overview
Current Use by Public Records
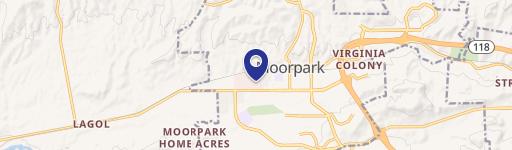
Location Insight
- Map
- Local Demand
- City
- Moorpark
- County
- Ventura
- State
- California
- Longitude
- -118.8858632
- Latitude
- 34.2793262