Three-Unit Mixed-Use
For Sale
$1,850,000
88-22 Roosevelt Avenue, Jackson Heights, NY 11372
Commercial Sale, Jackson Heights, NY
Property Size2,818 SF
Lot Size0.03 Acres
Price / SF$656.49
Days on Market395
Property Features for 88-22 Roosevelt Avenue
General Information
Property type
Commercial Sale
Property subtype
Other
Zoning description
Commercial
Bathrooms
3
Half bathrooms
3
Rooms
Bathroom 2, Bathroom 3, Bathroom 1
Subdivision
Jackson Heights
Directions
Off Elmhurst Avenue between Brooklyn Queens expressway and Junction blvd.
Standard status
Active
APN
01510-0064
Lot size
0.03 Acres
Taxes and HOA fees
Tax Annual Amount
26956
Utilities
Water source
Public
Building Details
Year built
1989
Floors in Building
2
Building materials
Masonite, Brick
Listing Agency:
HANMI REALTY
(718) 961-8801
Listed By:
Mi Ryoung Chong
(718) 961-8000
Added: Sep 6, 2025
Changed: Oct 1
Last Checked: Oct 5 at 4:06AM
MLS# 11570166
Copyright © 2026 My State MLS. All rights reserved. All information provided by the listing agent/broker is deemed reliable but is not guaranteed and should be independently verified.
Investment Insights
Based on property information with market context.
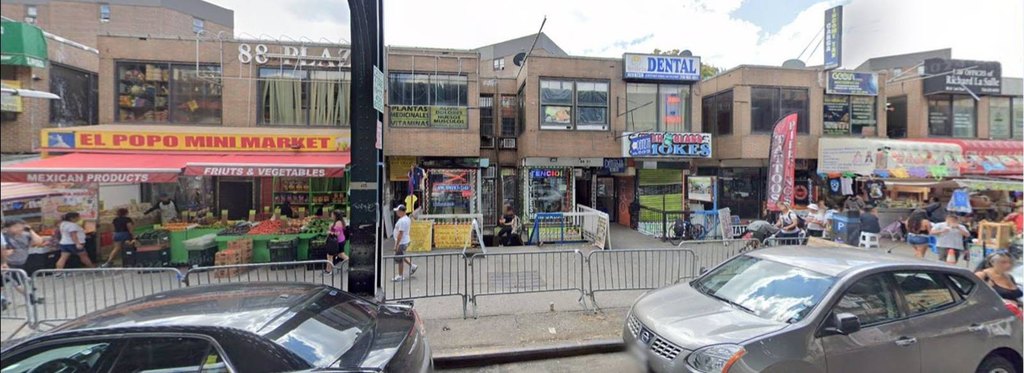
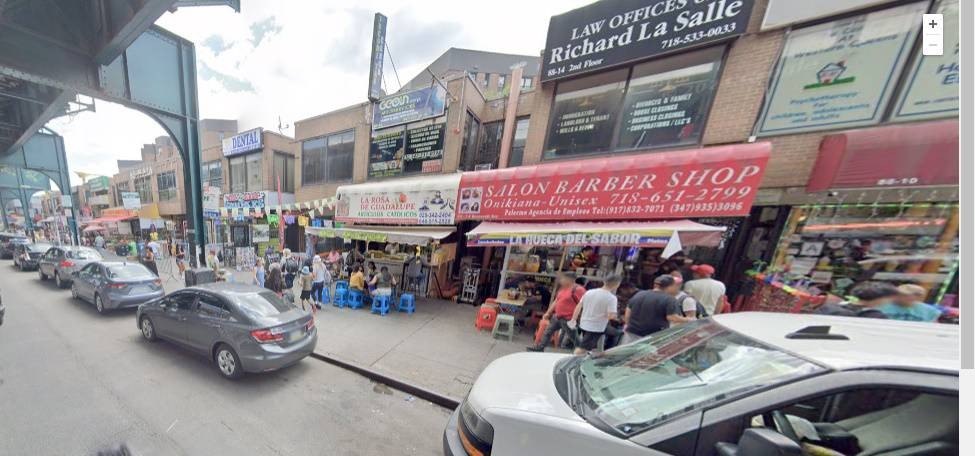
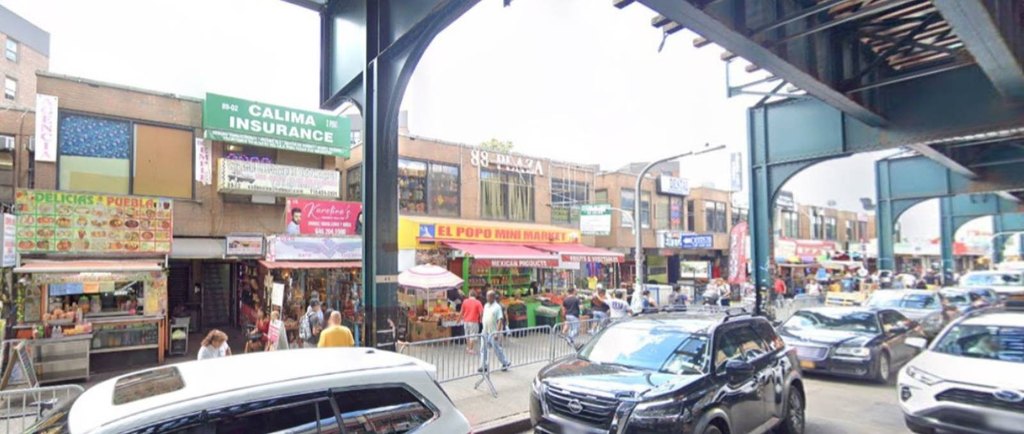
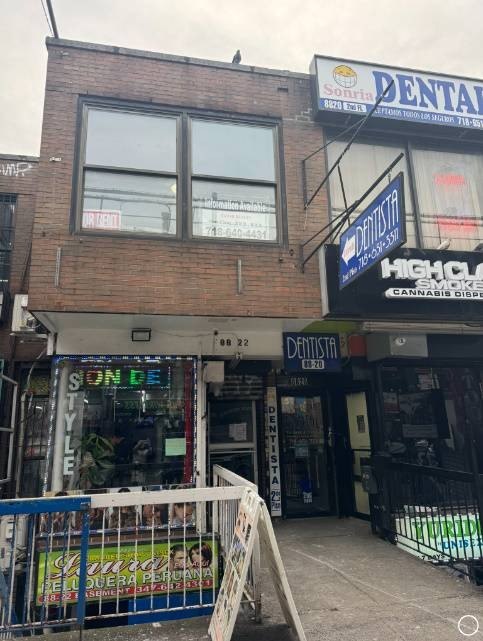
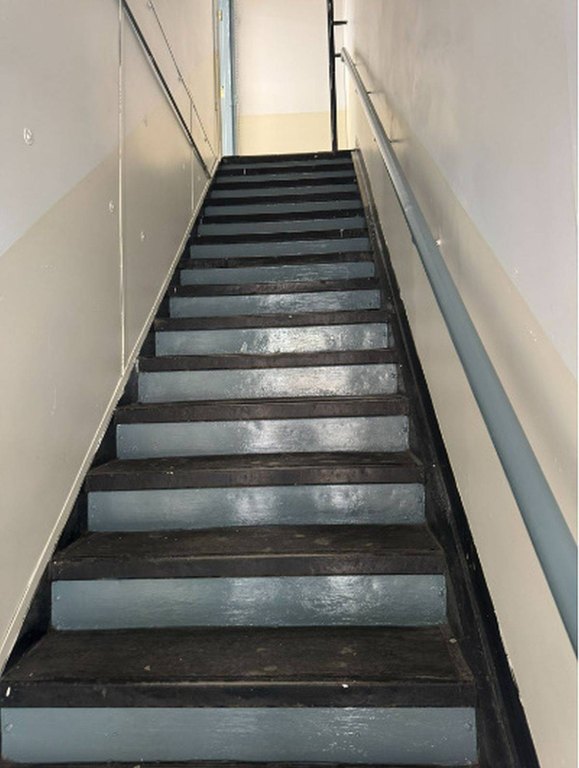
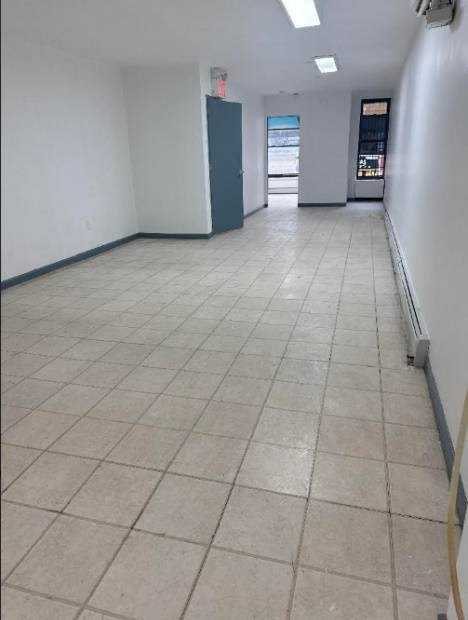
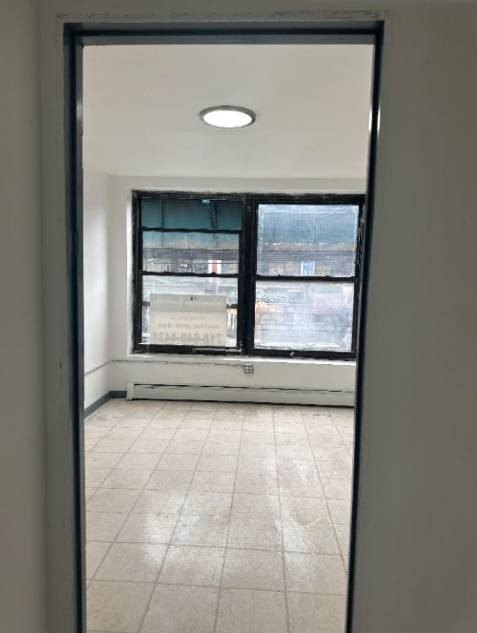
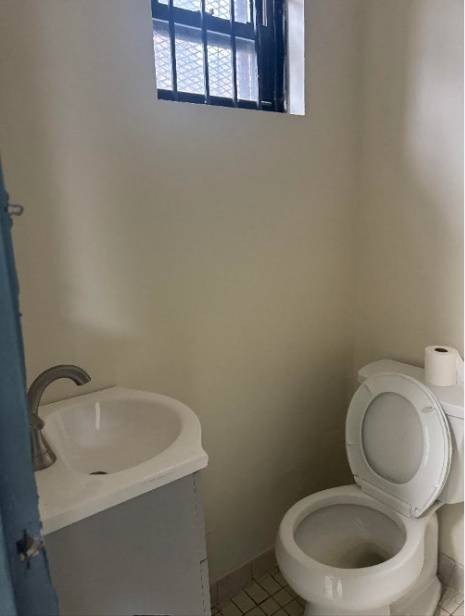
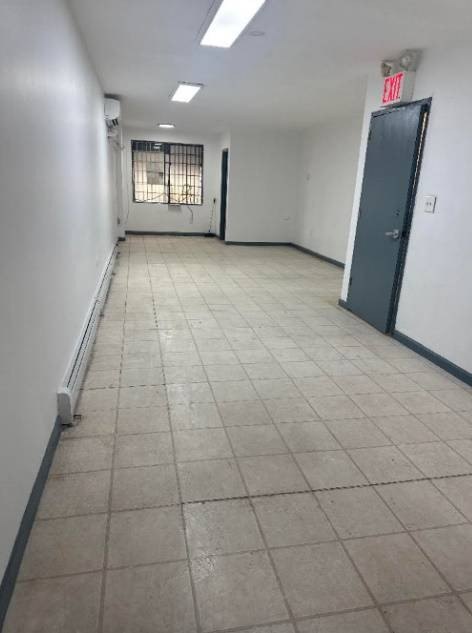
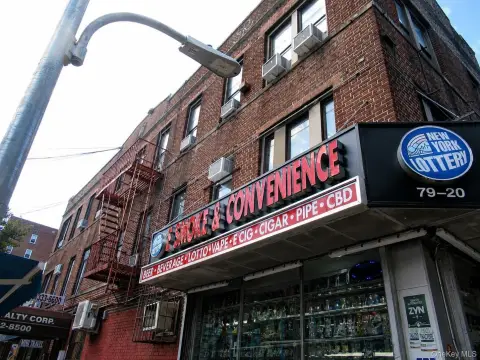
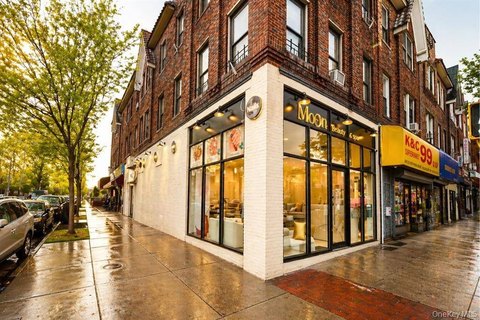
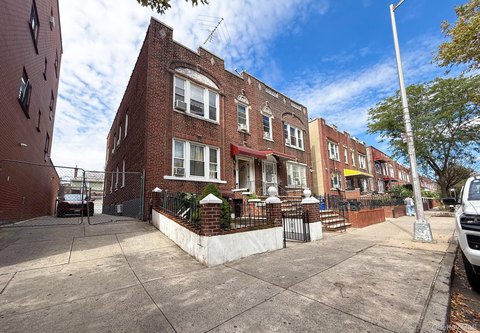
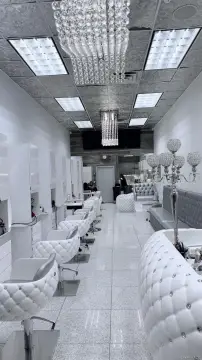
This multi-story mixed-use property contains approximately 2,818 square feet across three commercial units, including a street-level beauty salon, a cellar tenant area, and a second-floor real estate office. The building was constructed in 1989 and features fresh paint, tile flooring, three bathrooms, public water service, and brick and Masonite construction. The property is fully occupied and produces a 6.5% cap rate. It is offered in as-is condition.
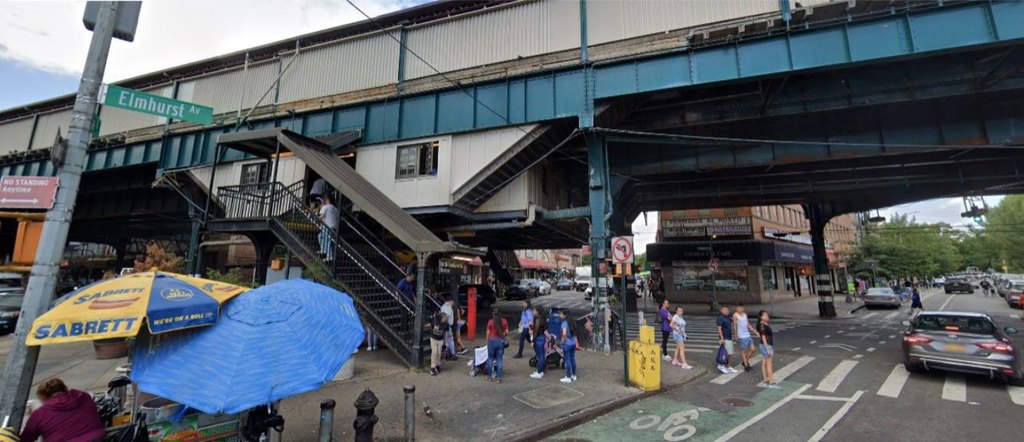
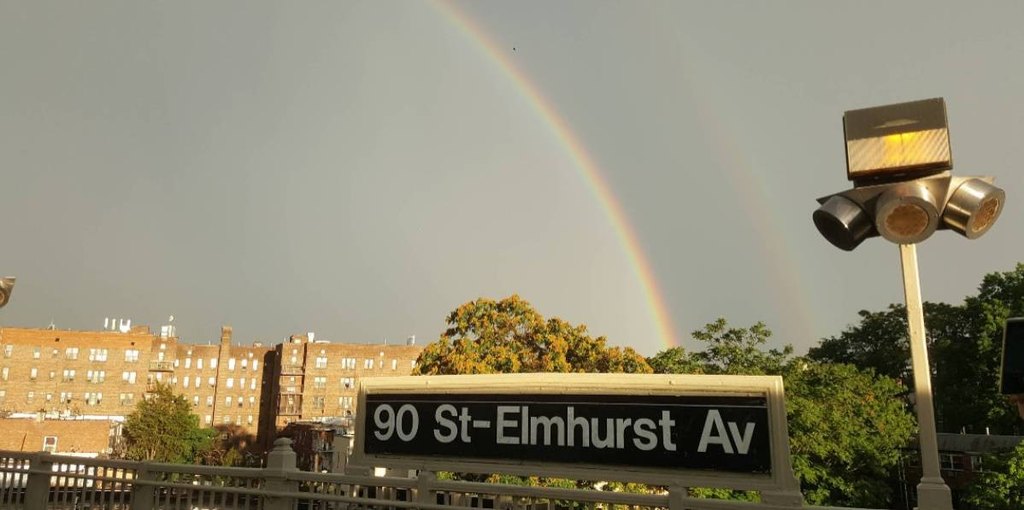
The 1,093-square-foot lot is located at 88-22 Roosevelt Avenue in Jackson Heights, with C2-3 and R6 zoning. The site is near the 7 train at 90th Street and Elmhurst Avenue, as well as the 74th Street and Roosevelt Avenue transit hub serving the E, F, M, and R subway lines. Additional bus connections include the Q29, Q32, Q33, Q49, Q53, Q72, and Q70. The property also has access to nearby shops, restaurants, medical facilities, supermarkets, and pharmacies.
The 1,093-square-foot lot is located at 88-22 Roosevelt Avenue in Jackson Heights, with C2-3 and R6 zoning. The site is near the 7 train at 90th Street and Elmhurst Avenue, as well as the 74th Street and Roosevelt Avenue transit hub serving the E, F, M, and R subway lines. Additional bus connections include the Q29, Q32, Q33, Q49, Q53, Q72, and Q70. The property also has access to nearby shops, restaurants, medical facilities, supermarkets, and pharmacies.
Key Highlights
- Approximately 2,818 square feet across three commercial units
- Fully occupied with a 6.5% cap rate
- Street‑level retail, cellar space, and second‑floor office configuration
Property Analytics
Unlock full access to Insights
Subscribe to Realmo Intelligence
Open Analytics
Current Use
Lease Details
1
Office units
12,000 VPD
Traffic count
100%
Occupancy
Multi-tenant
Tenancy
Yes
Highway access
Yes
Paved road access
Location Intelligence
Trade Area within ½ mile
7,971
Businesses Nearby
312k
Monthly Visits Nearby
Explore this area
Business Placement
Foot Traffic Nearby
Groceries 32%
Shops & Services 30%
Dining 26%
Apparel 8%
Food Bazaar Supermarket
Groceries
60,054 visits/mo
0.4 miles
McDonald's
Dining
24,424 visits/mo
0.2 miles
Chase Bank
Shops & Services
20,943 visits/mo
0.5 miles
Old Navy
Apparel
20,466 visits/mo
0.3 miles
Citibank
Shops & Services
17,304 visits/mo
0.3 miles
Demographics for 11372, NY
68,000
Population
26,613
Households
2.6
Avg Household Size
41
Median Age
35%
College-Educated
81%
High-School Grad
0.7 sq mi
ZIP Area
97,143
Density / Sq Mi
$77,133
Median Household Income
$44,415
Median Earnings
$1,795
Median Rent
$454,400
Median Home Value
Check the figures for this property
Cap Rate, Value Estimation, Potential NOI and more
View Realmo Analytics
Market
Vacancy Rate% for Retail in Northeast region

Questions? Ask Rey
Realmo’s AI knows this listing — price, zoning, demand, history. Ask anything.




Frequently Asked Questions
What type of property is this?
Mixed-use property - Fully occupied commercial building with retail, office, and cellar space near the 7 train and multiple transit connections.
Where is this mixed-use property located?
The property is located at 88-22 Roosevelt Avenue Jackson Heights, NY.
What is the asking price?
The asking price for this property is $1,850,000.
What are key features of this property?
This property features: Approximately 2,818 square feet across three commercial units; Fully occupied with a 6.5% cap rate; Street‑level retail, cellar space, and second‑floor office configuration


