Auto Shop and Repair
For Sale
$475,000
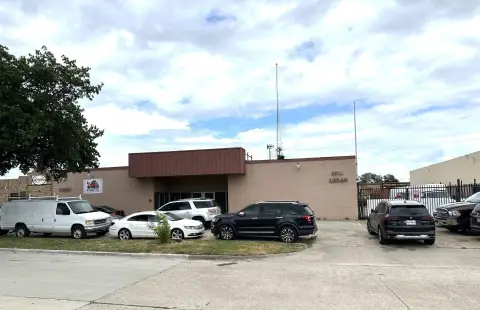
8632 San Marino Ave, Dallas, TX 75217
Highway access improvements would require approval from the city or TXDOT.
Property Size2,000 SF
Price / SF$237.50
Days on Market51
Property Features for 8632 San Marino Ave
General Information
Standard status
Active
Size
2,000 SF
Building Details
Year Built
1990
Listing Agency:
Sebastian Realty
Listed By:
Clarence Sebastian · License #0461005
(214) 673-1740
Source:
Yourdavisteam
Added: Aug 25
Changed: Oct 2
Last Checked: Oct 7 at 1:03PM
Displayed information is deemed reliable but is not guaranteed and should be independently verified. All listing content including descriptions, pricing, images are the copyrighted material of Sebastian Realty
Investment Insights
Based on property information with market context.
The property is currently used as an auto shop and repair facility and dates to 1990. The seller is in the process of clearing the property, which may affect the final site condition at closing.
There is no existing entrance cut-out from C F Hawn Fwy. Constructing access would require approval from the city or TXDOT. The property may also be repurposed for other commercial ventures under its existing zoning.
There is no existing entrance cut-out from C F Hawn Fwy. Constructing access would require approval from the city or TXDOT. The property may also be repurposed for other commercial ventures under its existing zoning.
Key Highlights
- Current use as an auto shop and repair facility
- Built in 1990
- No existing entrance cut‑out from C F Hawn Fwy
Financial Insights
Estimated NOI and Cap Rate
NOI / Yr
$32,181
Cap Rate
6.77%
Suggested Prices Based on Cap Rates
Cap Rate 5%
$643,620
$643.6K
Cap Rate 7%
$459,729
$459.7K
Cap Rate 9%
$357,567
$357.6K
Market Conditions
NOI Build-Up for 2,000 SF
Gross rent
$48.2K $24.12/SF
− Vacancy
−$2.3K −$1.13/SF
EGI
$46.0K $22.99/SF
− OpEx
−$13.8K −$6.90/SF
NOI
$32.2K $16.09/SF
Area
ZIP 75217
Vacancy
4.70%
Lease Rate
$24.12 /SF/Yr
Expense Ratio
30.00%
Simulate Cap Rate and NOI
Suggested Prices Based on Cap Rates
Cap Rate 5%
$643,620
Cap Rate 7%
$459,729
Cap Rate 9%
$357,567
Alternative Uses
Best Use
Retail
$459.7K
$402.3K – $536.4K
NOI $32,181 @ 7.0% cap · market cap 6.77%
Second Best
Industrial
$180.3K
$157.7K – $210.3K
NOI $12,619 @ 7.0% cap · market cap 2.66%
Theoretical Best
Office A
$2.19M
$1.92M – $2.55M
NOI $153,238 @ 7.0% cap · market cap 32.26%
Zoning and permitted uses should be independently verified with authorities.
How Realmo checks its estimates
Property Analytics
Unlock full access to Insights
Subscribe to Realmo Intelligence
Open Analytics
Current Use
Location Intelligence
Trade Area within ½ mile
201
Businesses Nearby
Well-served
Demand for This Use
Explore this area
Business Placement
Demographics for 75217, TX
85,330
Population
25,534
Households
3.3
Avg Household Size
30
Median Age
6%
College-Educated
60%
High-School Grad
27.8 sq mi
ZIP Area
3,069
Density / Sq Mi
$52,987
Median Household Income
$35,106
Median Earnings
$1,189
Median Rent
$164,800
Median Home Value
Check the figures for this property
Cap Rate, Value Estimation, Potential NOI and more
View Realmo Analytics
Market
Vacancy Rate% for Retail in South region

Questions? Ask Rey
Realmo’s AI knows this listing — price, zoning, demand, history. Ask anything.


Similar Off Market Nearby
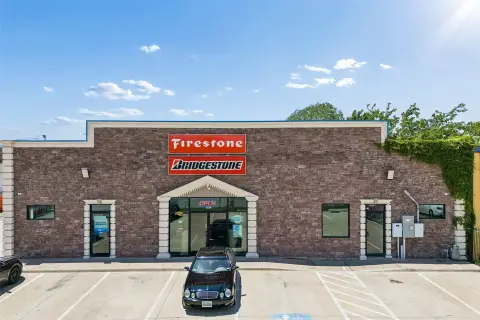
- GCR Auto Repair — 8423 Midland Ln, Dallas, TX 75217
- San Augustine Auto Repair — auto repair, 615 s st augustine dr, dallas, tx 75217
- ST. AUGUSTINE INSPECTION — 9531 C F Hawn Fwy, Dallas, TX 75217
- V8 Auto Service — 615 S St Augustine Dr Suite A, Dallas, TX 75217
- Near Towing — 615 S St Augustine Dr Suite A, Dallas, TX 75217
Frequently Asked Questions
What type of property is this?
Auto shop - Highway access improvements would require approval from the city or TXDOT.
Where is this auto shop located?
The property is located at 8632 San Marino Ave Dallas, TX.
What is the asking price?
The asking price for this property is $475,000.
What are key features of this property?
This property features: Current use as an auto shop and repair facility; Built in 1990; No existing entrance cut‑out from C F Hawn Fwy