Automotive Tire Service
For Sale
Contact for pricing
86 Van Duzer Street, Staten Island, NY 10301
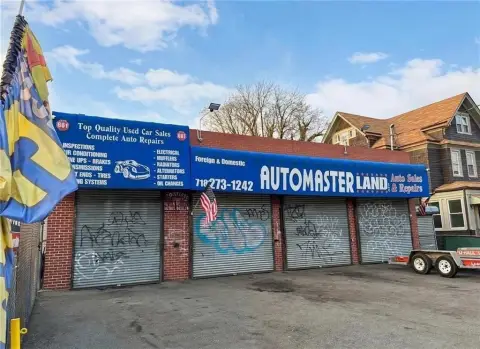
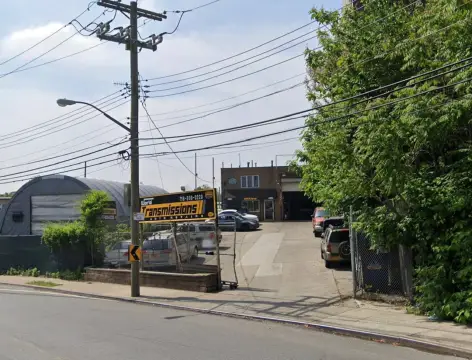
Long-established tire and service center operating since 1983, with lift equipment and inspection machinery.
Property Size2,900 SF
Price / SF$688.97
Days on Market187
Property Features for 86 Van Duzer Street
General Information
Standard status
Active
Size
2,900 SF
Property subtype
Business for Sale, Retail
Zoning
COMM
Additional Details
Business Included
Yes
Service Bays
5
Building Details
Year Built
1930
Buildings
1
Units
1
Listing Agency:
Robert DeFalco Realty, Inc.
Listed By:
Matthew Black · License #30BL0977236
(917) 685-1492
Source:
Crexi
Added: Apr 23
Changed: Oct 26
Last Checked: Oct 24 at 4:24PM
Displayed information is deemed reliable but is not guaranteed and should be independently verified. All listing content including descriptions, pricing, images are the copyrighted material of Robert DeFalco Realty, Inc.

Ask AI about this property
Review the available facts, identify missing information and prepare questions for the agent.
Investment Insights
Based on property information with market context.
This automotive service and tire shop is offered as a rare ownership opportunity with the business and property available together. The 3000-square-foot building supports an established New York Tire Company and service center that has been operating since 1983. Included are five lift machines and an inspection machine, with the business value noted separately.
The property is located at 86 Van Duzer Street on Staten Island, NY 10301. Public remarks also indicate that the adjacent property at 89 Van Duzer St, located across the way, may be considered for sale if desired.
For buyers seeking an ongoing operation, the configuration includes the shop building plus the listed service equipment and inspection capability supporting day-to-day automotive tire and service work.
The property is located at 86 Van Duzer Street on Staten Island, NY 10301. Public remarks also indicate that the adjacent property at 89 Van Duzer St, located across the way, may be considered for sale if desired.
For buyers seeking an ongoing operation, the configuration includes the shop building plus the listed service equipment and inspection capability supporting day-to-day automotive tire and service work.
Key Highlights
- 3,000 SF building; operating tire and service center with long‑time business established in 1983
- Includes 5 lift machines and inspection machinery
- New York Tire Company and service center business with separate asking price of $998,000
Financial Insights
Estimated NOI and Cap Rate
NOI / Yr
$62,410
Cap Rate
3.12%
Suggested Prices Based on Cap Rates
Cap Rate 5%
$1,248,200
$1.2M
Cap Rate 7%
$891,571
$891.6K
Cap Rate 9%
$693,444
$693.4K
Market Conditions
NOI Build-Up for 2,900 SF
Gross rent
$97.4K $33.60/SF
− Vacancy
−$8.3K −$2.86/SF
EGI
$89.2K $30.74/SF
− OpEx
−$26.7K −$9.22/SF
NOI
$62.4K $21.52/SF
Area
Staten Island, NY
Vacancy
8.50%
Lease Rate
$33.60 /SF/Yr
Expense Ratio
30.00%
Simulate Cap Rate and NOI
Suggested Prices Based on Cap Rates
Cap Rate 5%
$1,248,200
Cap Rate 7%
$891,571
Cap Rate 9%
$693,444
Alternative Uses
Best Use
Retail
$891.6K
$780.1K – $1.04M
NOI $62,410 @ 7.0% cap · market cap 3.12%
Second Best
Industrial
$654.2K
$572.5K – $763.3K
NOI $45,797 @ 7.0% cap · market cap 2.29%
Theoretical Best
Office A
$1.38M
$1.21M – $1.61M
NOI $96,861 @ 7.0% cap · market cap 4.85%
Zoning and permitted uses should be independently verified with authorities.
How Realmo checks its estimates
Property Analytics
Contact the owner directly
Get the owner's phone numbers and email
Open Analytics
Current Use
Lease Details
5
Service bays
Turnkey business
Opportunity
Location Intelligence
Trade Area within ½ mile
1,711
Businesses Nearby
125k
Monthly Visits Nearby
Well-served
Demand for This Use
Explore this area
Business Placement
Foot Traffic Nearby
Dining 39%
Shops & Services 30%
Groceries 29%
Electronics 2%
Western Beef
Groceries
24,234 visits/mo
0.3 miles
McDonald's
Dining
21,227 visits/mo
0.4 miles
Wendy's
Dining
17,889 visits/mo
0.1 miles
Mobil
Shops & Services
12,694 visits/mo
0.1 miles
Key Food
Groceries
12,025 visits/mo
0.2 miles
Demographics for 10301, NY
41,474
Population
16,631
Households
2.5
Avg Household Size
40
Median Age
38%
College-Educated
88%
High-School Grad
3.8 sq mi
ZIP Area
10,914
Density / Sq Mi
$84,937
Median Household Income
$50,140
Median Earnings
$1,697
Median Rent
$657,000
Median Home Value
Check the figures for this property
Cap Rate, Value Estimation, Potential NOI and more
View Realmo Analytics
Market
Vacancy Rate% for Retail in Northeast region





Similar Off Market Nearby
- Elec Bike Inc — 108 Canal St, Staten Island, NY 10304
- 4 Guy's Auto Body Car Repair — 450 Front St, Staten Island, NY 10304
- Albos Auto Repair — 450 C Front St, Staten Island, NY 10304
- A & A Tire Repair — 42 Canal St, Staten Island, NY 10304
- Styland Recovery Inc — 350 Front St, Staten Island, NY 10304
Frequently Asked Questions
What type of property is this?
Auto shop - Long-established tire and service center operating since 1983, with lift equipment and inspection machinery.
Where is this auto shop located?
The property is located at 86 Van Duzer Street Staten Island, NY.
What is the asking price?
The asking price for this property is $1,998,000.
What are key features of this property?
This property features: 3,000 SF building; operating tire and service center with long‑time business established in 1983; Includes 5 lift machines and inspection machinery; New York Tire Company and service center business with separate asking price of $998,000




