Waterfront Restaurant
For Sale
$1,500,000
Pending
855 Hoosick Road, Troy, NY 12180
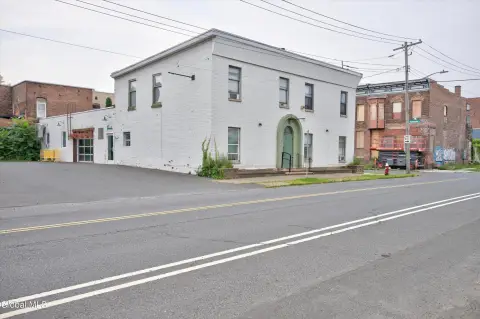
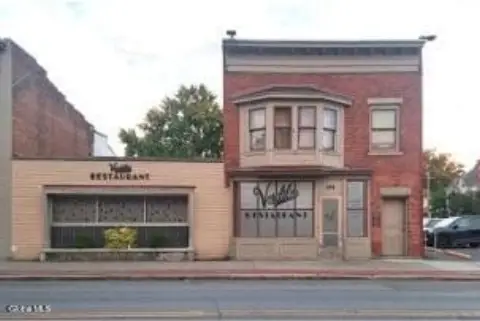
Operating restaurant with commercial zoning, an active liquor license, guest seating, and substantial on-site parking.
Property Size4,060 SF
Lot Size3.55 Acres
Days on Market87
Property Features for 855 Hoosick Road
General Information
Standard status
Pending
Size
4,060 SF
Total Parking Spaces
100
Lot size
3.55 Acres
Zoning
Commercial
Site & Location
Road Frontage
650 ft
Traffic Count
15,890 vehicles/day
Road Access
Yes
Restaurant
Seating Capacity
143
Liquor License
Yes
Additional Details
Land Use
commercial
Taxes and HOA fees
Annual Taxes
$25,855
Building Details
Year Built
1989
Buildings
1
Stories
1
Listing Agency:
Inglenook Realty Inc
Listed By:
Alec Wright · License #10401394223
(518) 633-7509
Source:
Capmarkrealty
Added: Jul 24
Changed: Oct 10
Last Checked: Oct 16 at 6:20AM
Displayed information is deemed reliable but is not guaranteed and should be independently verified. All listing content including descriptions, pricing, images are the copyrighted material of Inglenook Realty Inc

Ask AI about this property
Review the available facts, identify missing information and prepare questions for the agent.
Investment Insights
Based on property information with market context.
This commercial restaurant property occupies 3.55 acres and includes an operating facility originally built in 1989. The premises accommodate 143 guests and provide more than 100 parking spaces, along with an active liquor license. Commercial zoning supports the current restaurant use and other redevelopment or adaptive-reuse concepts identified for the site.
The property is located at 855 Hoosick Road in Troy, New York, along Route 7. It offers approximately 650 feet of roadway frontage, exposure to an estimated 5.8 million vehicles annually, and 818 feet of direct frontage on the Brunswick Reservoir. The waterfront setting and established road presence support consideration of restaurant, hospitality, healthcare, convenience, event, and mixed-use concepts, subject to applicable approvals.
The property is located at 855 Hoosick Road in Troy, New York, along Route 7. It offers approximately 650 feet of roadway frontage, exposure to an estimated 5.8 million vehicles annually, and 818 feet of direct frontage on the Brunswick Reservoir. The waterfront setting and established road presence support consideration of restaurant, hospitality, healthcare, convenience, event, and mixed-use concepts, subject to applicable approvals.
Key Highlights
- 3.55‑acre commercial restaurant property at 855 Hoosick Road
- Approximately 650 feet of road frontage along Route 7
- 818 feet of direct waterfront frontage on Brunswick Reservoir
Financial Insights
Estimated NOI and Cap Rate
NOI / Yr
$63,010
Cap Rate
4.20%
Suggested Prices Based on Cap Rates
Cap Rate 5%
$1,260,200
$1.3M
Cap Rate 7%
$900,143
$900.1K
Cap Rate 9%
$700,111
$700.1K
Market Conditions
NOI Build-Up for 4,060 SF
Gross rent
$87.7K $21.60/SF
− Vacancy
−$3.7K −$0.91/SF
EGI
$84.0K $20.69/SF
− OpEx
−$21.0K −$5.17/SF
NOI
$63.0K $15.52/SF
Area
Rensselaer County, NY
Vacancy
4.20%
Lease Rate
$21.60 /SF/Yr
Expense Ratio
25.00%
Simulate Cap Rate and NOI
Suggested Prices Based on Cap Rates
Cap Rate 5%
$1,260,200
Cap Rate 7%
$900,143
Cap Rate 9%
$700,111
Alternative Uses
Best Use
Specialty Retail
$900.1K
$787.6K – $1.05M
NOI $63,010 @ 7.0% cap · market cap 4.20%
Second Best
—
—
no second resolved use
Theoretical Best
Office A
$1.01M
$888.1K – $1.18M
NOI $71,045 @ 7.0% cap · market cap 4.74%
Zoning and permitted uses should be independently verified with authorities.
How Realmo checks its estimates
Property Analytics
Unlock full access to Insights
Subscribe to Realmo Intelligence
Open Analytics
Current Use
Lease Details
15,890 VPD
Traffic count
Yes
Paved road access
Yes
Liquor license
Location Intelligence
Trade Area within ½ mile
161
Businesses Nearby
35k
Monthly Visits Nearby
Balanced
Demand for This Use
Explore this area
Business Placement
Foot Traffic Nearby
Home Improvements & Furnishings 65%
Shops & Services 35%
Tractor Supply Co.
Home Improvements & Furnishings
11,479 visits/mo
0.0 miles
CAP COM Federal Credit Union
Shops & Services
9,126 visits/mo
0.4 miles
Harbor Freight Tools
Home Improvements & Furnishings
6,100 visits/mo
0.1 miles
Hatchet Hardware Of Brunswick
Home Improvements & Furnishings
5,268 visits/mo
0.2 miles
KeyBank
Shops & Services
2,959 visits/mo
0.5 miles
Demographics for 12180, NY
55,907
Population
25,527
Households
2.2
Avg Household Size
33
Median Age
40%
College-Educated
90%
High-School Grad
56.2 sq mi
ZIP Area
995
Density / Sq Mi
$73,767
Median Household Income
$41,787
Median Earnings
$1,188
Median Rent
$233,000
Median Home Value
Check the figures for this property
Cap Rate, Value Estimation, Potential NOI and more
View Realmo Analytics
Market
Vacancy Rate% for Retail in Northeast region







Frequently Asked Questions
What type of property is this?
Conventional restaurant - Operating restaurant with commercial zoning, an active liquor license, guest seating, and substantial on-site parking.
Where is this conventional restaurant located?
The property is located at 855 Hoosick Road Troy, NY.
What is the asking price?
The asking price for this property is $1,500,000.
What are key features of this property?
This property features: 3.55‑acre commercial restaurant property at 855 Hoosick Road; Approximately 650 feet of road frontage along Route 7; 818 feet of direct waterfront frontage on Brunswick Reservoir


