Commercial Kitchen Building With Five
For Sale
Contact for pricing
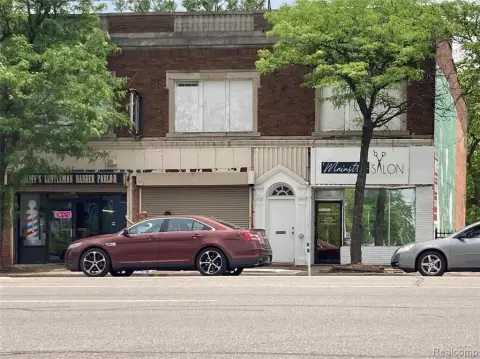
8443 Grand River Ave, Detroit, MI 48204
Multi-unit facility combines food-service areas with dining and lounge space for varied commercial operations.
Property Size13,000 SF
Price / SF$65.38
Days on Market340
Property Features for 8443 Grand River Ave
General Information
Standard status
Active
Size
13,000 SF
Property subtype
RETAIL
Listing Agency:
SVN-Cohn Commercial Properties
(248) 851-5000
Listed By:
Harry Cohn · License #07986251
(248) 818-0010
Source:
Moodyscre
Added: Nov 10, 2025
Changed: Oct 8
Last Checked: Oct 15 at 2:11AM
Displayed information is deemed reliable but is not guaranteed and should be independently verified. All listing content including descriptions, pricing, images are the copyrighted material of SVN-Cohn Commercial Properties

Ask AI about this property
Review the available facts, identify missing information and prepare questions for the agent.
Investment Insights
Based on property information with market context.
This 13,000-square-foot commercial kitchen property contains five units within a building constructed in 1929 and renovated in 2016. The interior includes dedicated dining and lounge areas, supporting food-service concepts alongside additional commercial configurations.
The property can accommodate restaurant operations, culinary concepts, and ghost kitchens. Its layout also supports event-oriented uses identified for the building, including nightclub, banquet hall, and corporate event functions. Portions of the building or the full property may be leased, providing flexibility for occupancy planning.
The property can accommodate restaurant operations, culinary concepts, and ghost kitchens. Its layout also supports event-oriented uses identified for the building, including nightclub, banquet hall, and corporate event functions. Portions of the building or the full property may be leased, providing flexibility for occupancy planning.
Key Highlights
- 13,000 SF building with five units
- Built in 1929 and renovated in 2016
- Includes dining and lounge areas
Financial Insights
Estimated NOI and Cap Rate
NOI / Yr
$63,228
Cap Rate
7.44%
Suggested Prices Based on Cap Rates
Cap Rate 5%
$1,264,560
$1.3M
Cap Rate 7%
$903,257
$903.3K
Cap Rate 9%
$702,533
$702.5K
Market Conditions
NOI Build-Up for 13,000 SF
Gross rent
$95.2K $7.32/SF
− Vacancy
−$4.8K −$0.37/SF
EGI
$90.3K $6.95/SF
− OpEx
−$27.1K −$2.08/SF
NOI
$63.2K $4.86/SF
Area
Detroit, MI
Vacancy
5.08%
Lease Rate
$7.32 /SF/Yr
Expense Ratio
30.00%
Simulate Cap Rate and NOI
Suggested Prices Based on Cap Rates
Cap Rate 5%
$1,264,560
Cap Rate 7%
$903,257
Cap Rate 9%
$702,533
Alternative Uses
Best Use
Specialty Retail
$2.45M
$2.14M – $2.86M
NOI $171,557 @ 7.0% cap · market cap 20.18%
Second Best
Industrial
$903.3K
$790.4K – $1.05M
NOI $63,228 @ 7.0% cap · market cap 7.44%
Theoretical Best
Office A
$2.87M
$2.51M – $3.35M
NOI $200,750 @ 7.0% cap · market cap 23.62%
Zoning and permitted uses should be independently verified with authorities.
How Realmo checks its estimates
Property Analytics
Unlock full access to Insights
Subscribe to Realmo Intelligence
Open Analytics
Current Use
Location Intelligence
Trade Area within ½ mile
247
Businesses Nearby
Explore this area
Business Placement
Demographics for 48204, MI
21,738
Population
13,691
Households
1.6
Avg Household Size
37
Median Age
10%
College-Educated
83%
High-School Grad
5.0 sq mi
ZIP Area
4,348
Density / Sq Mi
$32,875
Median Household Income
$26,701
Median Earnings
$970
Median Rent
$53,600
Median Home Value
Check the figures for this property
Cap Rate, Value Estimation, Potential NOI and more
View Realmo Analytics
Market
Vacancy Rate% for Retail in Detroit, MI



Frequently Asked Questions
What type of property is this?
Commercial kitchen - Multi-unit facility combines food-service areas with dining and lounge space for varied commercial operations.
Where is this commercial kitchen located?
The property is located at 8443 Grand River Ave Detroit, MI.
What is the asking price?
The asking price for this property is $850,000.
What are key features of this property?
This property features: 13,000 SF building with five units; Built in 1929 and renovated in 2016; Includes dining and lounge areas


