Detached Cottage
For Sale
$4,123,900
8328 N Bank ST, Portland, OR 97203
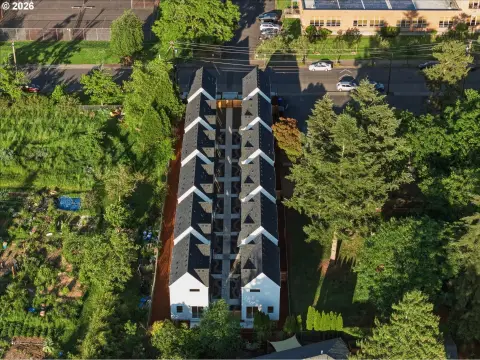
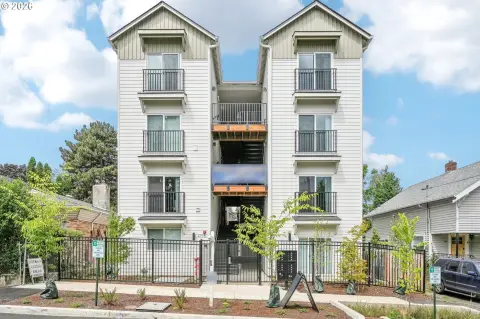
New-construction detached homes with energy-efficient mini-split systems, offering fee-simple ownership flexibility.
Property Size9,597 SF
Days on Market273
Property Features for 8328 N Bank ST
General Information
Standard status
Active
Size
9,597 SF
Property subtype
Multi Family
Additional Details
Multifamily Units
11
Building Details
Building Size
9,597 SF
Year Built
2025
Tenancy
Multi
Listing Agency:
Keller Williams Realty Portland Premiere
Listed By:
Darryl Bodle · License #199910100
(503) 597-2444
Source:
Tripleoaksrealty
Added: Jan 6
Changed: Oct 4
Last Checked: Oct 5 at 3:04PM
Displayed information is deemed reliable but is not guaranteed and should be independently verified. All listing content including descriptions, pricing, images are the copyrighted material of Keller Williams Realty Portland Premiere
Investment Insights
Based on property information with market context.
This offering is a new-construction cottage cluster comprising 11 detached homes. The residences are purpose-built for durability and efficiency, with energy-efficient mini-split systems providing heating and cooling year-round. The detached configuration is designed to balance privacy with practical on-site density, supporting straightforward day-to-day management and long-term operational flexibility under a fee-simple ownership structure.
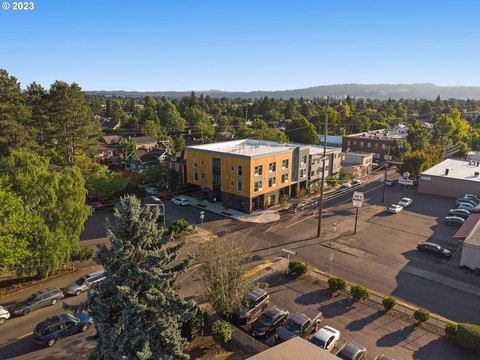
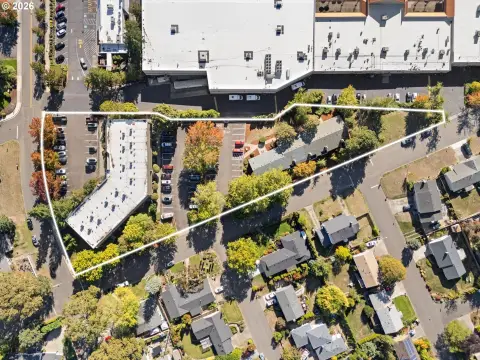
The property is located in Portland’s St. Johns neighborhood on N Bank St. The area is positioned for convenient access to several nearby recreational and community destinations, including Cathedral City Park, St. Johns Park, Pier Park, and the St. Johns Bridge. Residents also have a range of nearby dining and café options, including Two Stroke Coffee, Affogato, John Street Cafe, Leisure Public House, and StormBreaker Brewing, along with Wonderwood Springs and The Fixin’ To.
For investors or operators looking for a residential income asset, this detached, fee-simple structure offers the option to hold as a portfolio while retaining future disposition flexibility subject to buyer strategy and local regulations. The focus on efficient mechanical systems may support broad tenant appeal by targeting year-round comfort with modern equipment.
The property is located in Portland’s St. Johns neighborhood on N Bank St. The area is positioned for convenient access to several nearby recreational and community destinations, including Cathedral City Park, St. Johns Park, Pier Park, and the St. Johns Bridge. Residents also have a range of nearby dining and café options, including Two Stroke Coffee, Affogato, John Street Cafe, Leisure Public House, and StormBreaker Brewing, along with Wonderwood Springs and The Fixin’ To.
For investors or operators looking for a residential income asset, this detached, fee-simple structure offers the option to hold as a portfolio while retaining future disposition flexibility subject to buyer strategy and local regulations. The focus on efficient mechanical systems may support broad tenant appeal by targeting year-round comfort with modern equipment.
Key Highlights
- New‑construction cottage cluster built in 2025 with 11 detached homes on N Bank St in Portland’s St. Johns neighborhood
- Fee‑simple ownership with detached home configuration for long‑term operational flexibility and individual disposition options
- Each residence includes energy‑efficient mini‑split systems for year‑round heating and cooling
Financial Insights
Estimated NOI and Cap Rate
NOI / Yr
$123,225
Cap Rate
2.99%
Suggested Prices Based on Cap Rates
Cap Rate 5%
$2,464,500
$2.5M
Cap Rate 7%
$1,760,357
$1.8M
Cap Rate 9%
$1,369,167
$1.4M
Market Conditions
NOI Build-Up for 9,597 SF
Gross rent
$236.1K $24.60/SF
− Vacancy
−$12.0K −$1.25/SF
EGI
$224.0K $23.35/SF
− OpEx
−$100.8K −$10.51/SF
NOI
$123.2K $12.84/SF
Area
Portland, OR
Vacancy
5.10%
Lease Rate
$24.60 /SF/Yr
Expense Ratio
45.00%
Simulate Cap Rate and NOI
Suggested Prices Based on Cap Rates
Cap Rate 5%
$2,464,500
Cap Rate 7%
$1,760,357
Cap Rate 9%
$1,369,167
Alternative Uses
Best Use
Apartment 5plus
$1.76M
$1.54M – $2.05M
NOI $123,225 @ 7.0% cap · market cap 2.99%
Second Best
—
—
no second resolved use
Theoretical Best
Office A
$2.70M
$2.36M – $3.14M
NOI $188,655 @ 7.0% cap · market cap 4.57%
Zoning and permitted uses should be independently verified with authorities.
Property Analytics
Unlock full access to Insights
Subscribe to Realmo Intelligence
Open Analytics
Current Use
Lease Details
11
Residential units
Multi-tenant
Tenancy
Location Intelligence
Trade Area within ½ mile
304
Businesses Nearby
Explore this area
Business Placement
Demographics for 97203, OR
33,763
Population
13,462
Households
2.5
Avg Household Size
34
Median Age
45%
College-Educated
90%
High-School Grad
10.8 sq mi
ZIP Area
3,126
Density / Sq Mi
$77,619
Median Household Income
$46,152
Median Earnings
$1,551
Median Rent
$468,600
Median Home Value
Check the figures for this property
Cap Rate, Value Estimation, Potential NOI and more
View Realmo Analytics
Market
Vacancy Rate% for Multifamily in West region

Questions? Ask Rey
Realmo’s AI knows this listing — price, zoning, demand, history. Ask anything.





Frequently Asked Questions
What type of property is this?
Apartment building - New-construction detached homes with energy-efficient mini-split systems, offering fee-simple ownership flexibility.
Where is this apartment building located?
The property is located at 8328 N Bank ST Portland, OR.
What is the asking price?
The asking price for this property is $4,123,900.
What are key features of this property?
This property features: New‑construction cottage cluster built in 2025 with 11 detached homes on N Bank St in Portland’s St. Johns neighborhood; Fee‑simple ownership with detached home configuration for long‑term operational flexibility and individual disposition options; Each residence includes energy‑efficient mini‑split systems for year‑round heating and cooling



