Four-Unit Townhome-Style
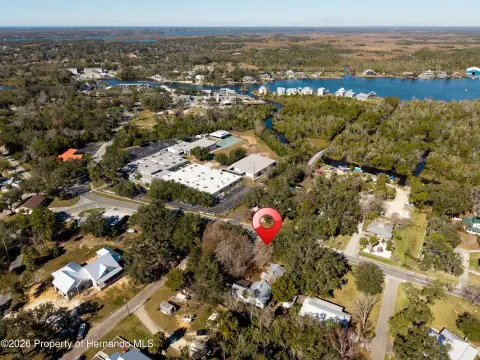
8324 W Earl Loop Homosassa, FL 34446
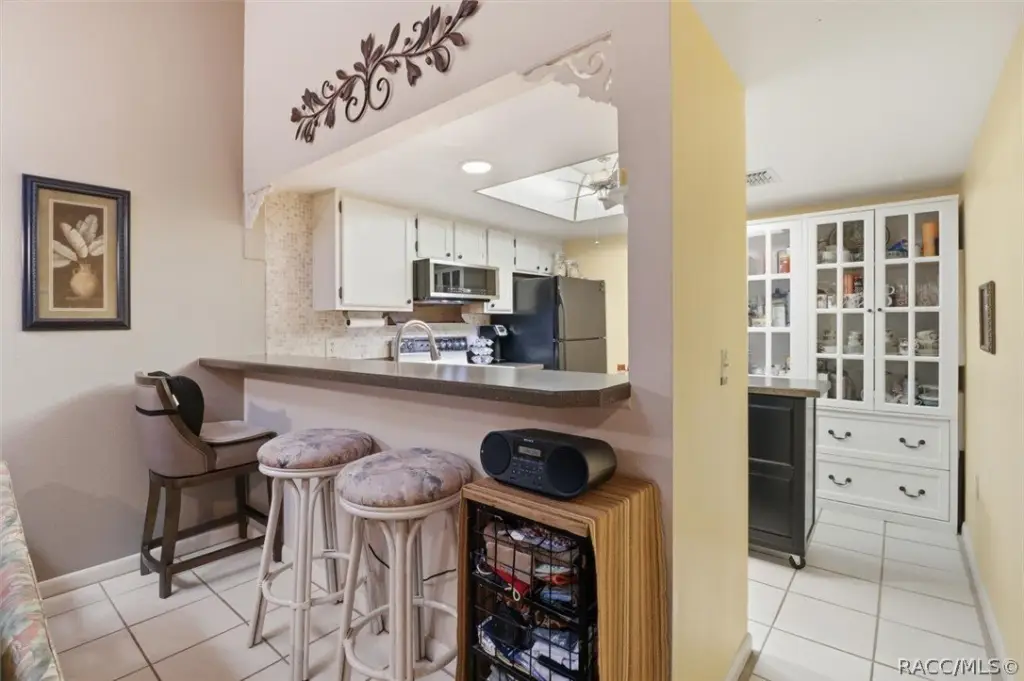
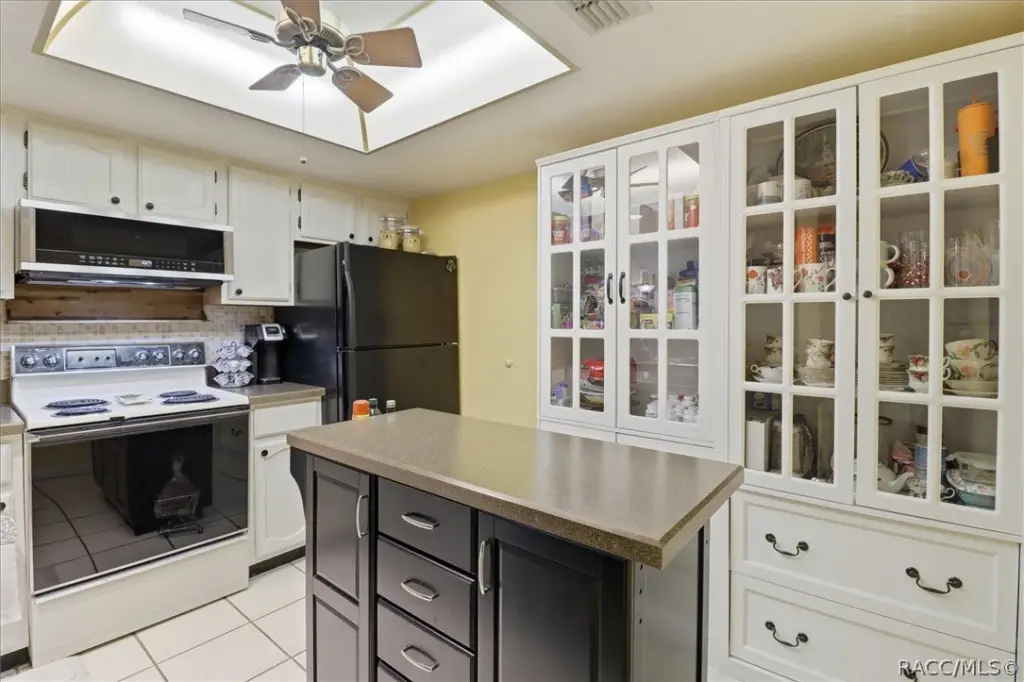
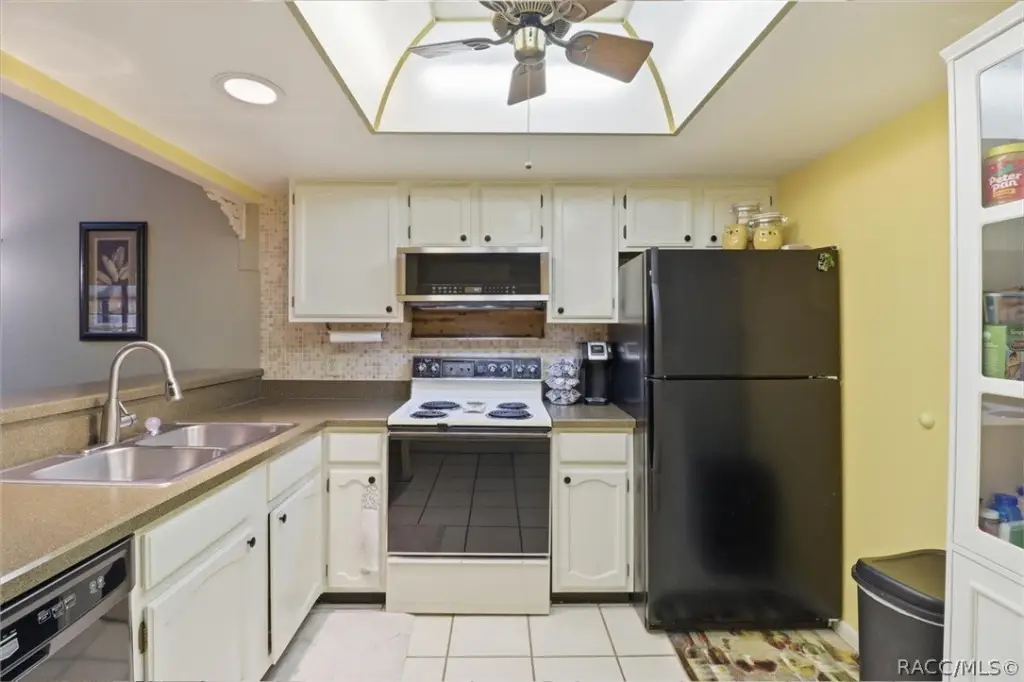
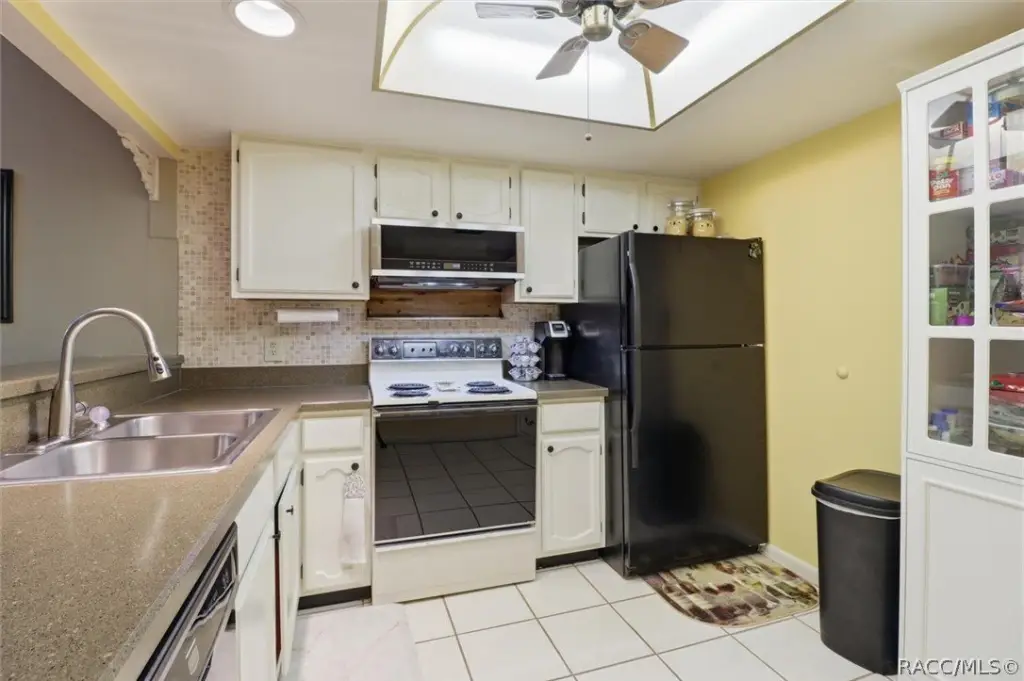
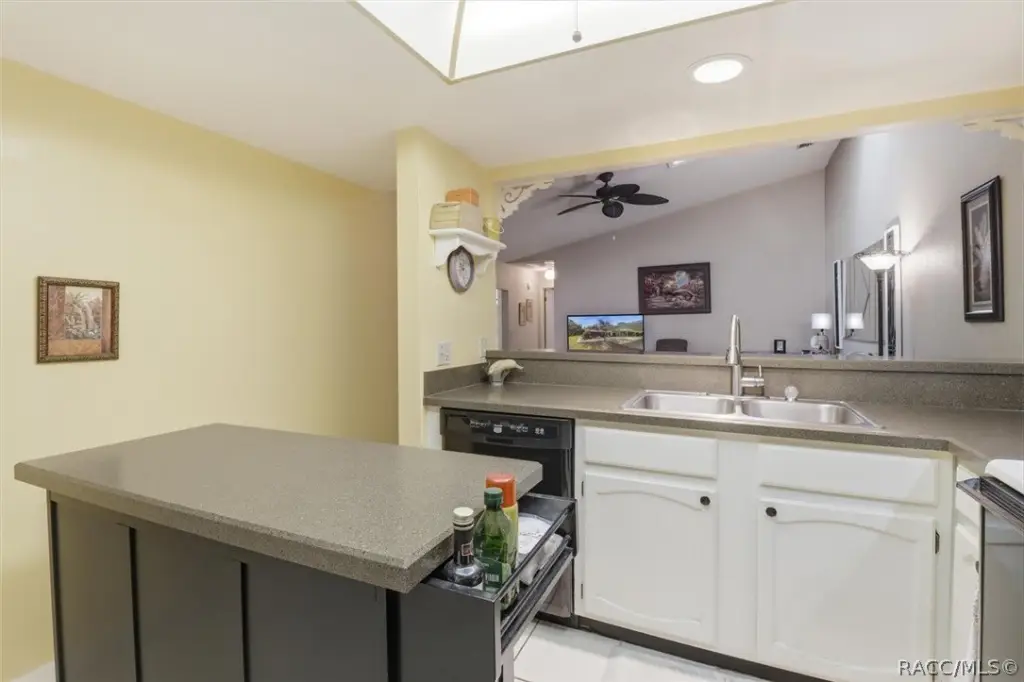
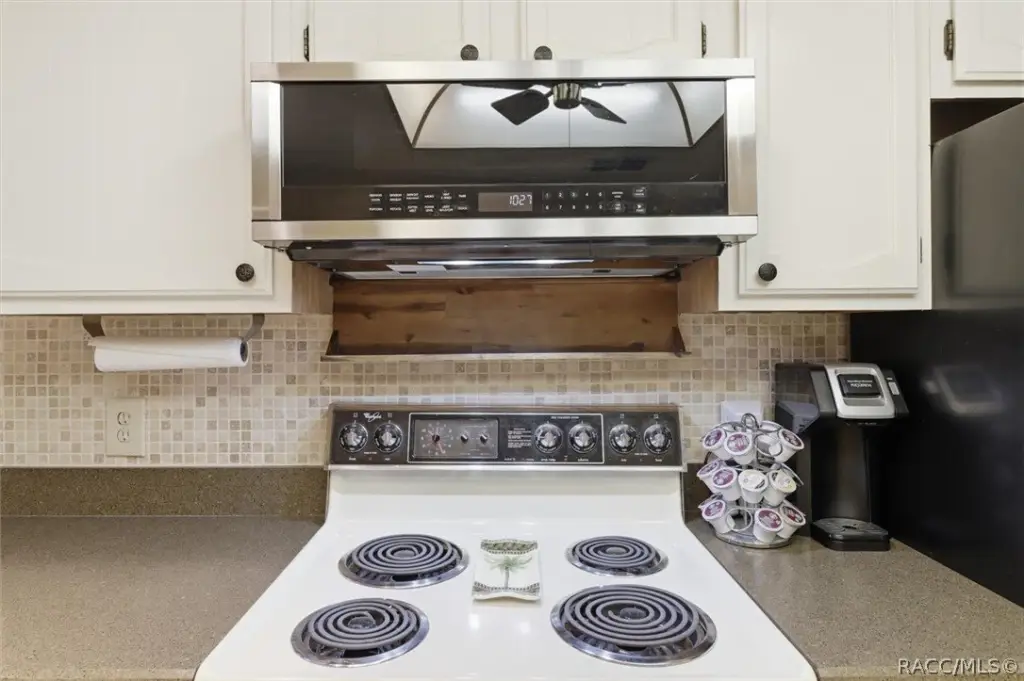
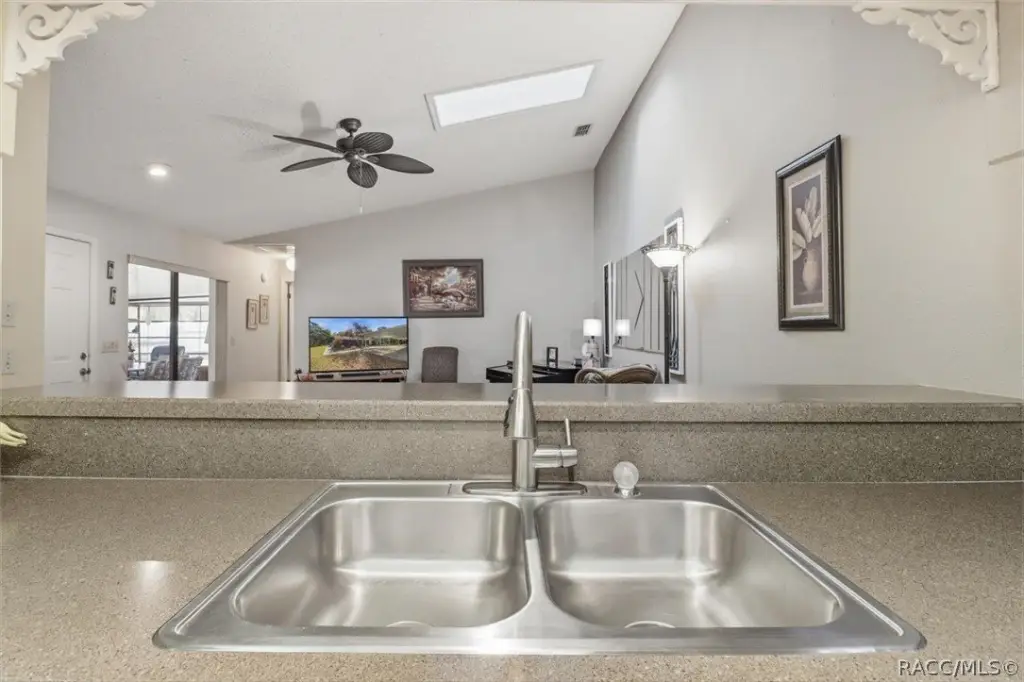
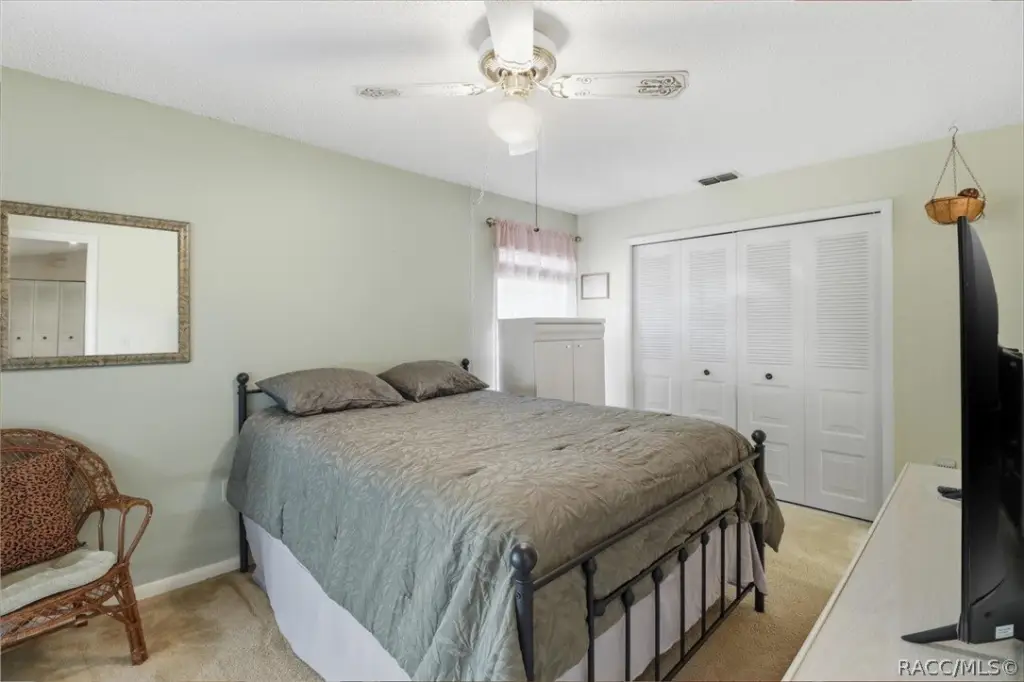
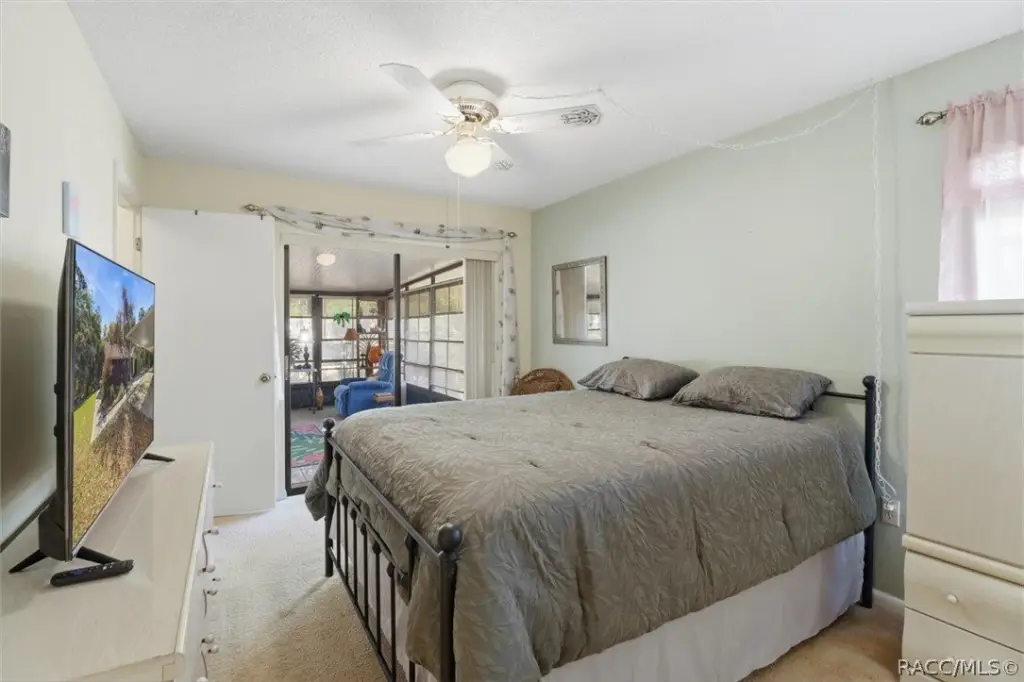
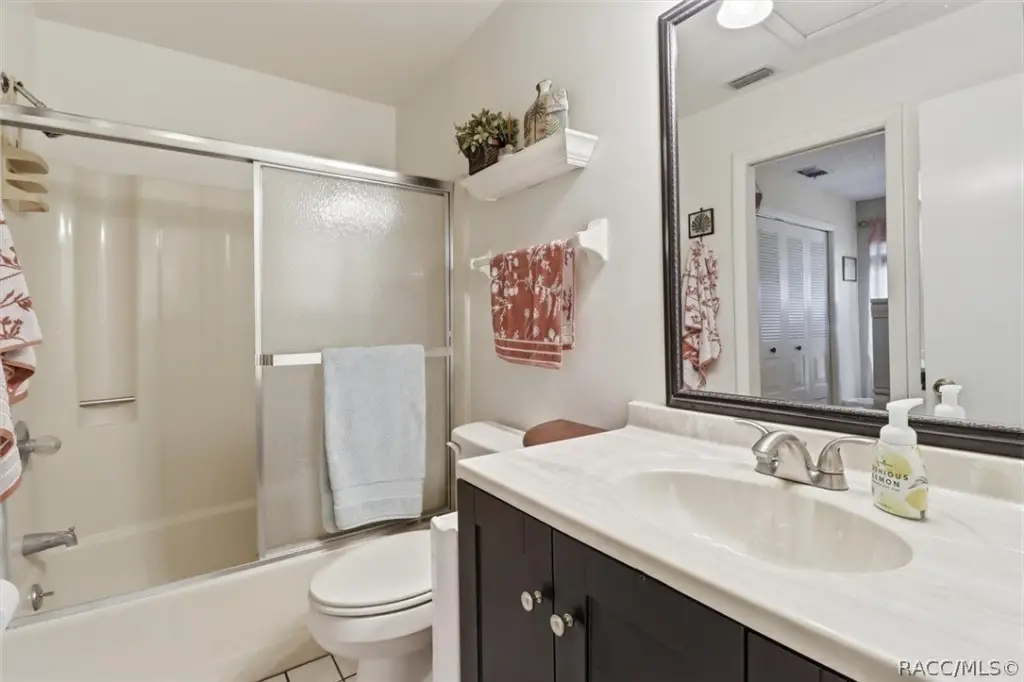
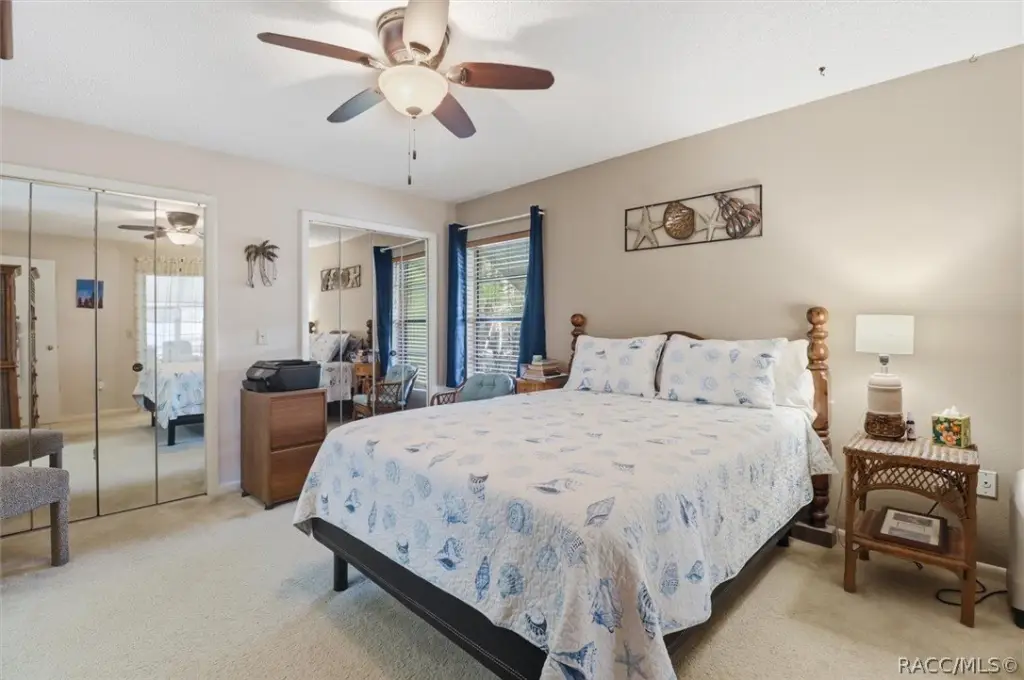
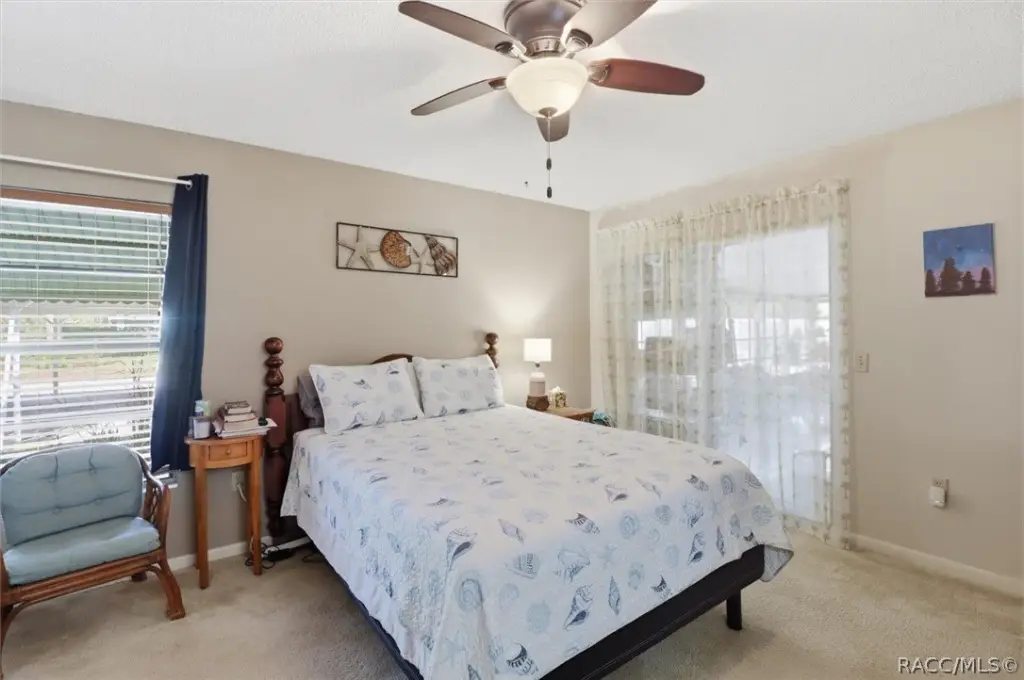
For Sale
$175,000
MULTI_FAMILY - Other - Homosassa, FL
Property Size1,026 SF
Lot Size0.05 Acres
Price / SF$170.57
Days on Market118
Property Features for 8324 W Earl Loop
General Information
Property type
Residential Multi Family
Property subtype
Quadruplex
Zoning
HDR
Bedrooms
2
Bathrooms
2
Rooms
Bathroom 1, Bathroom 2, Bedroom 1, Bedroom 2
Parking
2
Parking features
Carport
Window features
Blinds, Skylight(s)
Interior features
BreakfastBar, LaminateCounters, MultiplePrimarySuites, Pantry, SplitBedrooms, Skylights, WindowTreatments, FirstFloorEntry, SlidingGlassDoors
Exterior features
Landscaping
Appliances
Dryer, ElectricOven, Microwave, Refrigerator, WaterHeater, Washer
Standard status
Active
APN
2513888
Size
1,026 SF
Lot size
0.05 Acres
Taxes and HOA fees
Tax Year
2025
Tax Description
HOMOSASSA SPRINGS GARDENS UNIT NO. 2 UNREC SUB UNIT 18 MORE PART DESC AS FOLLOWS: COM AT SE COR OF TRACT "A" HOMOSASSA SPRINGS GARDENS UNIT NO. 1 PB 12 PG 40 & 41; THN N 89 DEG 37M 7S E 204.67 FT THN N 0 DEG 3M 58S E 198.24 FT TO POB; THN CONT N 0 DE G 3M 58S E 55 FT THN N 89 DEG 56M 2S W 36.33 FT THN S 0 DEG 3M 58S W 55 FT THN S 89 DEG 56M 2S E 36.33 FT TO POB.
Tax Annual Amount
1326
Utilities
Sewer type
Public Sewer
Heating system
Central, Electric (Heating)
Cooling system
Central Air, Electric
Water source
Public
Building Details
Year built
1986
Flooring type
Tile, Carpet
Building materials
Stucco
Roof type
Shingle, Asphalt
Architectural style
Other
Listing Agency:
Wave Elite Realty LLC
(352) 699-9283
Listed By:
Megan Cortez · License #3357542
(352) 586-7993
Added: Apr 2
Changed: Jul 23
Last Checked: Jul 28 at 8:06AM
MLS# 853582
Copyright © 2026 REALTORS Association of Citrus County, Inc. All rights reserved. All information provided by the listing agent/broker is deemed reliable but is not guaranteed and should be independently verified.
Investment Insights
Based on property information with market context.
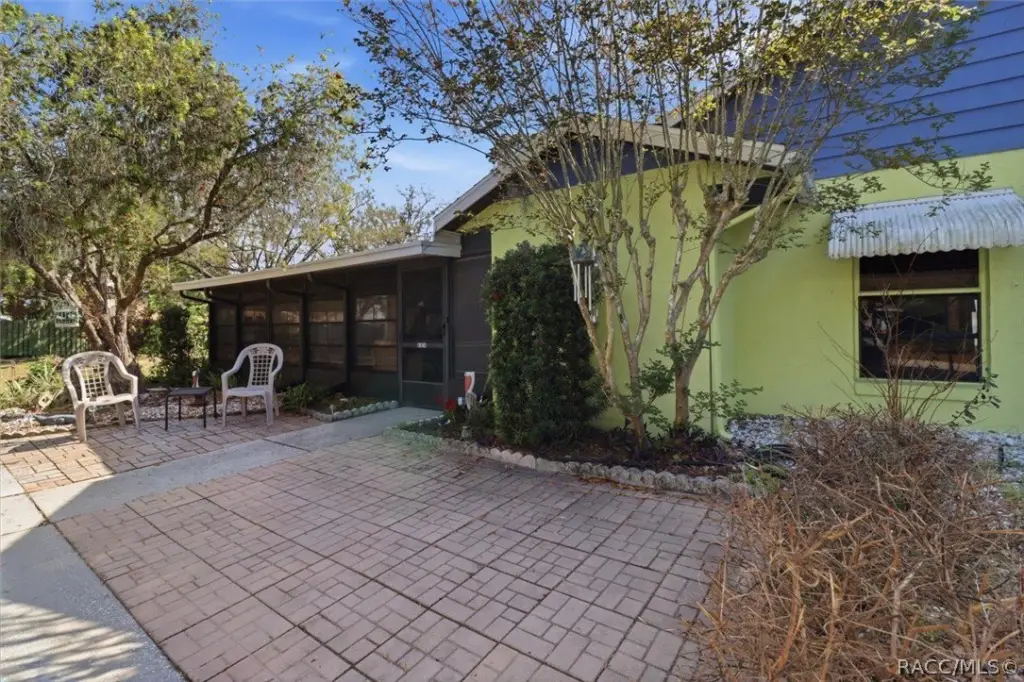
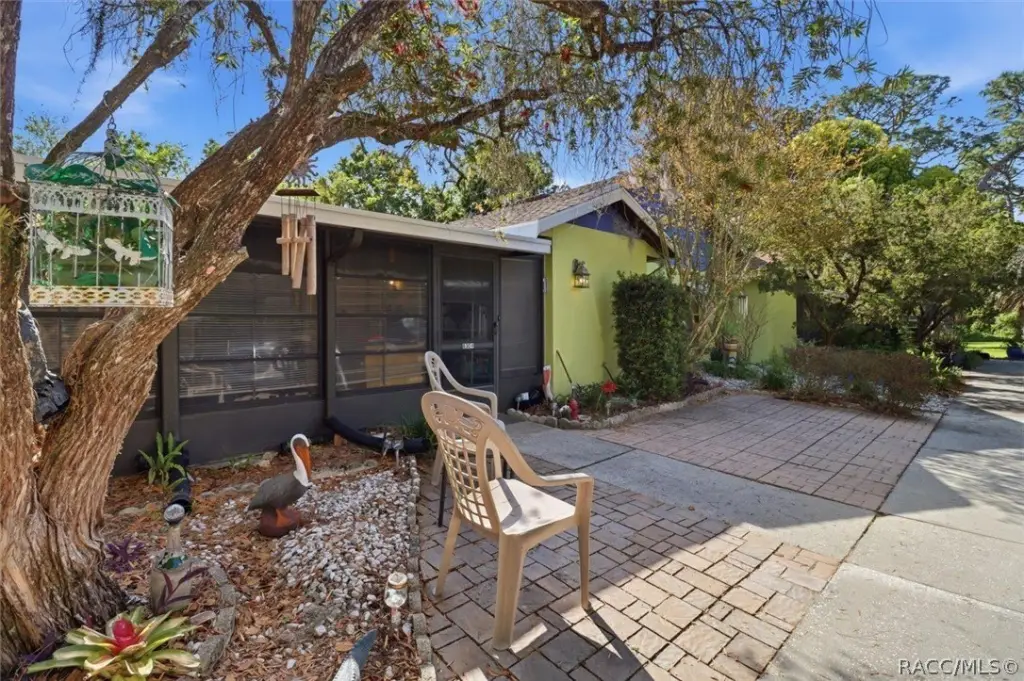
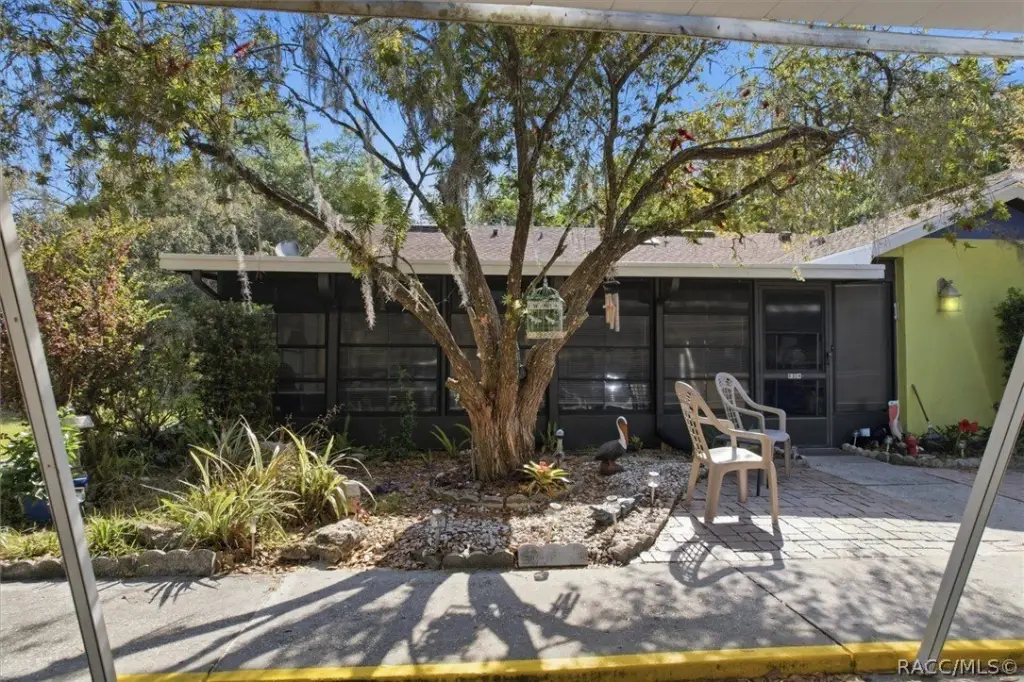
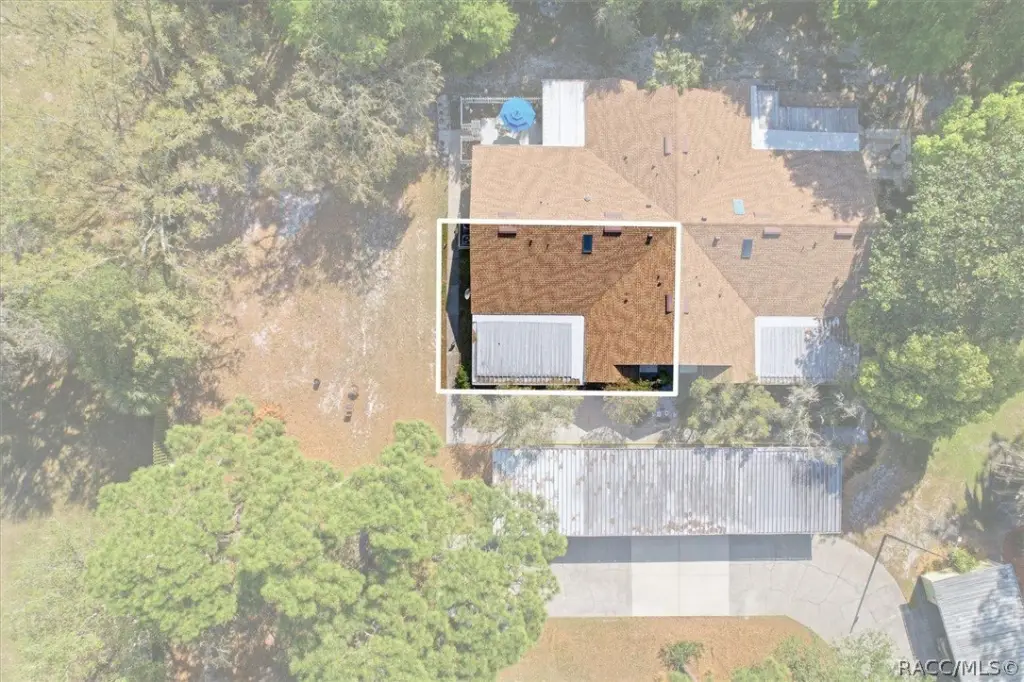
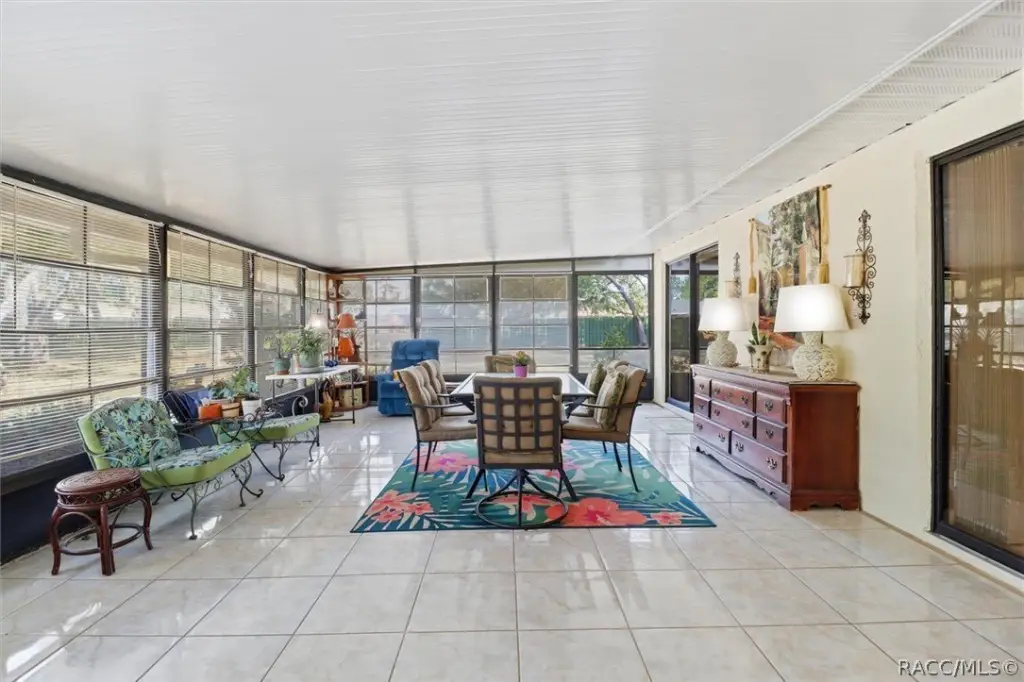
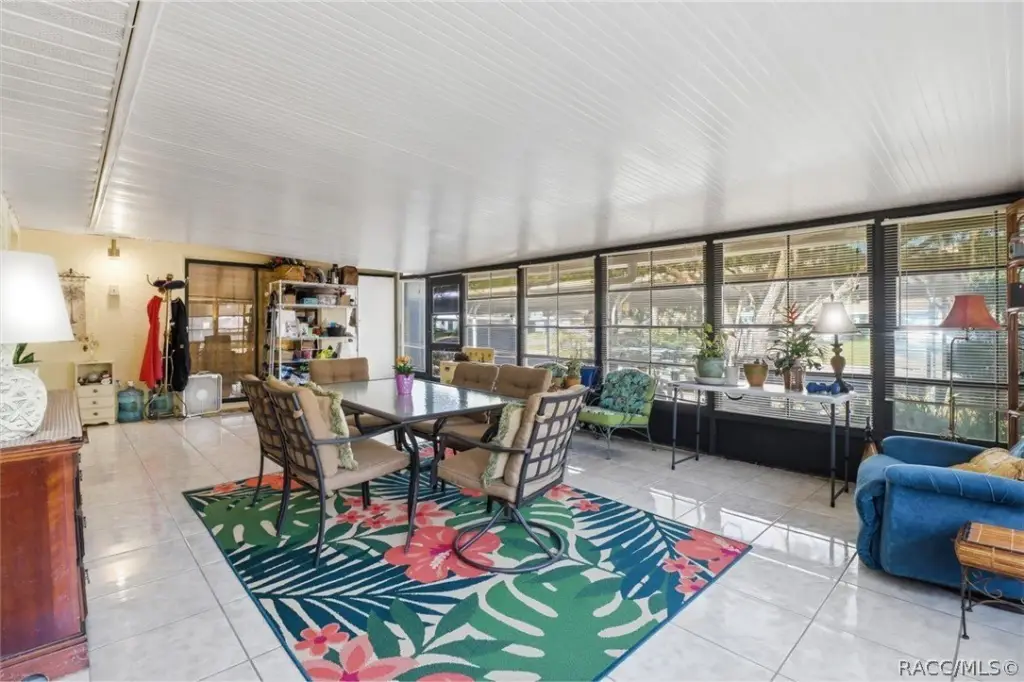
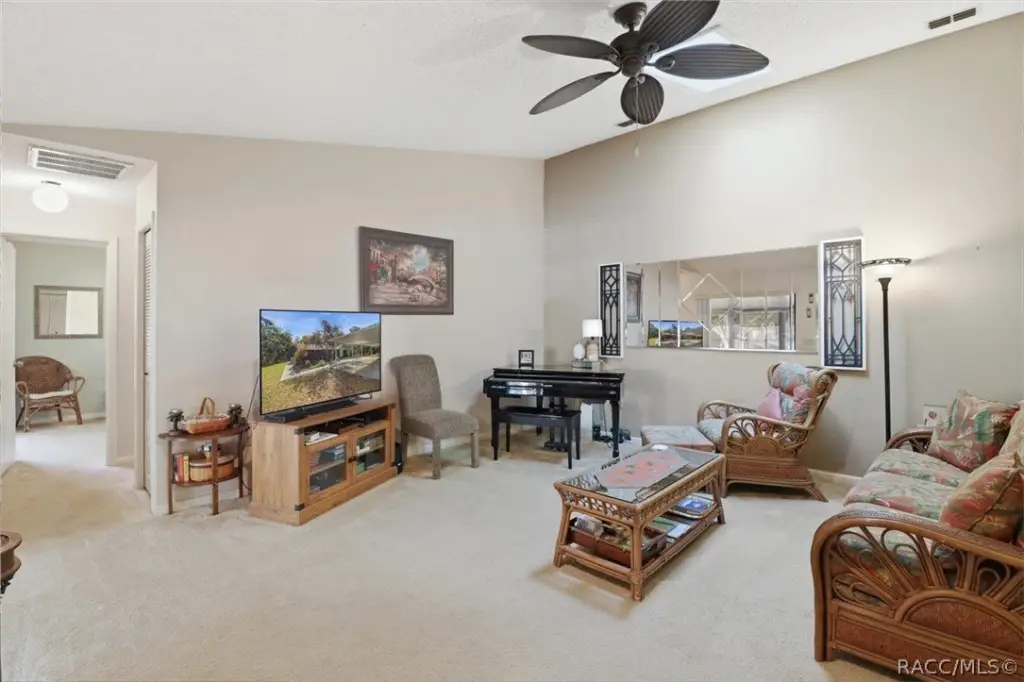
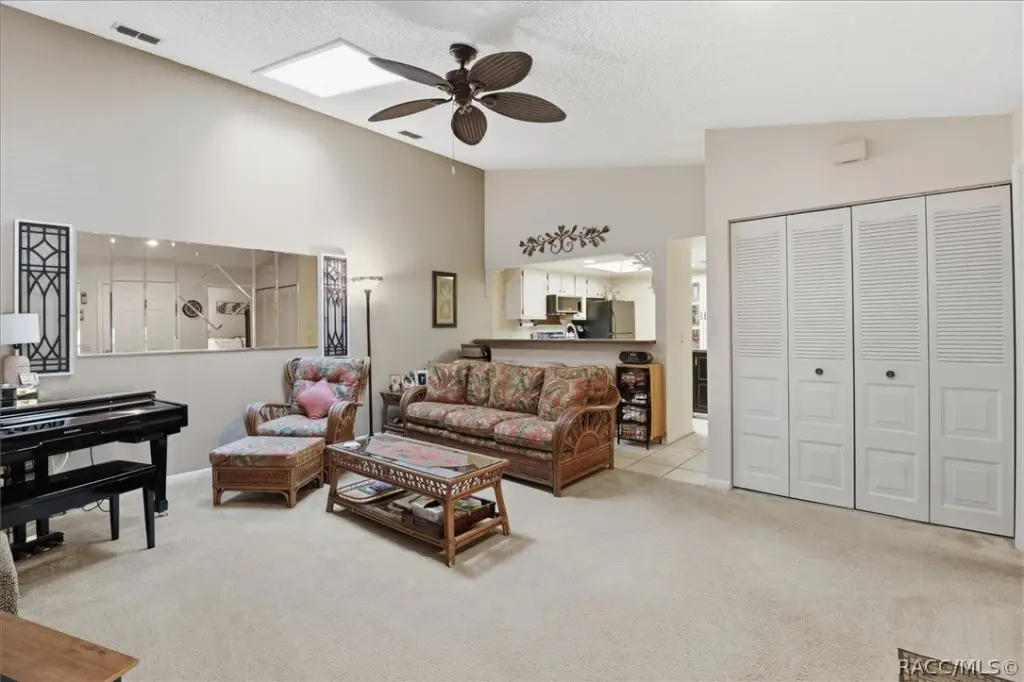
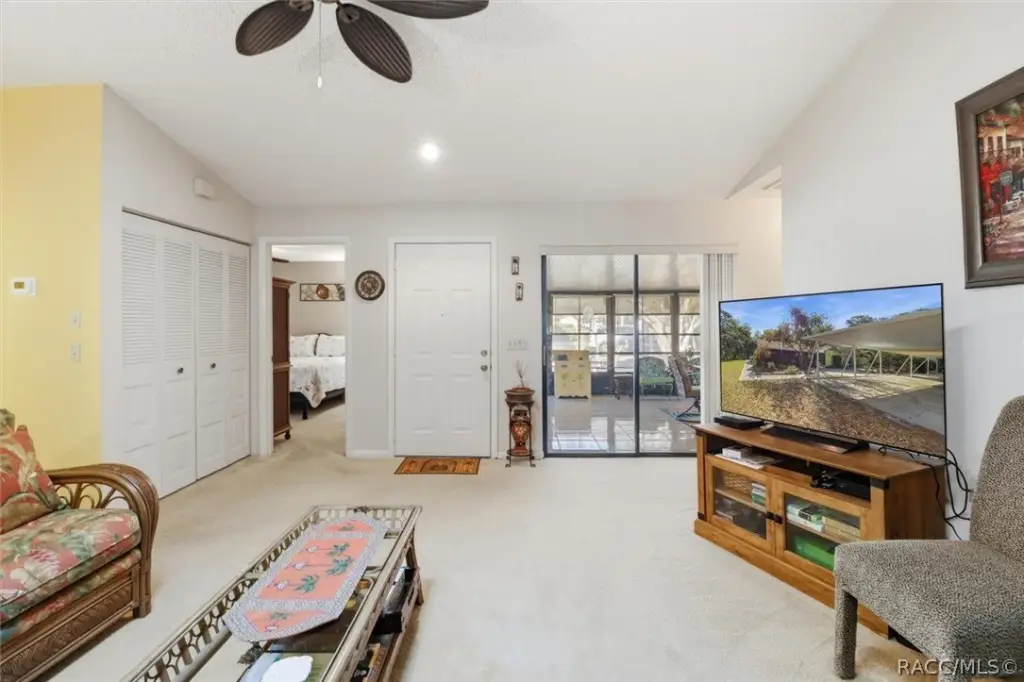
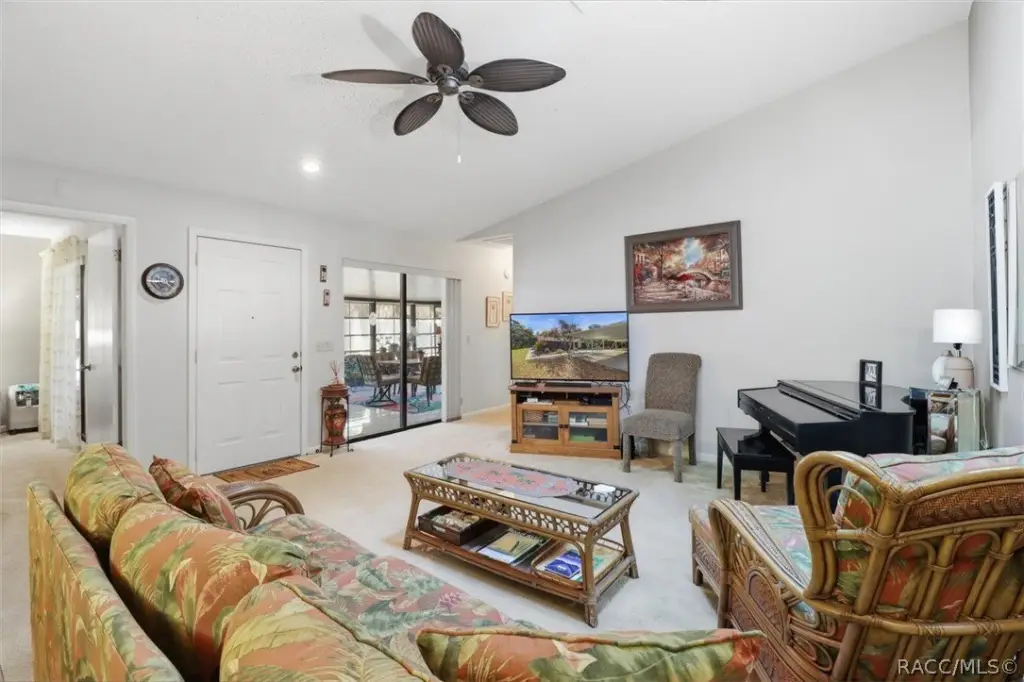
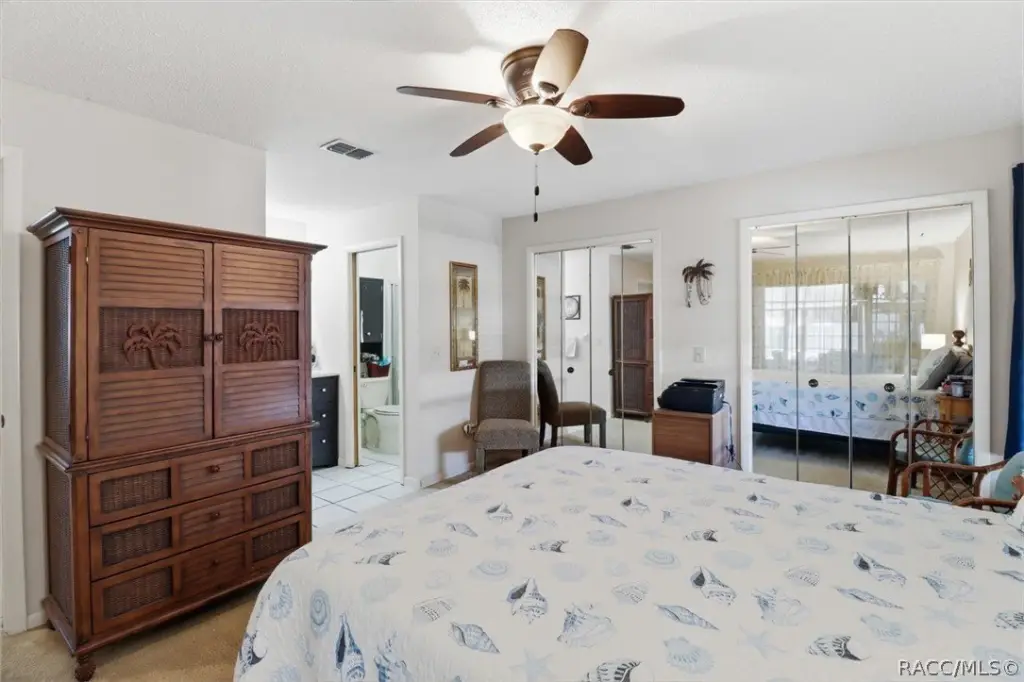
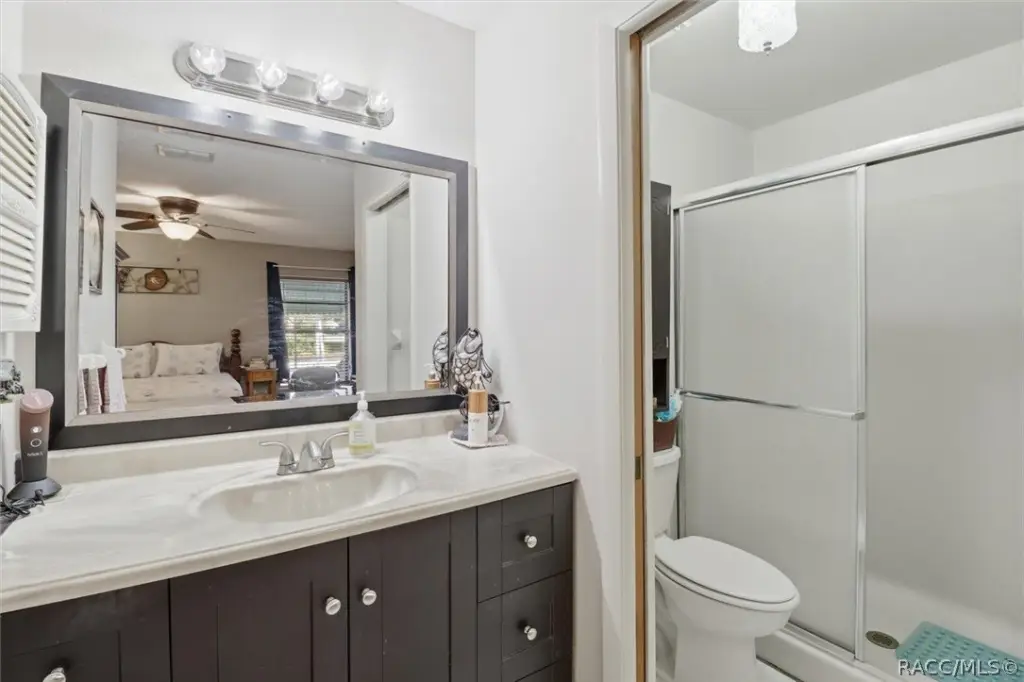
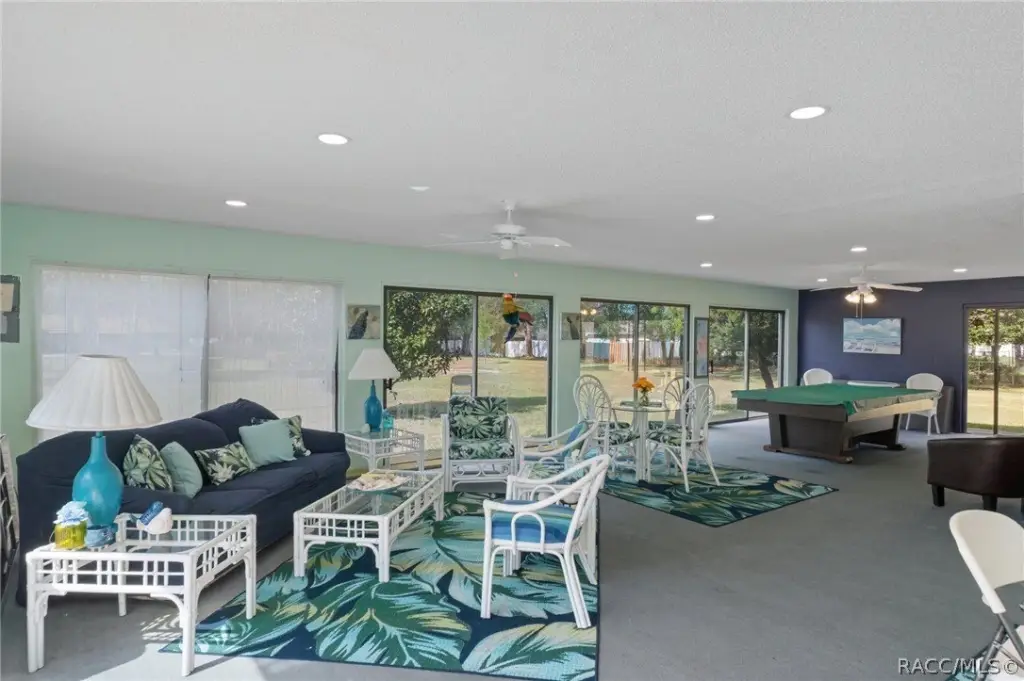
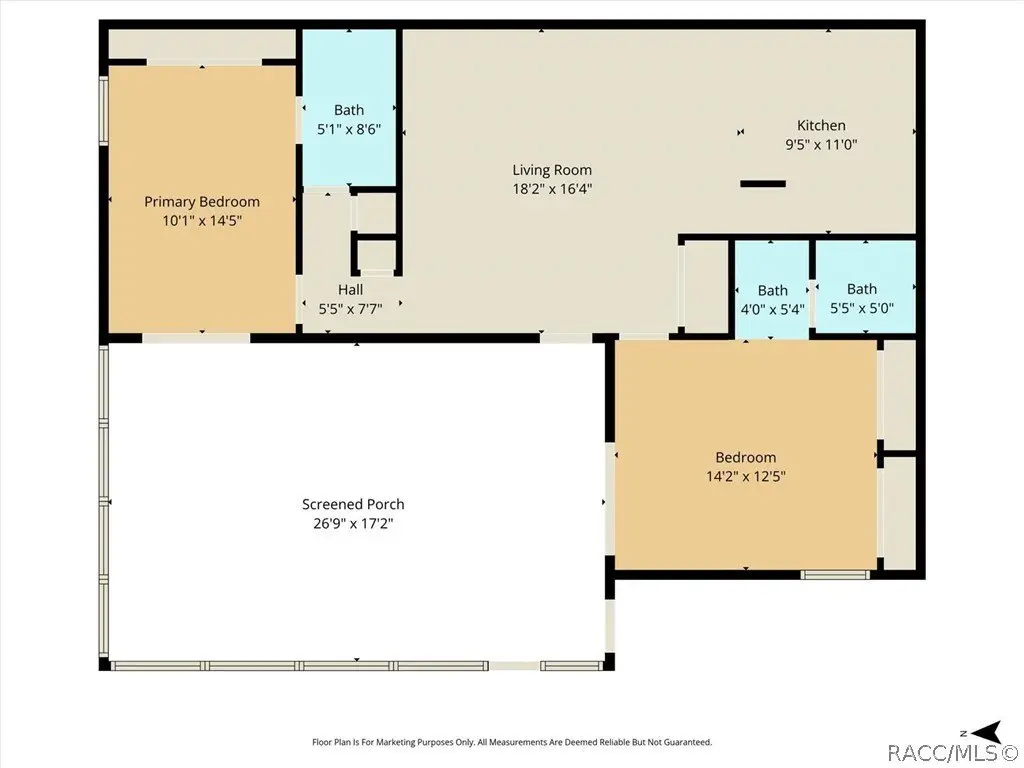
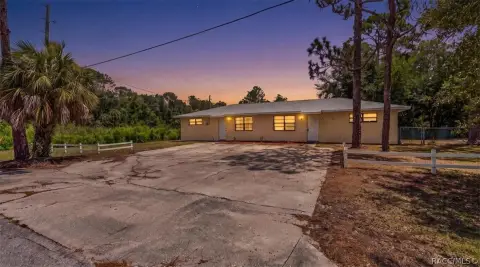
This four-residence, townhome-style quadplex offers a move-in-ready home configuration with two spacious primary bedroom suites, high ceilings, and a generously sized enclosed Florida room that expands the living area. The property includes recent improvements, including a new AC dated 12/2025, a new roof in 2023, and a new sunroom roof in 2024. It is designed for both comfort and day-to-day functionality, with a blend of privacy and shared community setting.
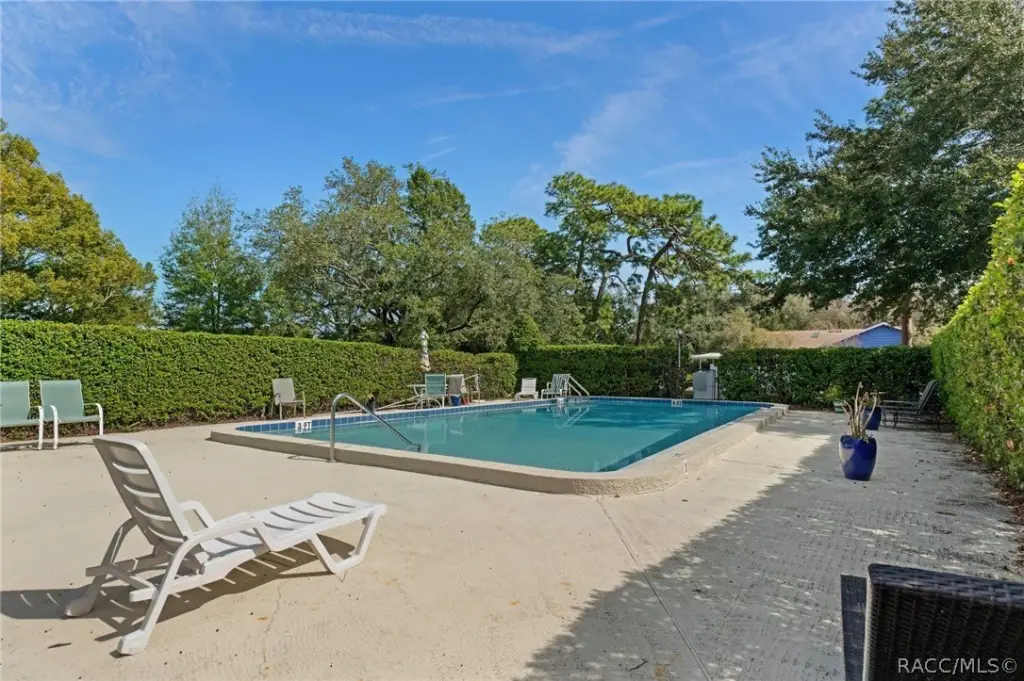
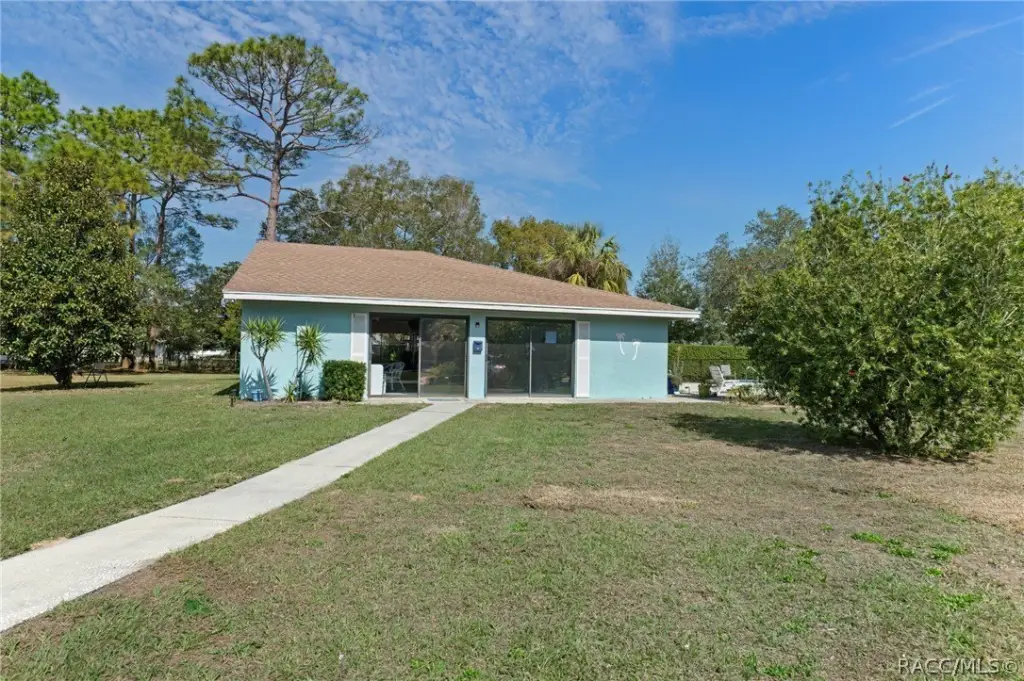
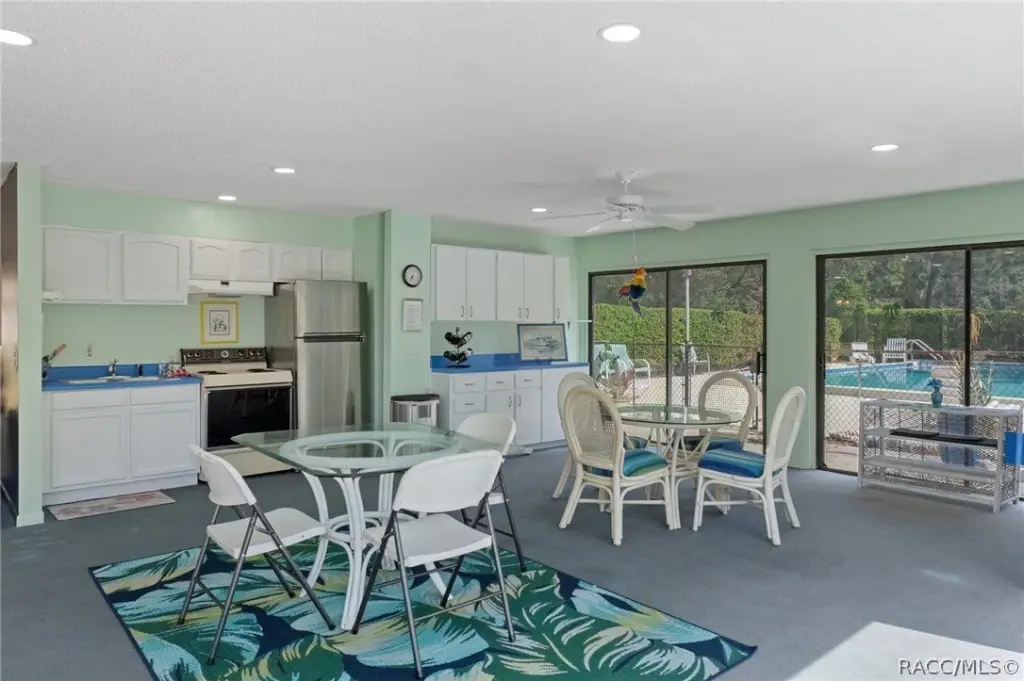
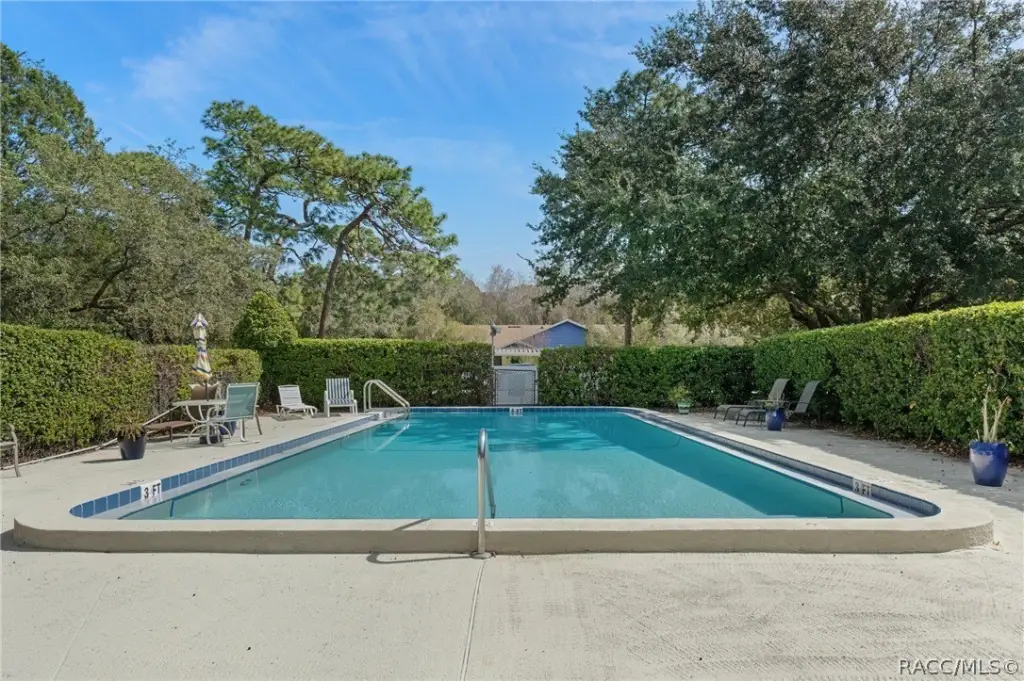
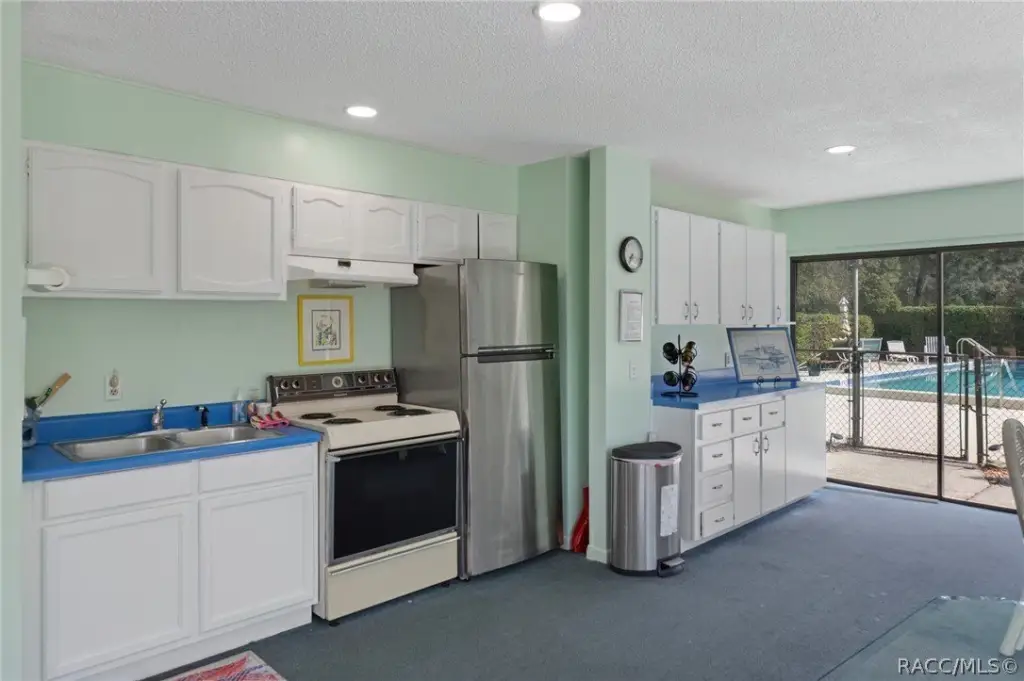
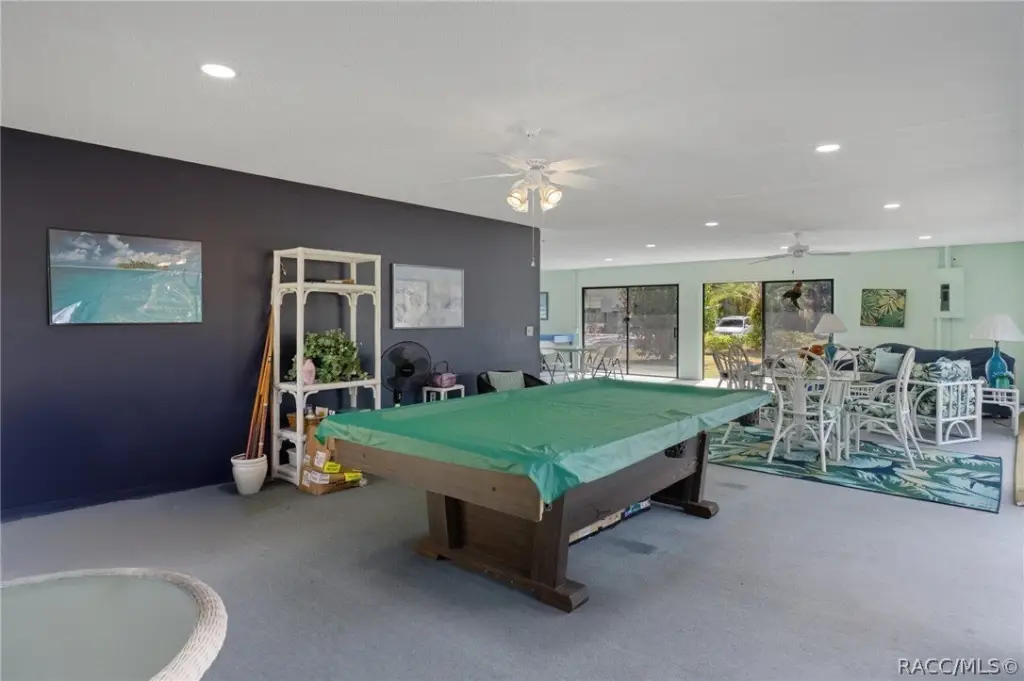
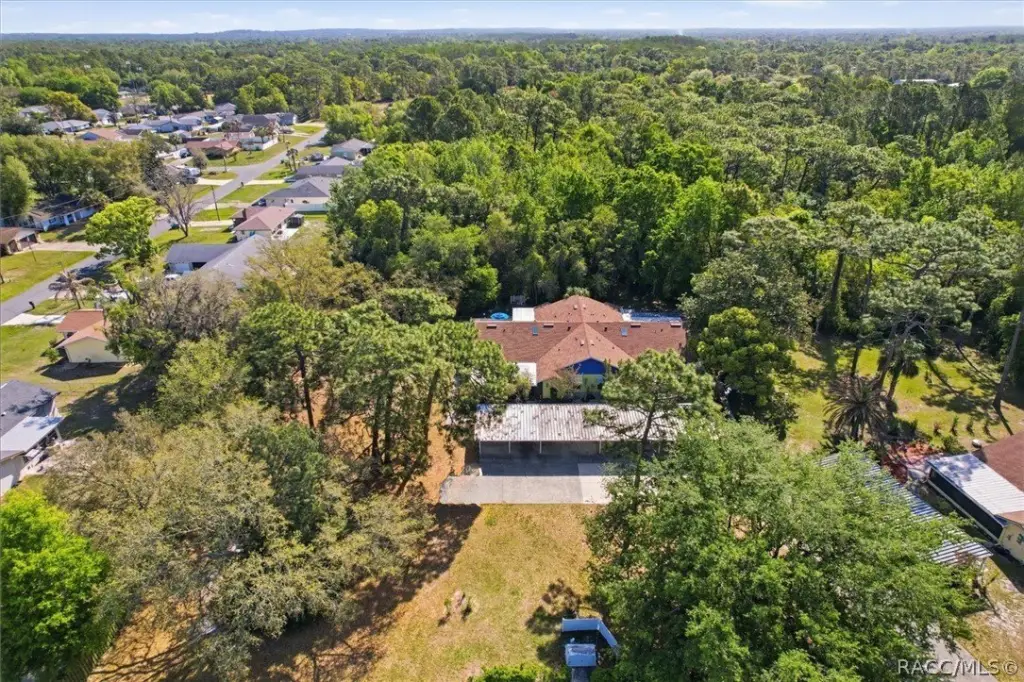
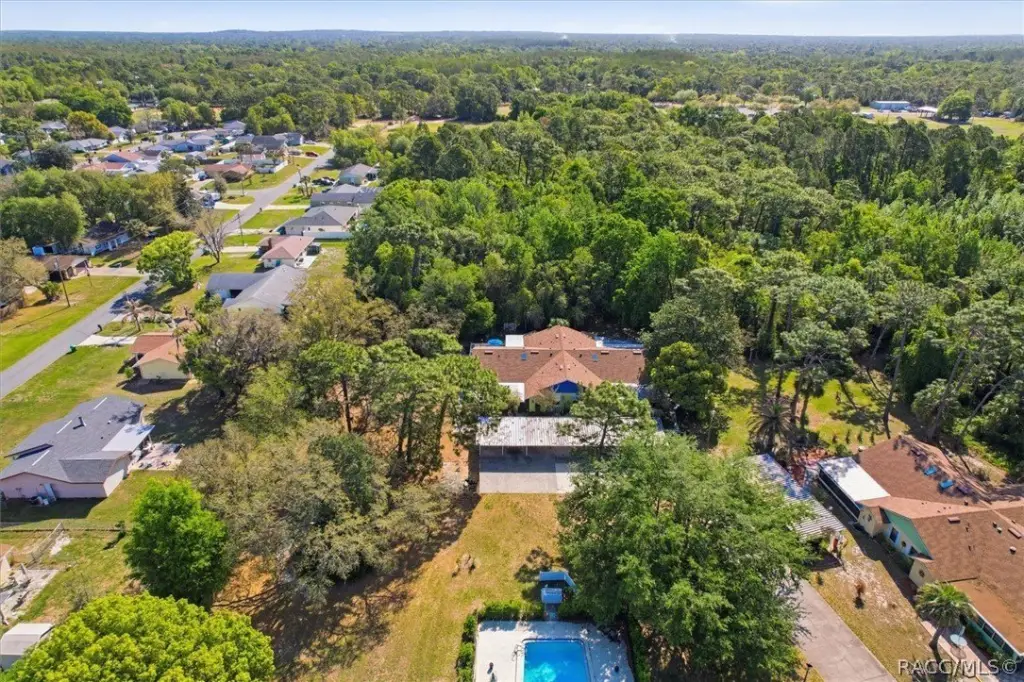
The community provides access to a pool and clubhouse and includes two designated covered parking spaces. The low monthly condo association fee is listed as $190 and includes grounds maintenance. The quadplex is also described as conveniently located near a range of amenities, including restaurants, shopping, medical facilities, banks, the Homosassa River, and the Suncoast Parkway.
Structured as four side-by-side residences under HDR zoning, the property presents a compact multifamily layout intended to combine community amenities with individual living space.
The community provides access to a pool and clubhouse and includes two designated covered parking spaces. The low monthly condo association fee is listed as $190 and includes grounds maintenance. The quadplex is also described as conveniently located near a range of amenities, including restaurants, shopping, medical facilities, banks, the Homosassa River, and the Suncoast Parkway.
Structured as four side-by-side residences under HDR zoning, the property presents a compact multifamily layout intended to combine community amenities with individual living space.
Key Highlights
- Two primary bedroom suites with split‑bedroom layout
- Enclosed Florida room (sunroom) adds extra living space; home has just over 1,400 SF
- New roof (2023) and new sunroom roof (2024); new AC (12/2025)
Financial Insights For Multifamily LT 5
Simulate Cap Rate and NOI
NOI Build-Up
- Vacancy
- income lost from leasable area expected to sit empty during the year — subtracted from gross rent.
- EGI (Effective Gross Income)
- gross rent minus vacancy losses — the realistic income before paying operating costs.
- OpEx (Operating Expenses)
- recurring costs to operate the property (property tax, insurance, utilities, maintenance, management) — excludes financing and capital improvements.
- NOI (Net Operating Income)
- income a property generates after operating costs but before financing and taxes.
| Component | $ | $/SF |
|---|---|---|
| Gross rent | $14.2k | $13.80 |
| − Vacancy | −$779 | −$0.76 |
| EGI | $13.4k | $13.04 |
| − OpEx | −$4.0k | −$3.91 |
| NOI | $9.4k | $9.13 |
1,026 SF · lease $13.80/SF/yr · vacancy 5.50% · expense 30.00%
Alternative Uses
Best Use
Multifamily LT 5
$133.8K
$117.1K – $156.1K
NOI $9,366 @ 7.0% cap · market cap 5.35%
Second Best
Apartment 5plus
$122.8K
$107.4K – $143.2K
NOI $8,593 @ 7.0% cap · market cap 4.91%
Theoretical Best
Specialty Retail
$230.5K
$201.7K – $269.0K
NOI $16,138 @ 7.0% cap · market cap 9.22%
Zoning and permitted uses should be independently verified with authorities.
Property Analytics
Property Profile
Location Intelligence
Current Use




Frequently Asked Questions
What type of property is this?
Quadplex - Move-in-ready four-residence quadplex with two primary suites and an enclosed Florida room, plus community pool and clubhouse access.
Where is this quadplex located?
The property is located at 8324 W Earl Loop Homosassa, FL.
What is the asking price?
The asking price for this property is $175,000.
What are key features of this property?
This property features: Two primary bedroom suites with split‑bedroom layout; Enclosed Florida room (sunroom) adds extra living space; home has just over 1,400 SF; New roof (2023) and new sunroom roof (2024); new AC (12/2025)