Completely Renovated Two-Unit
83 Capisic Street Portland, ME 04102
83 Capisic Street, Portland, ME, 04102
$950,000
For Sale
$950,000
MULTI_FAMILY - Portland, ME
Property Size2,432 SF
Lot Size0.48 Acres
Price / SF$390.63
Days on Market10
Property Features for 83 Capisic Street
General Information
- Property type
- Residential Multi Family
- Property subtype
- Other
- Zoning
- R3
- Bathrooms
- 2
- Rooms
- Basement, Bathroom 2, Bathroom 1
- Interior features
- Attic, Bathtub, Shower, Storage
- Basement
- Unfinished, Full, Walk-Out Access
- Standard status
- Active
- Size
- 2,432 SF
- Lot size
- 0.48 Acres
Taxes and HOA fees
- Tax Year
- 2024
- Tax Annual Amount
- 7031
Utilities
- Sewer type
- Public Sewer
- Heating system
- Forced Air, Heat Pump (Heating), Oil, Electric (Heating)
- Cooling system
- Heat Pump
- Water source
- Public
Building Details
- Year built
- 1945
- Floors in Building
- 2
- Number of units
- 2
- Flooring type
- Wood, Tile
- Building materials
- Wood Frame, Vinyl Siding
- Roof type
- Shingle
- Additional Structures
- Storage
Listing agency
Landmark Realty
(207) 807-7889
Listed by
Edward Dickhaut IV
(207) 749-0524
Added: Jul 13 Checked: Jul 22 at 6:06PM
MLS# 1671222
Copyright © 2026 Maine Listings. All rights reserved. All information provided by the listing agent/broker is deemed reliable but is not guaranteed and should be independently verified.
Investment Insights
Based on property information with market context.
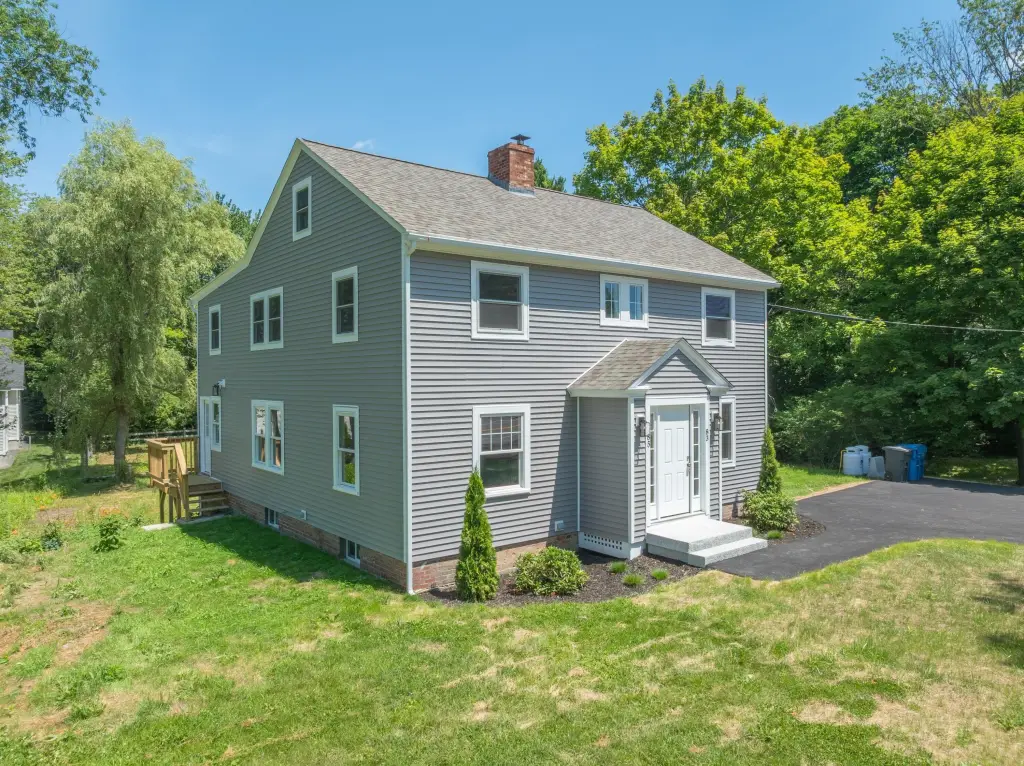
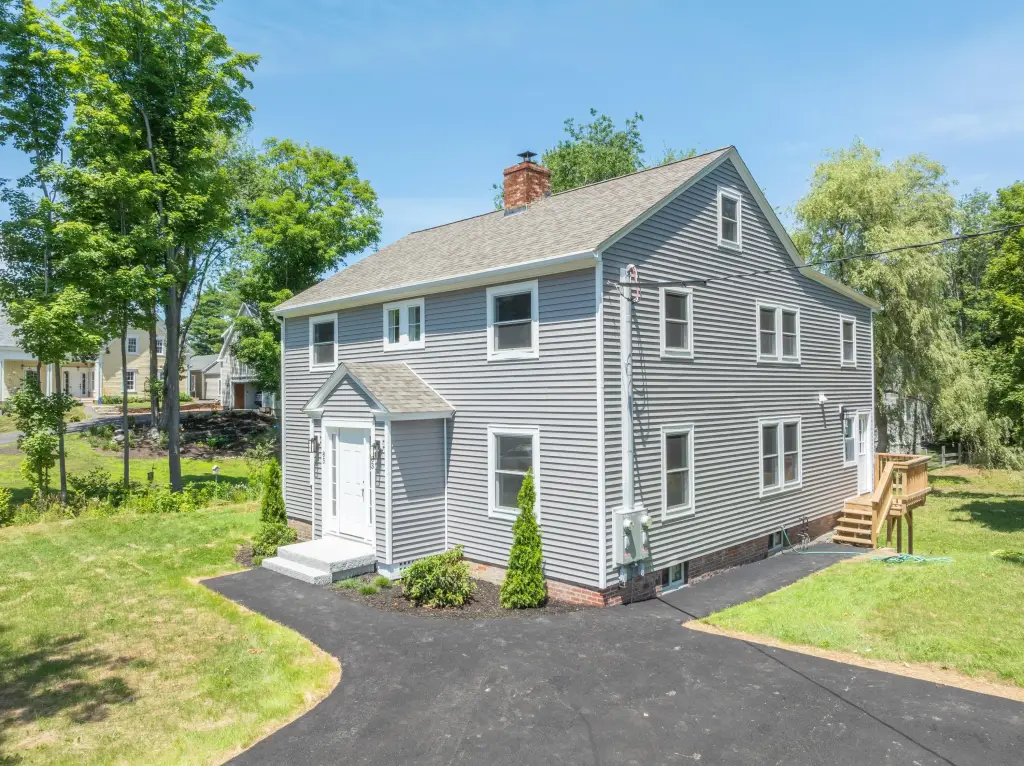
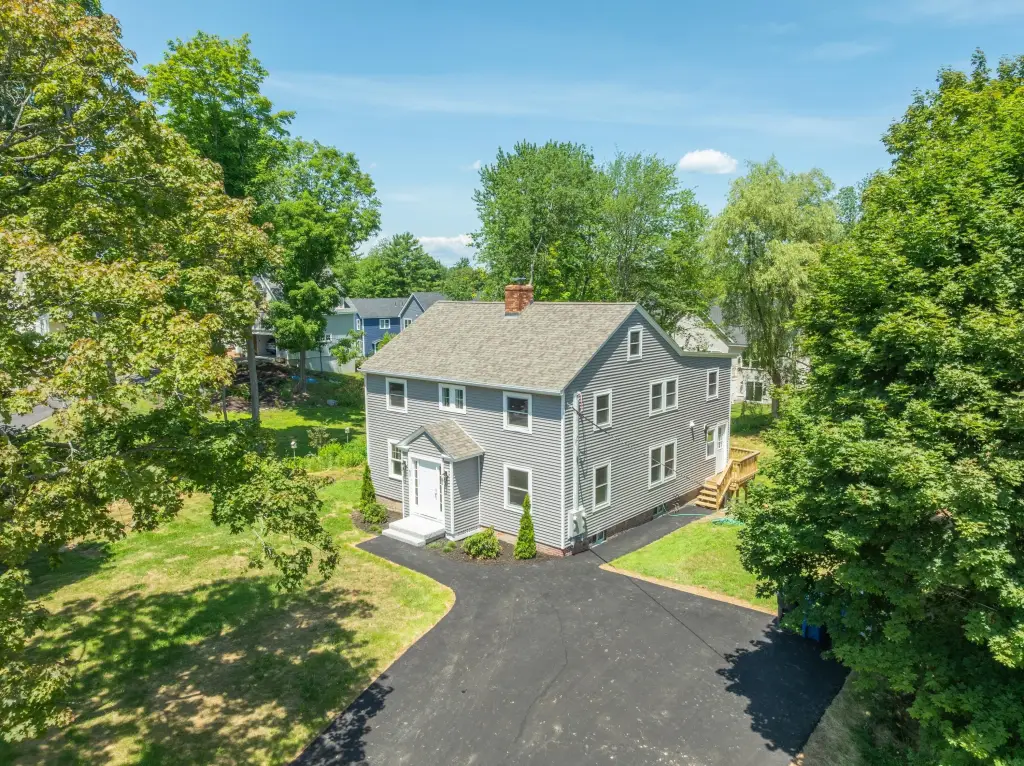
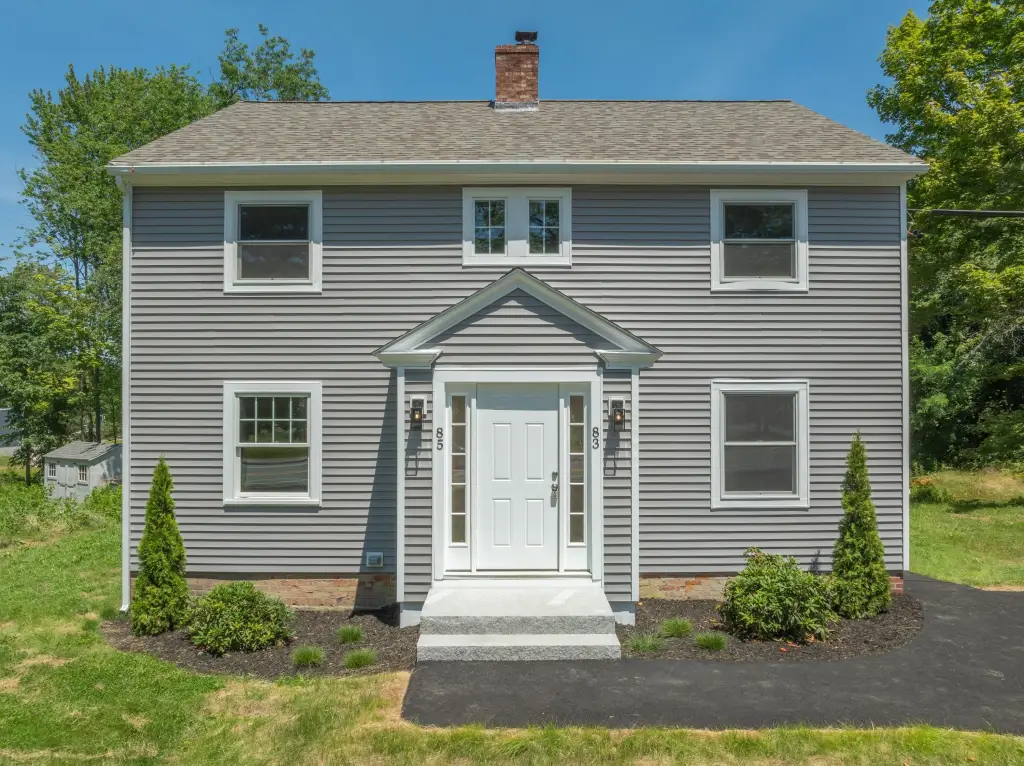
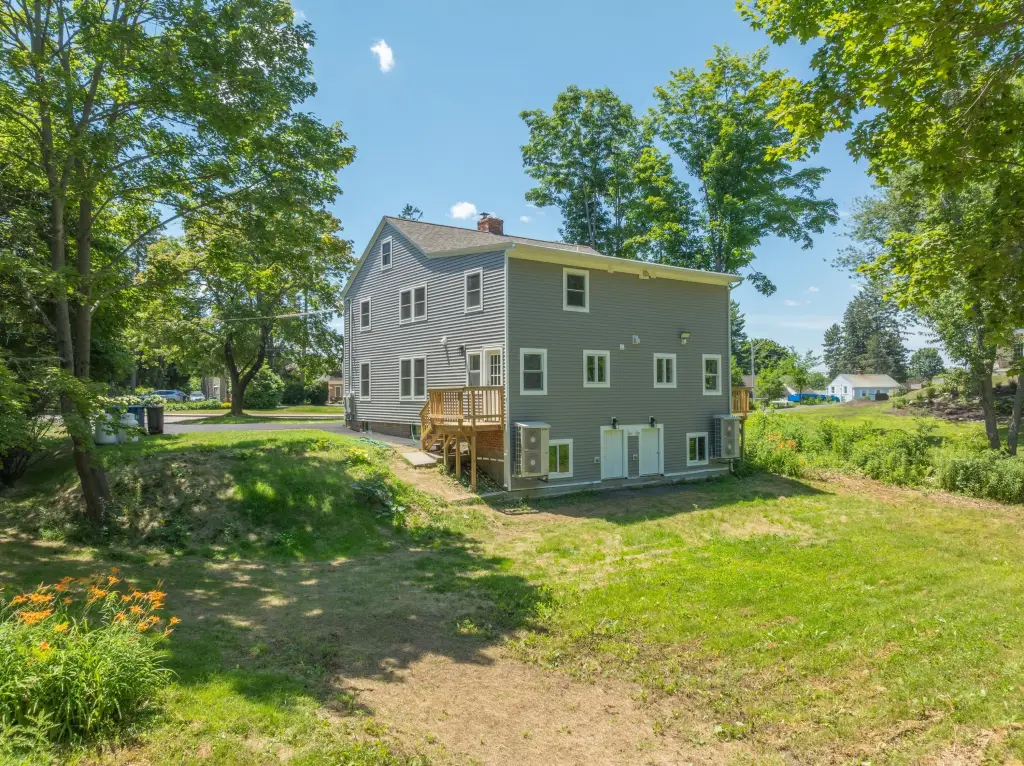
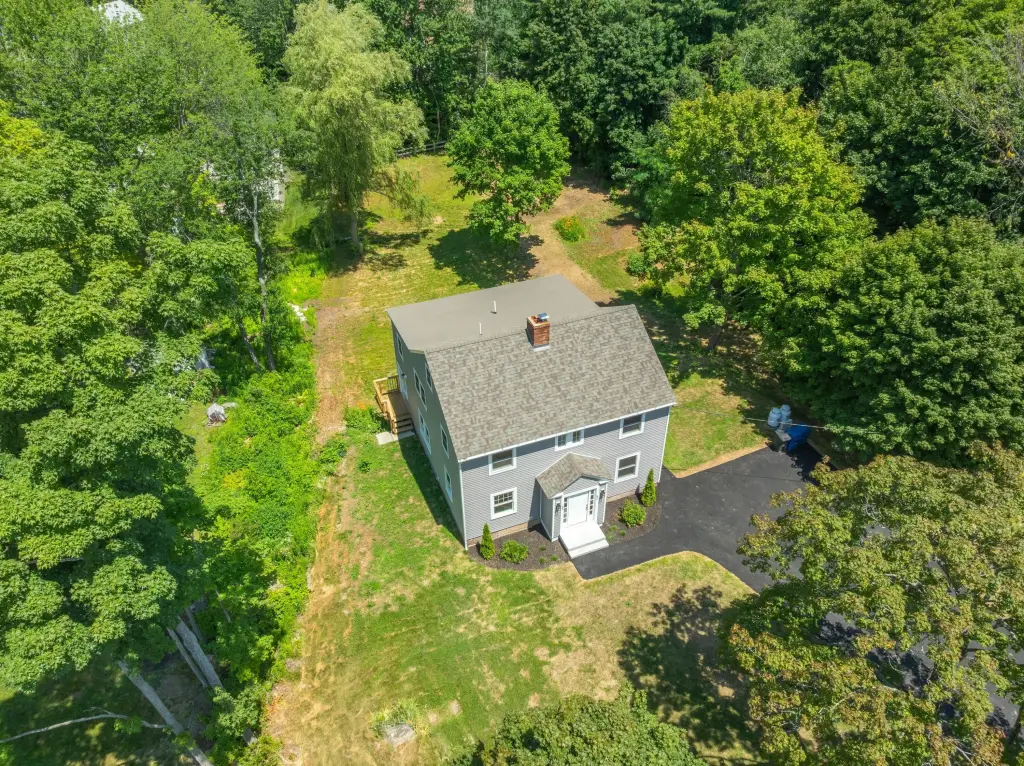
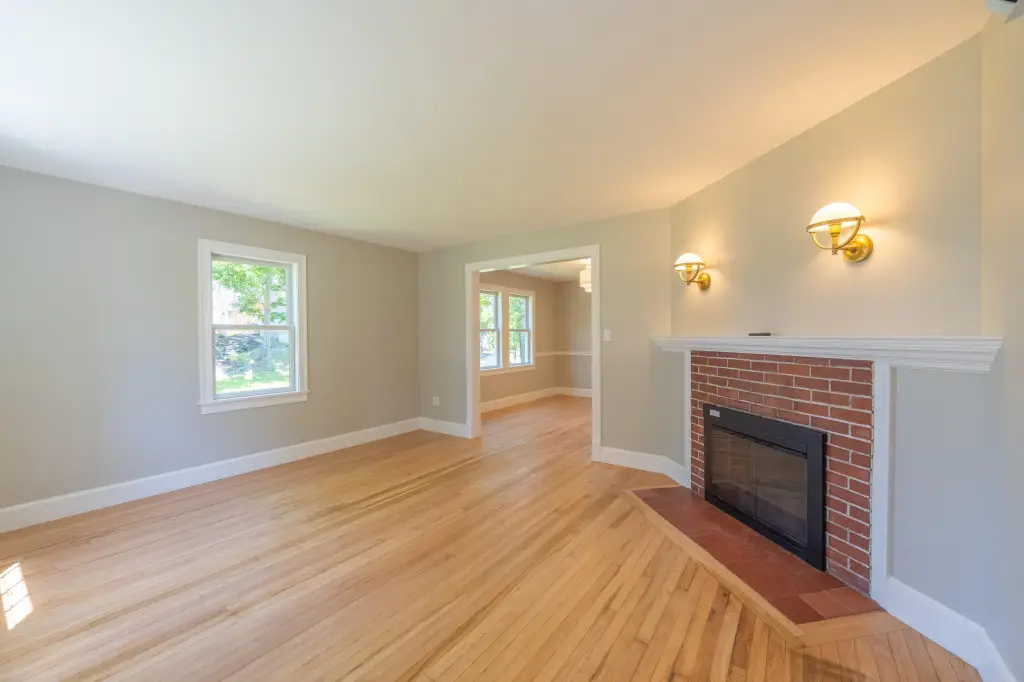
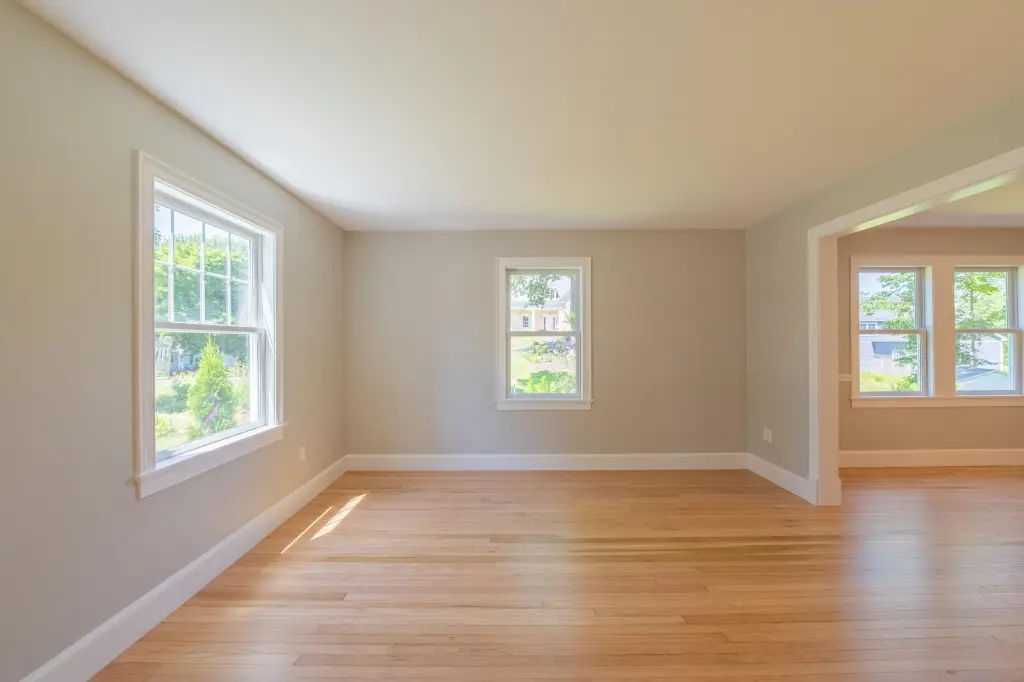
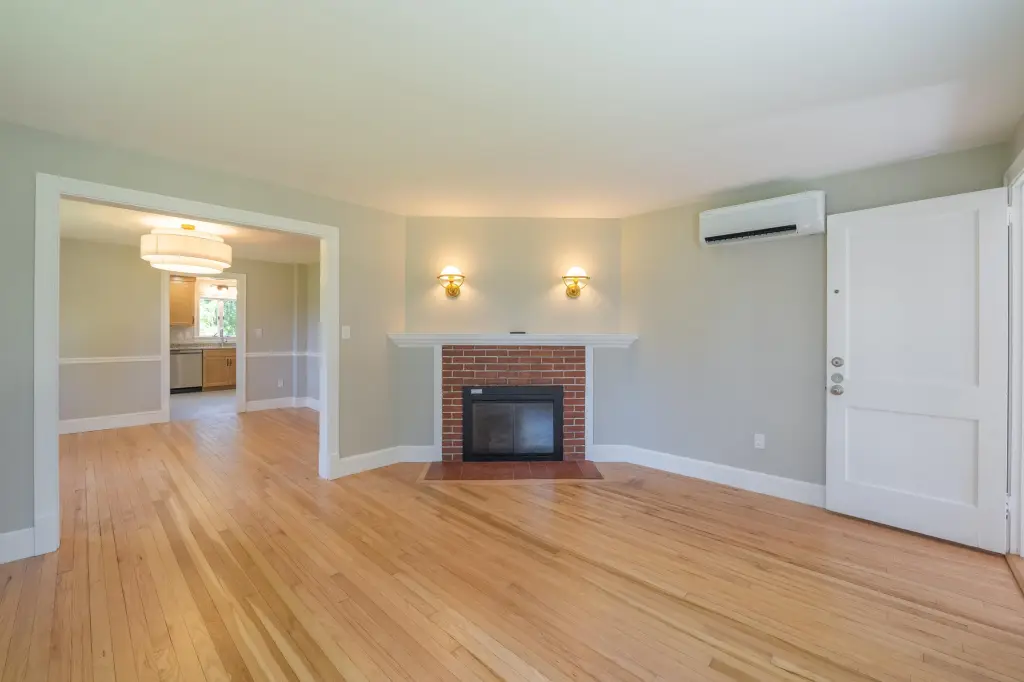
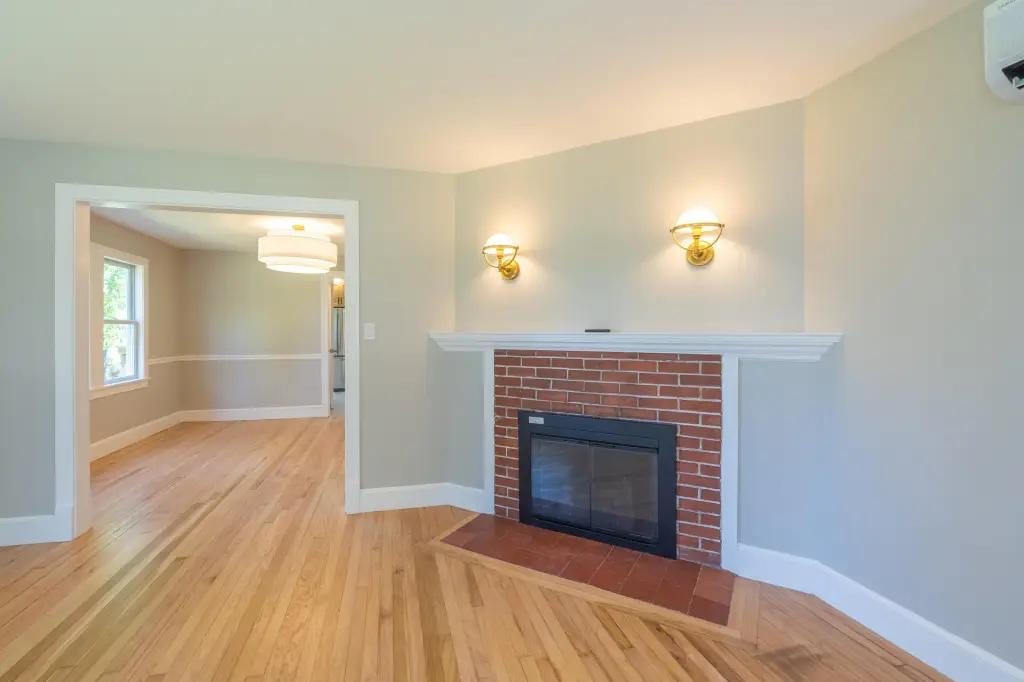
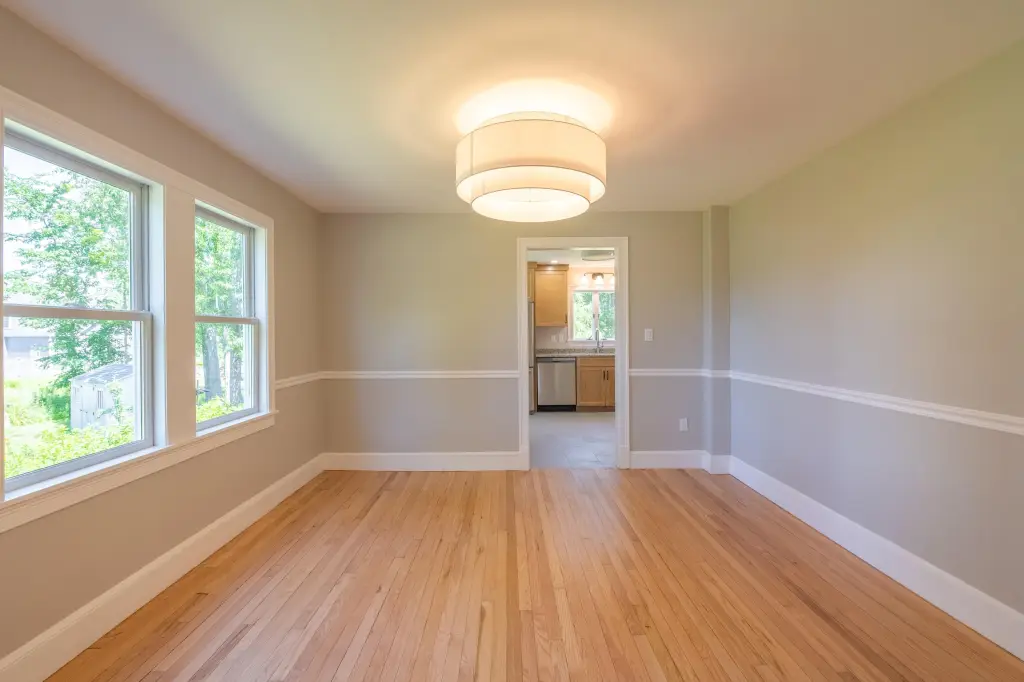
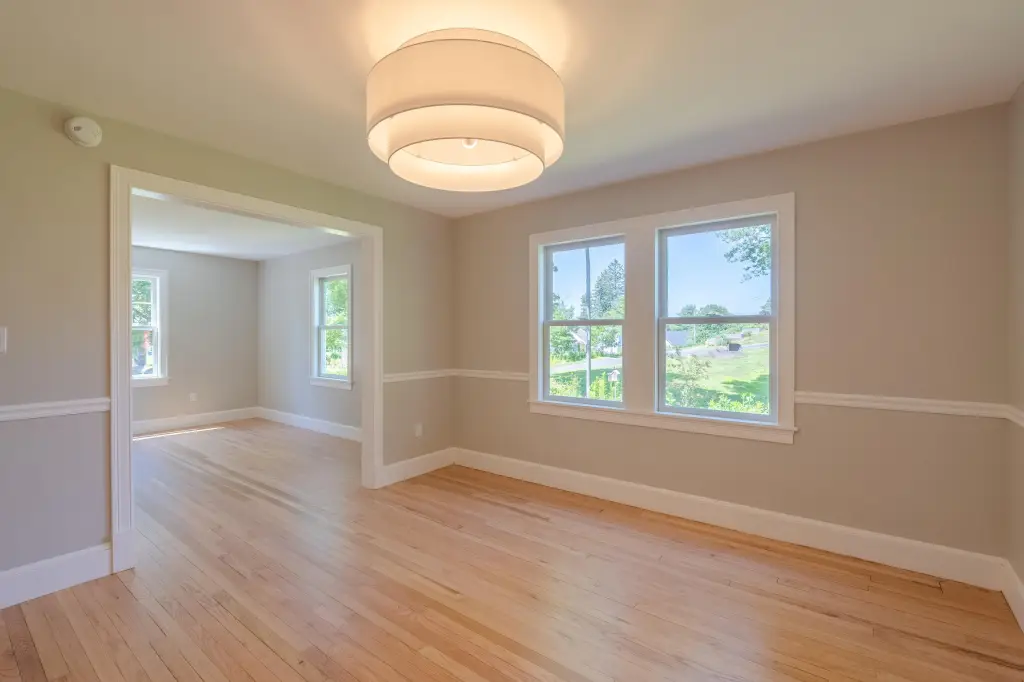
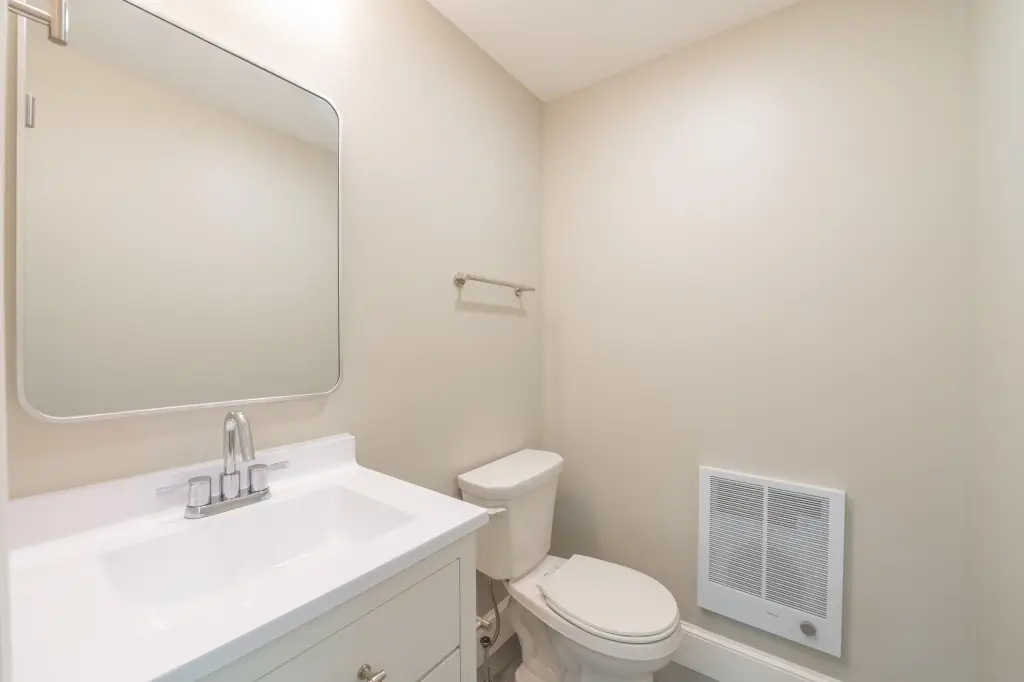
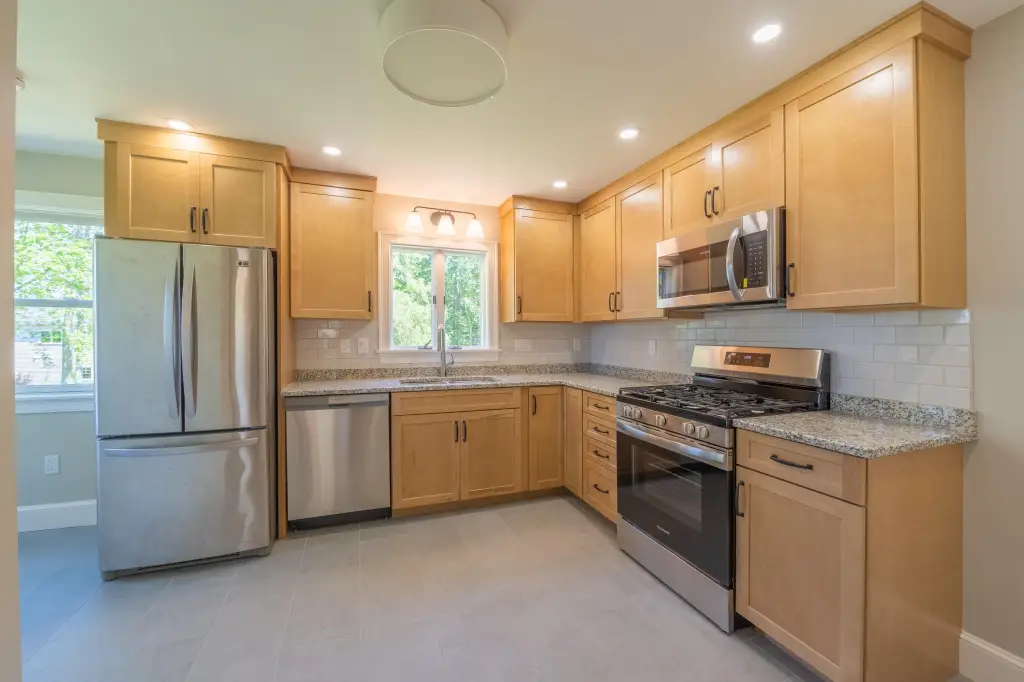
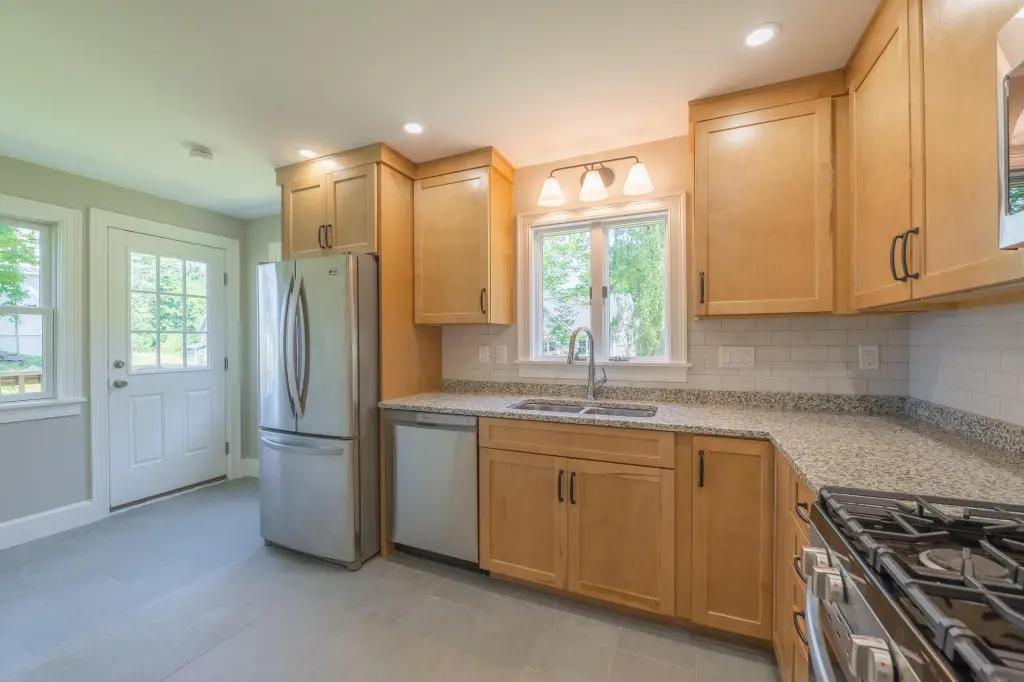
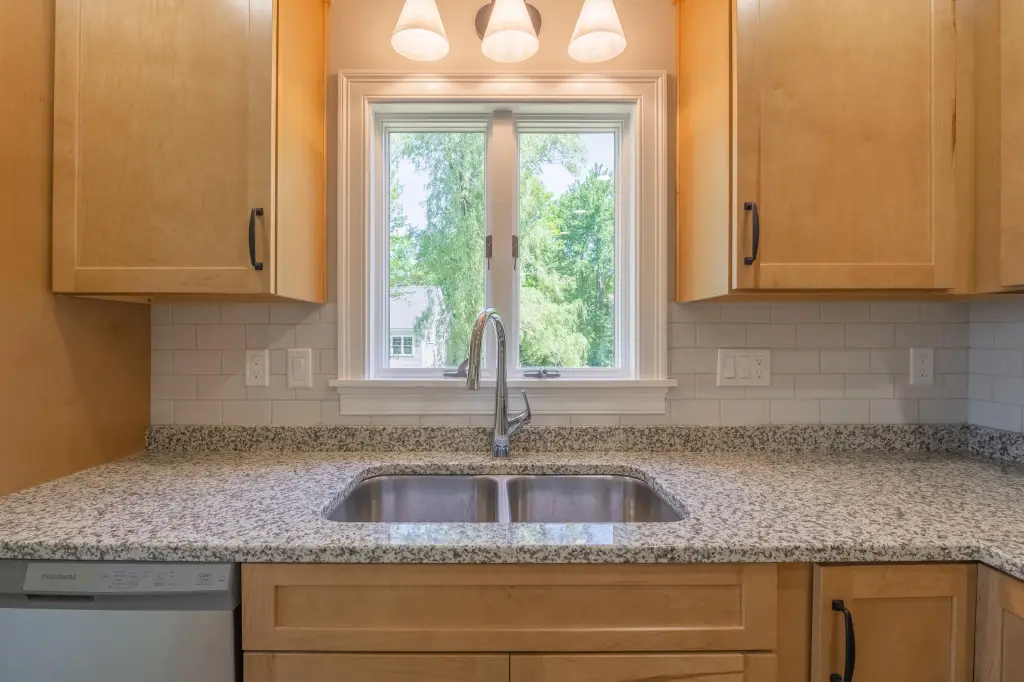
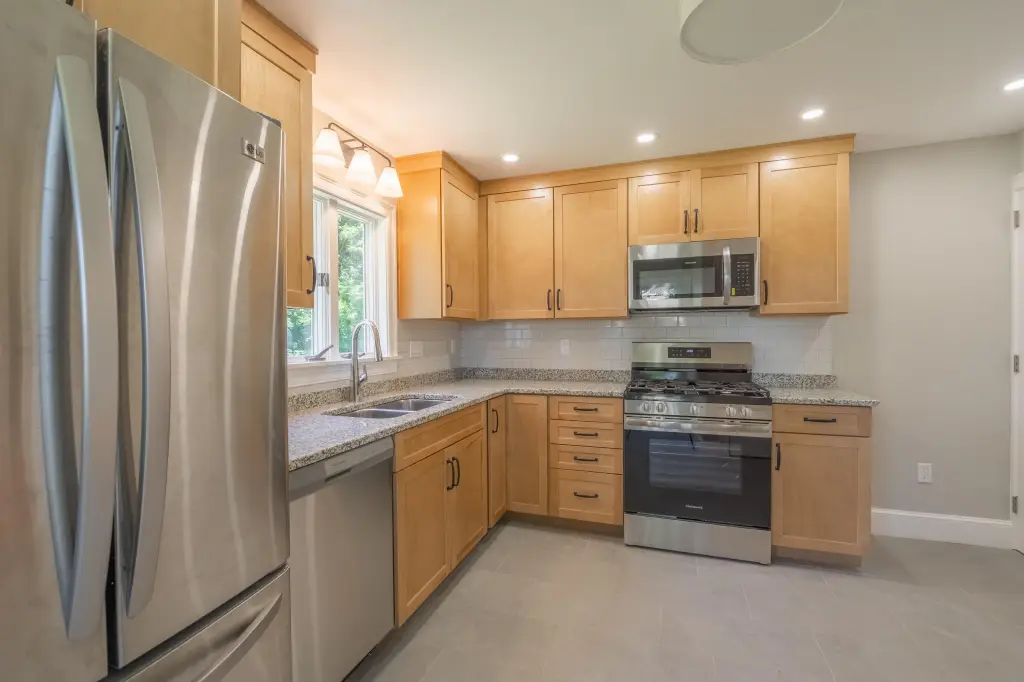
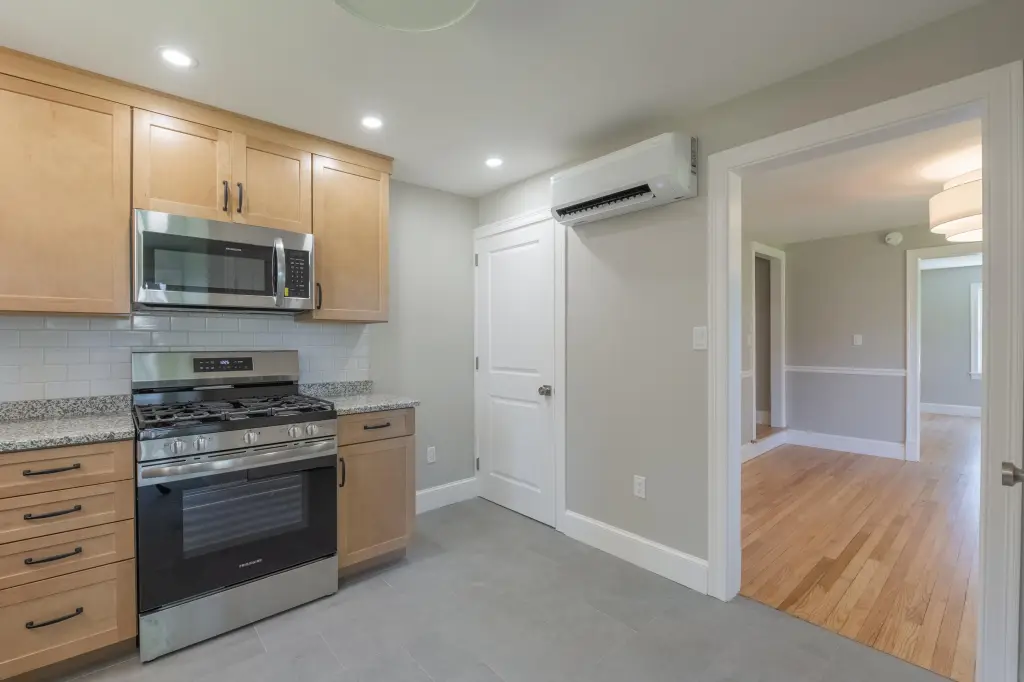
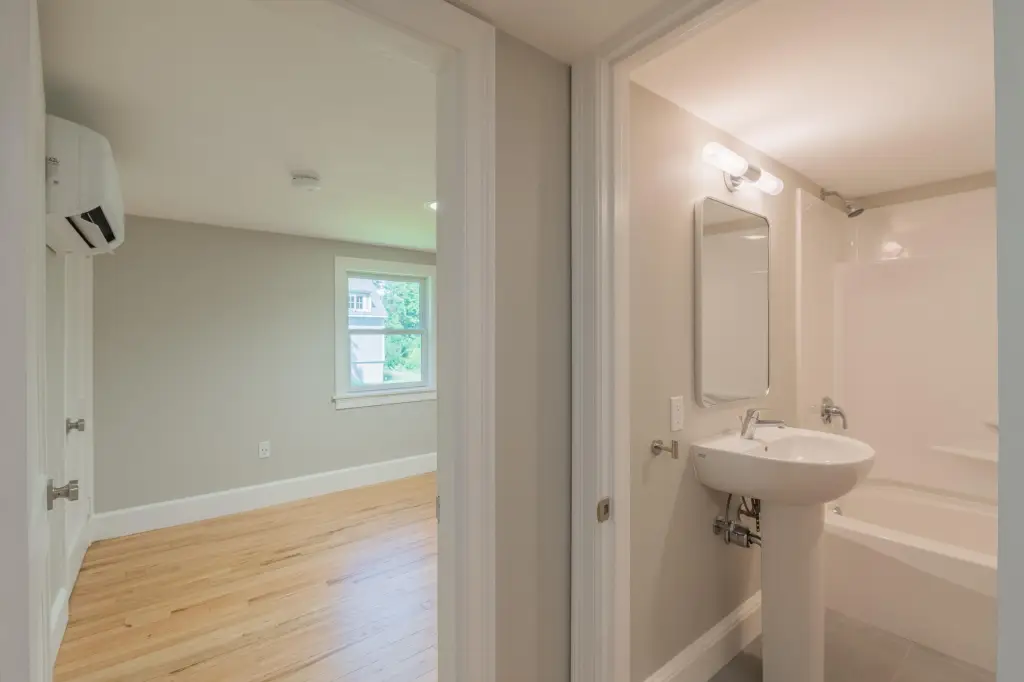
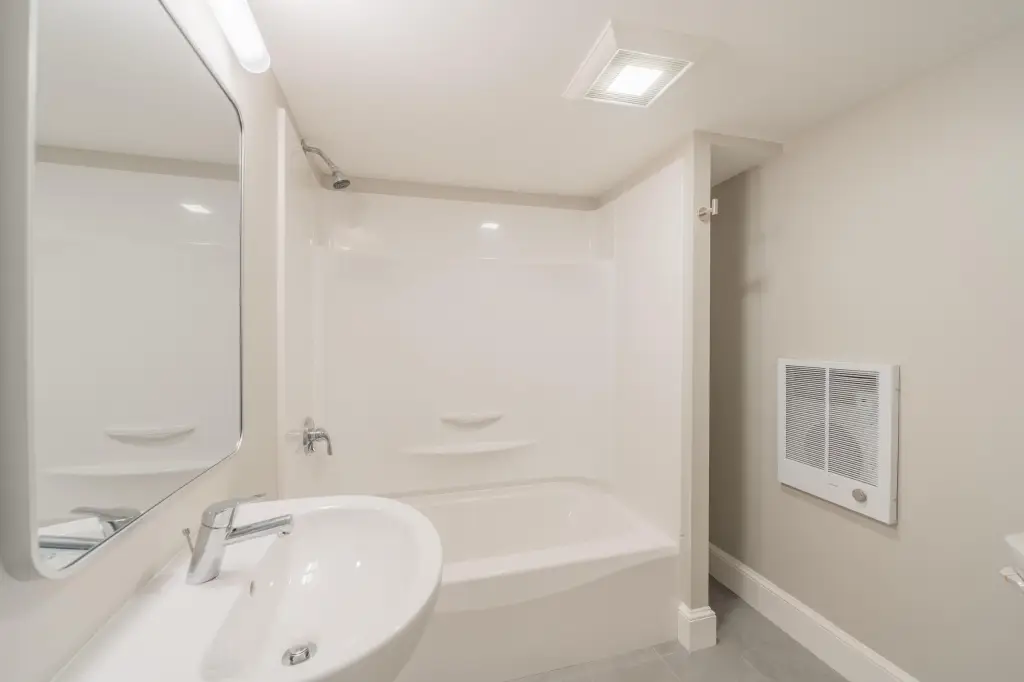
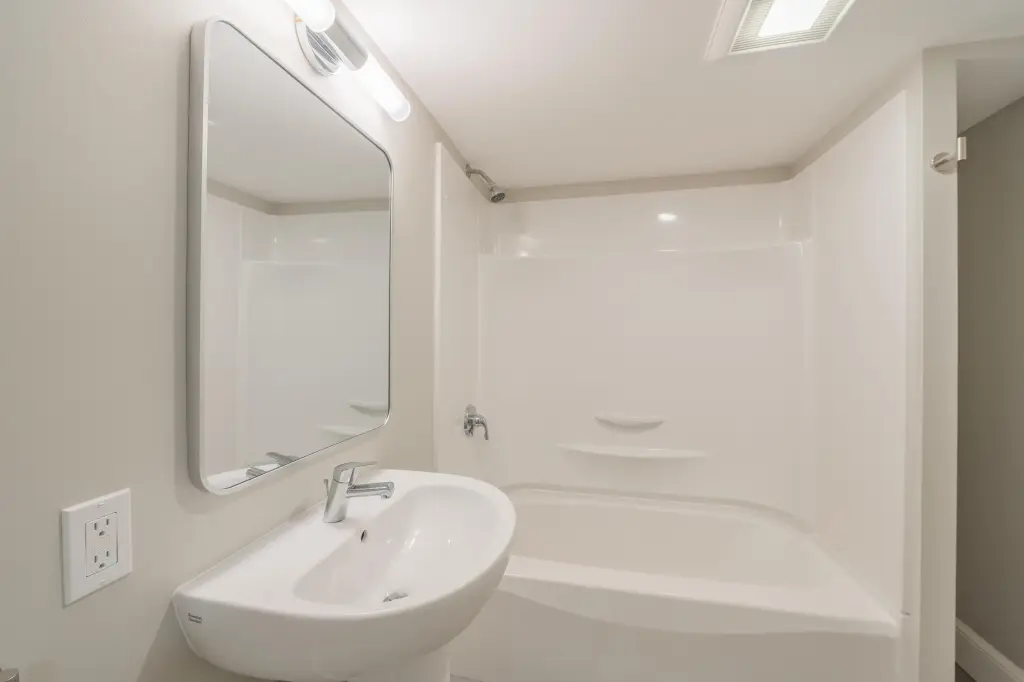
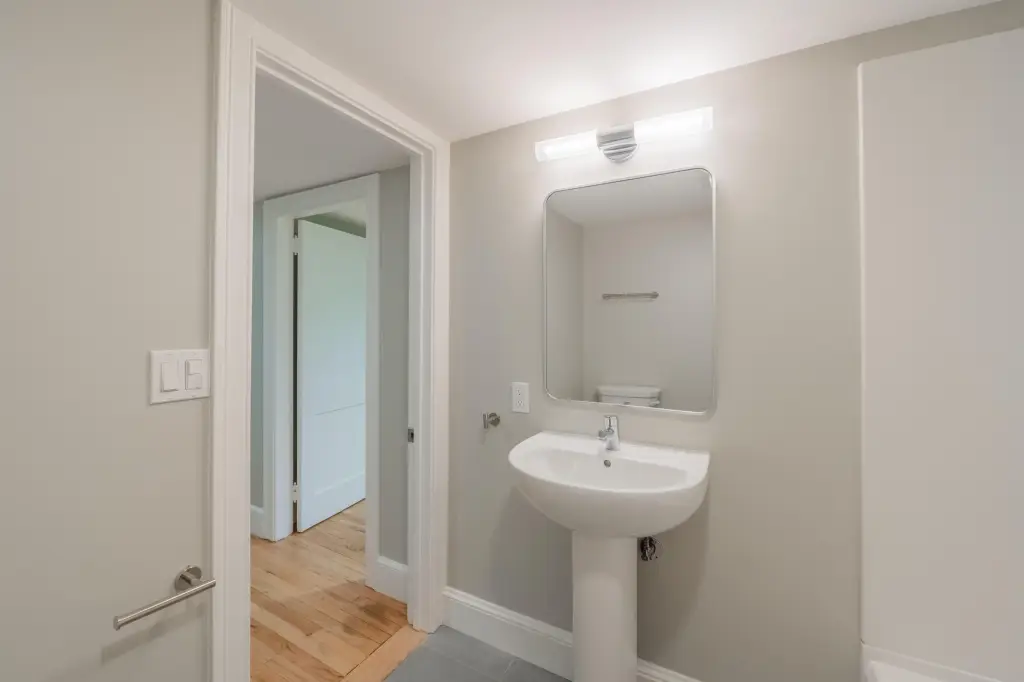
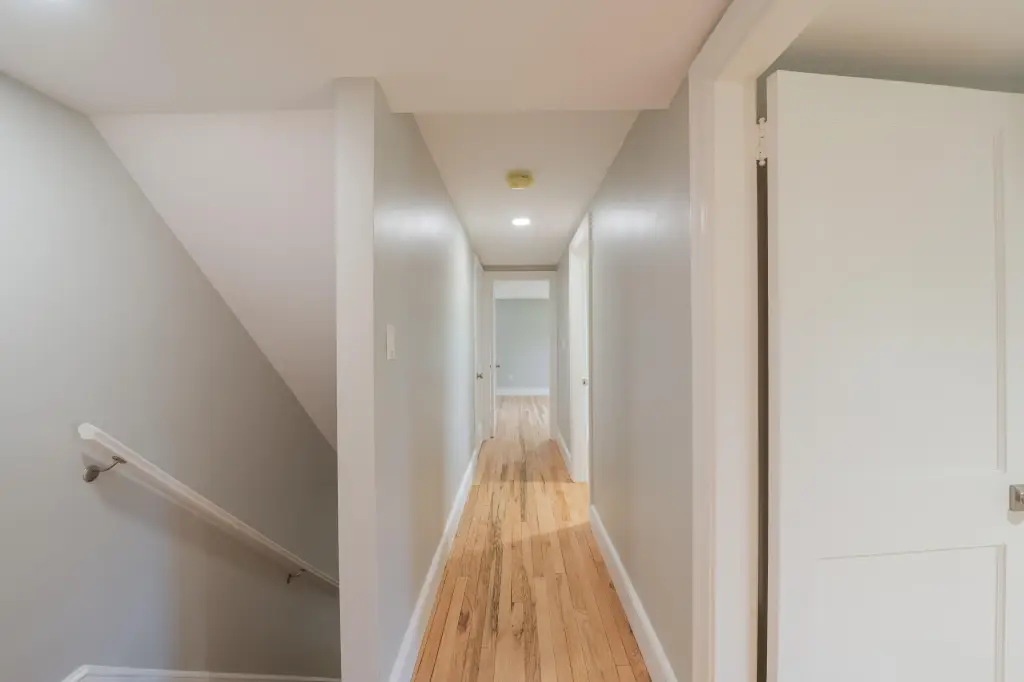
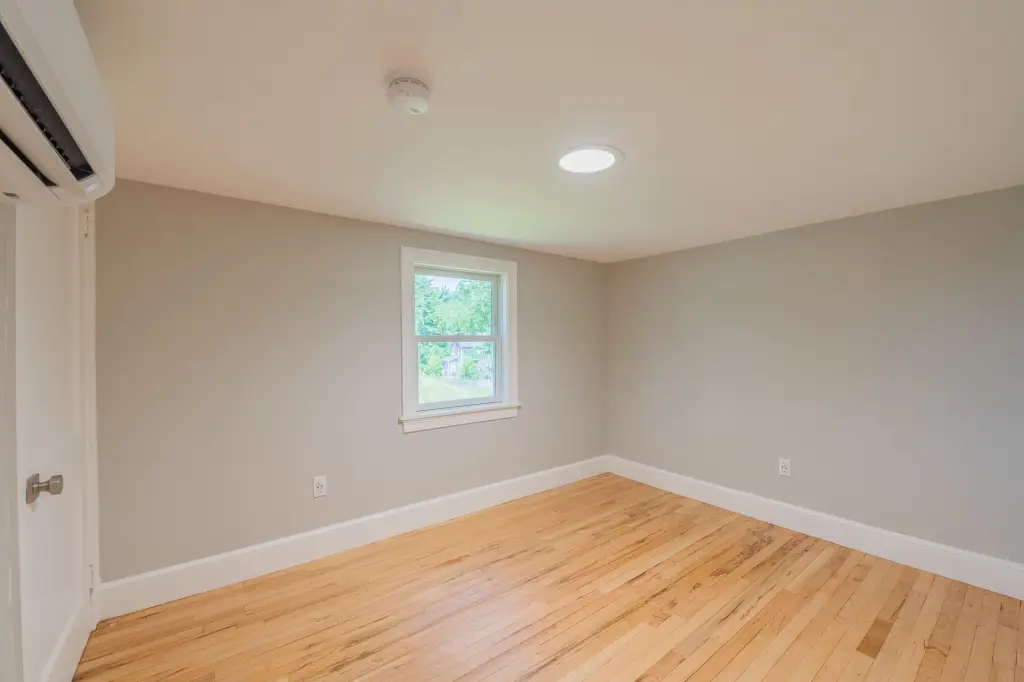
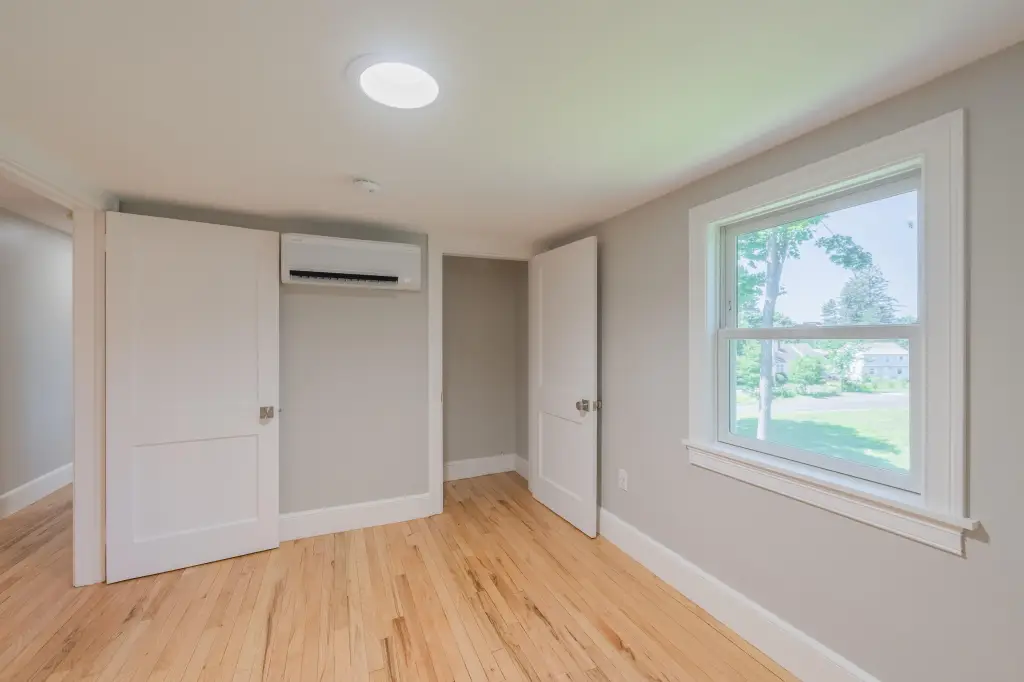
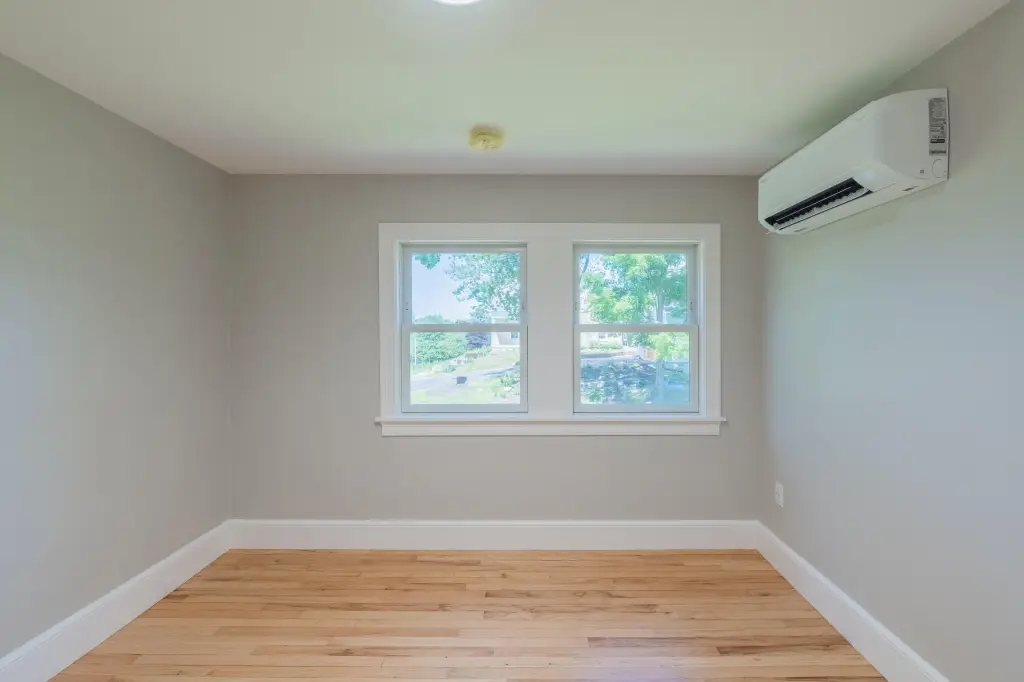
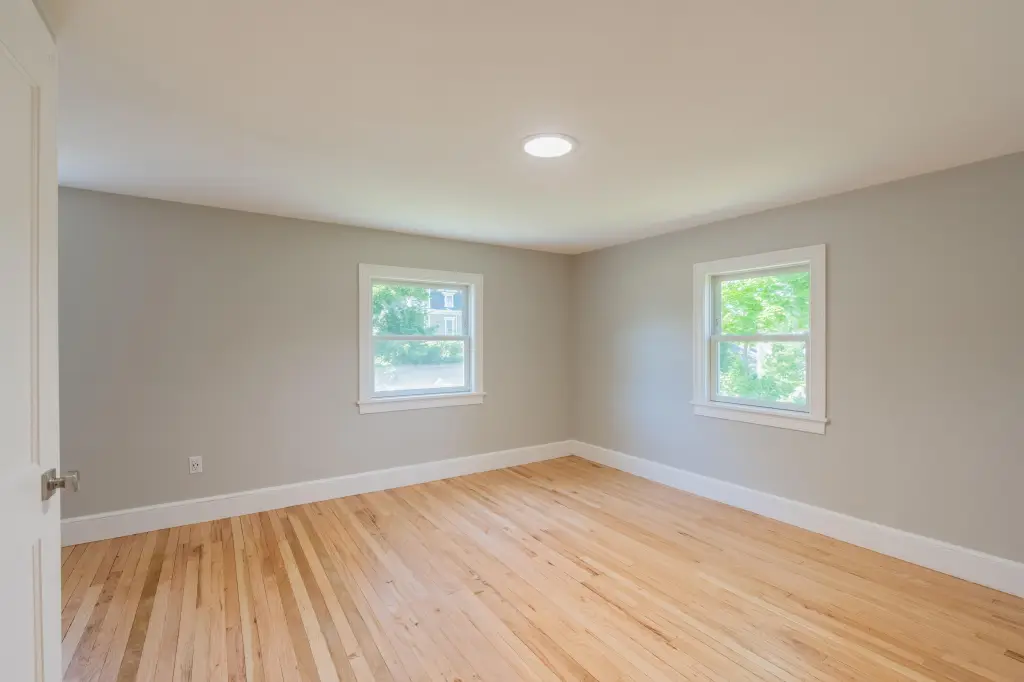
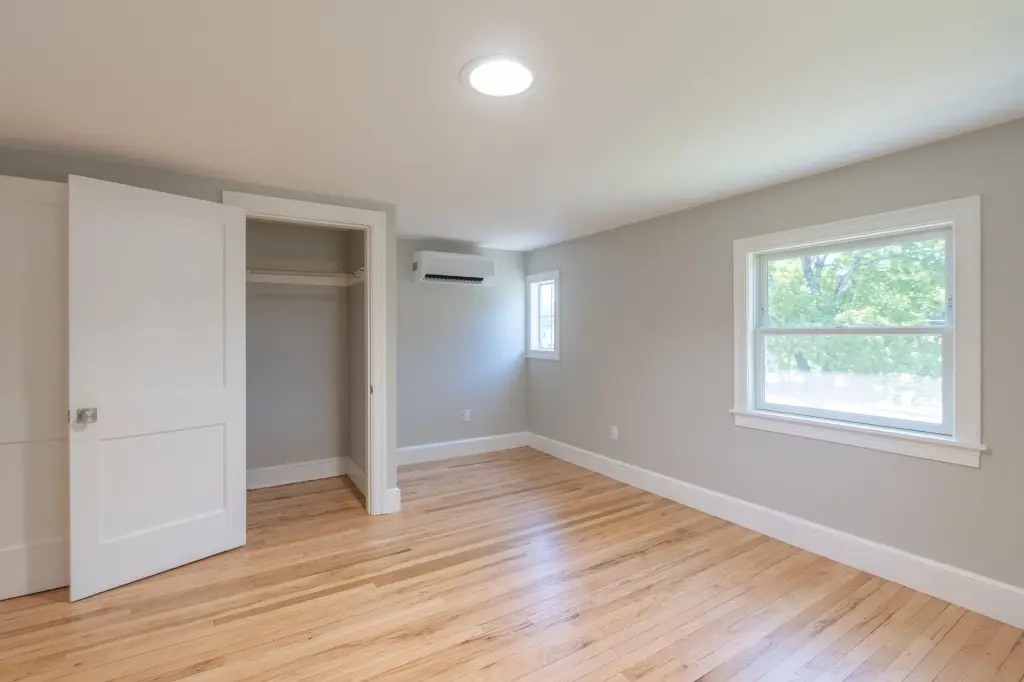
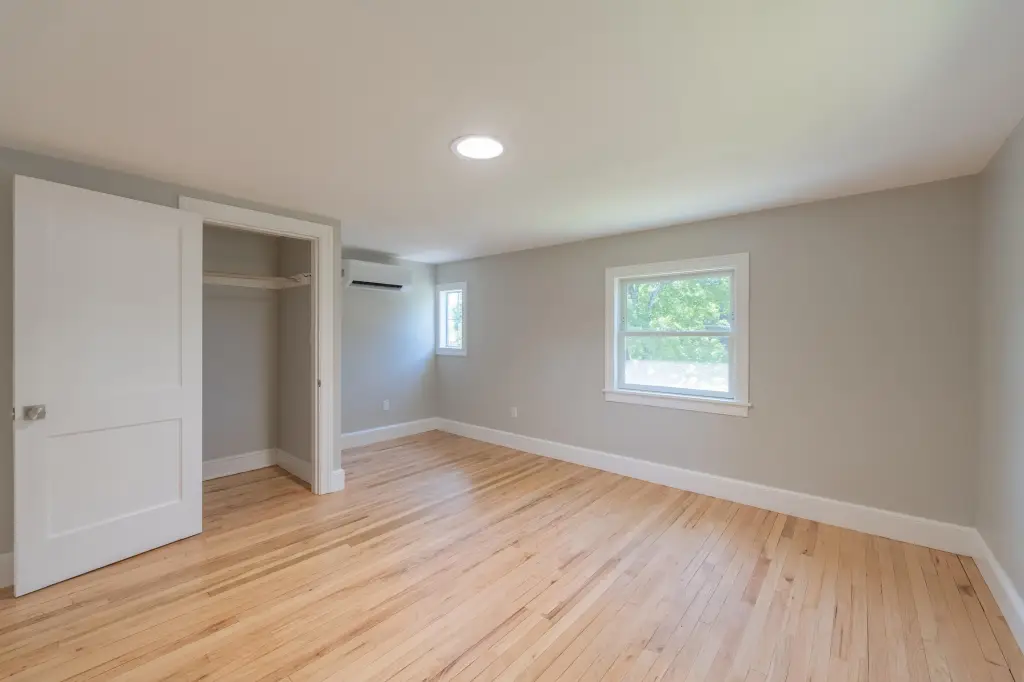
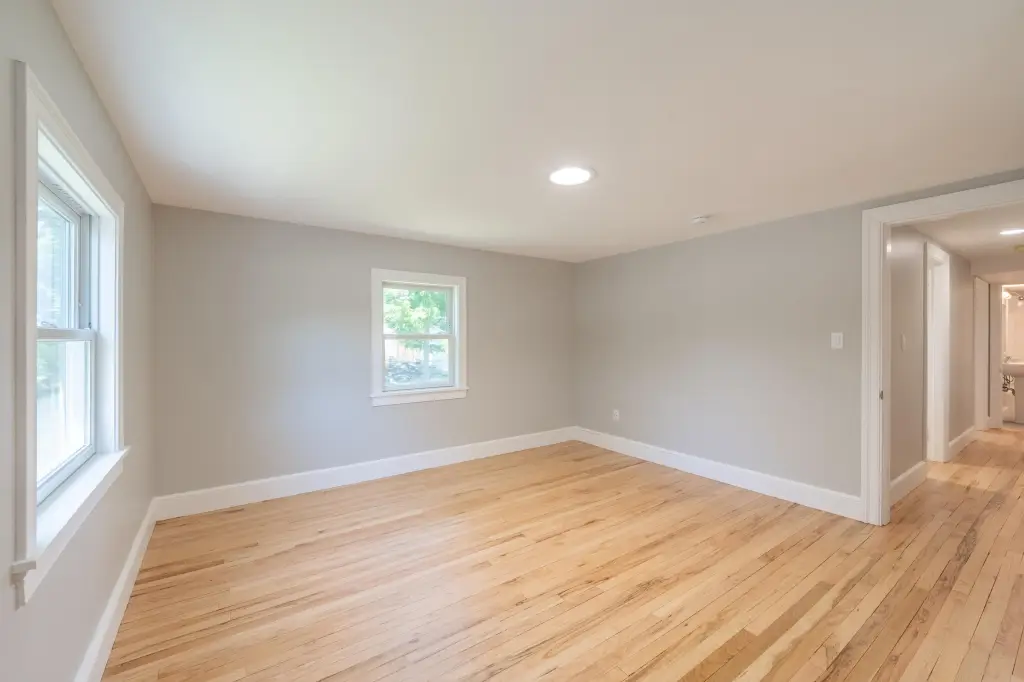
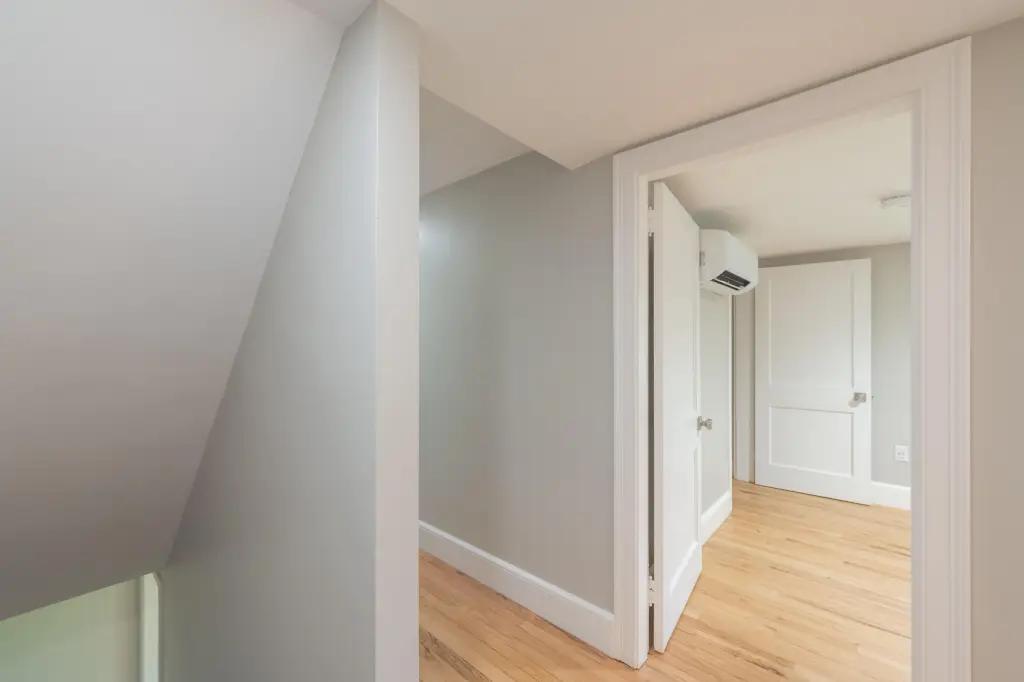
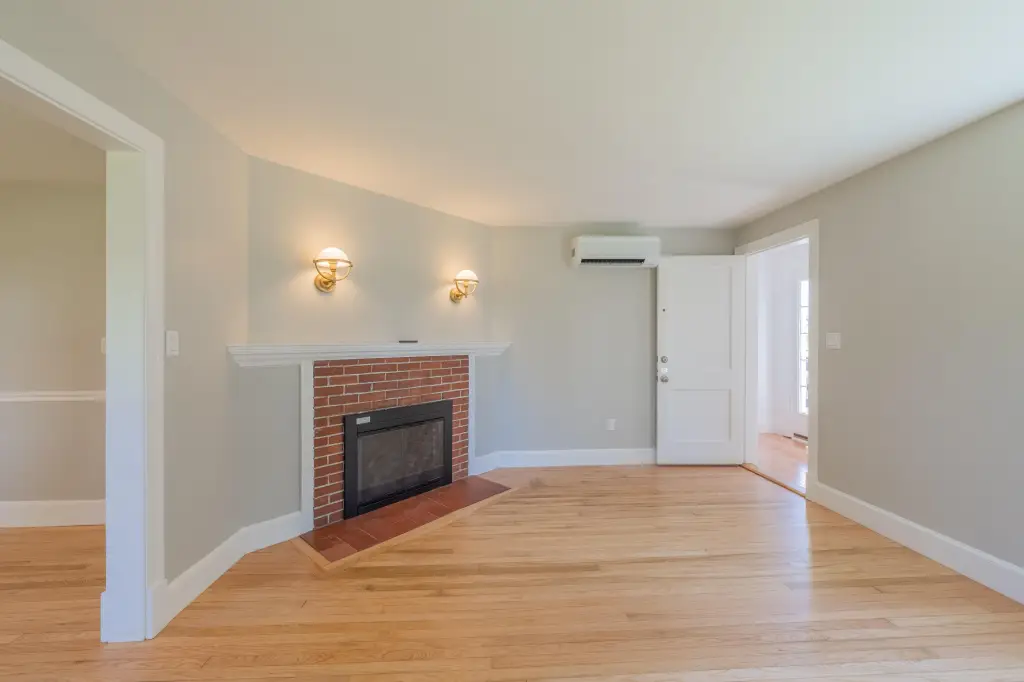
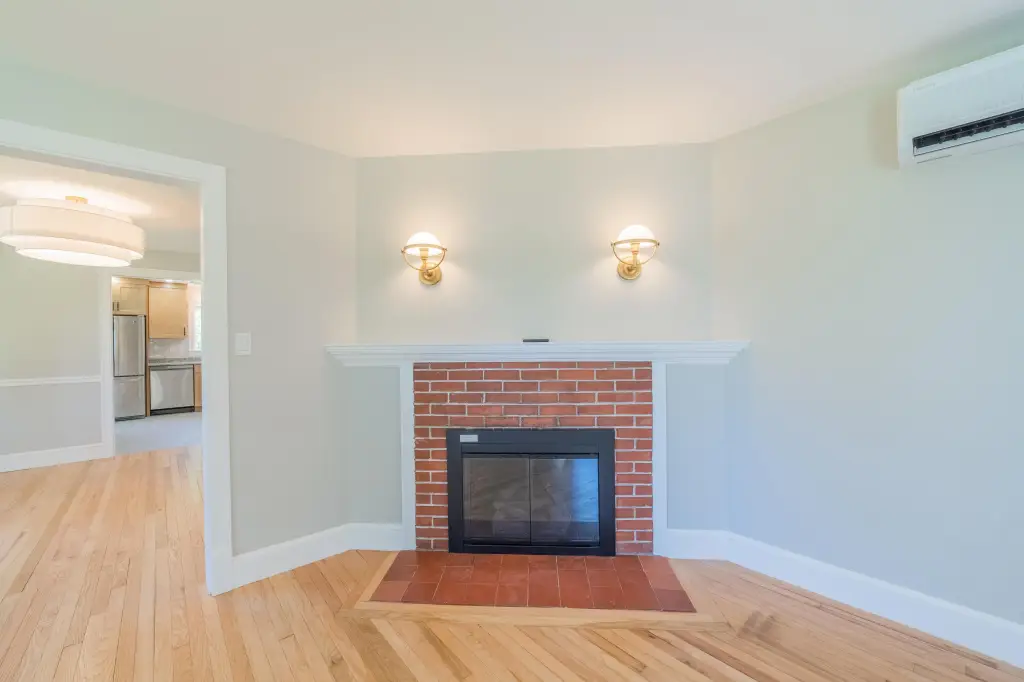
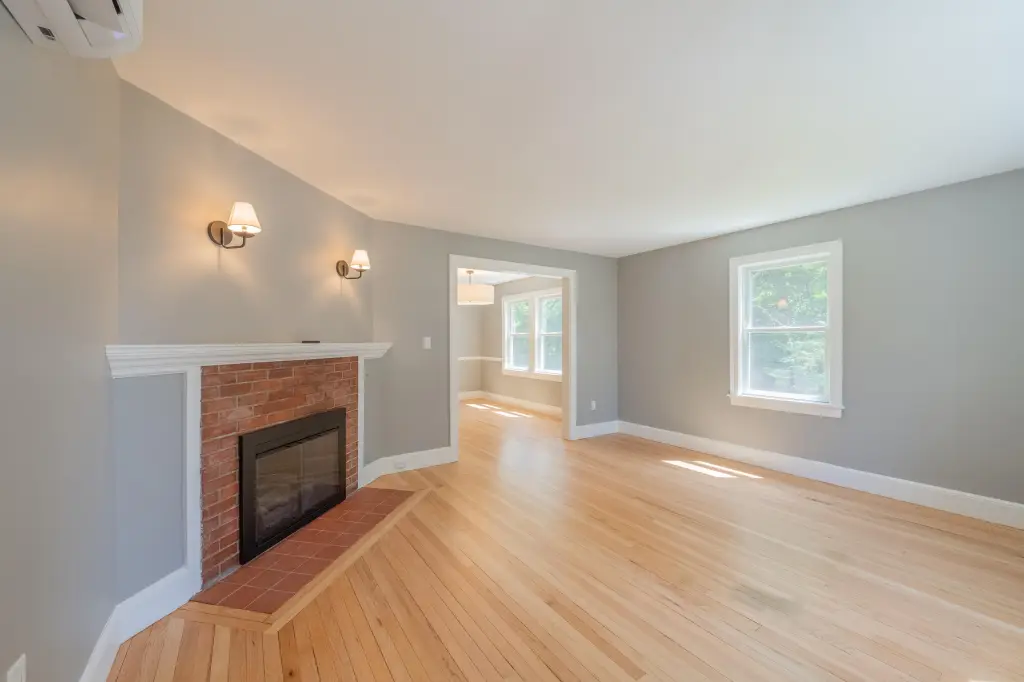
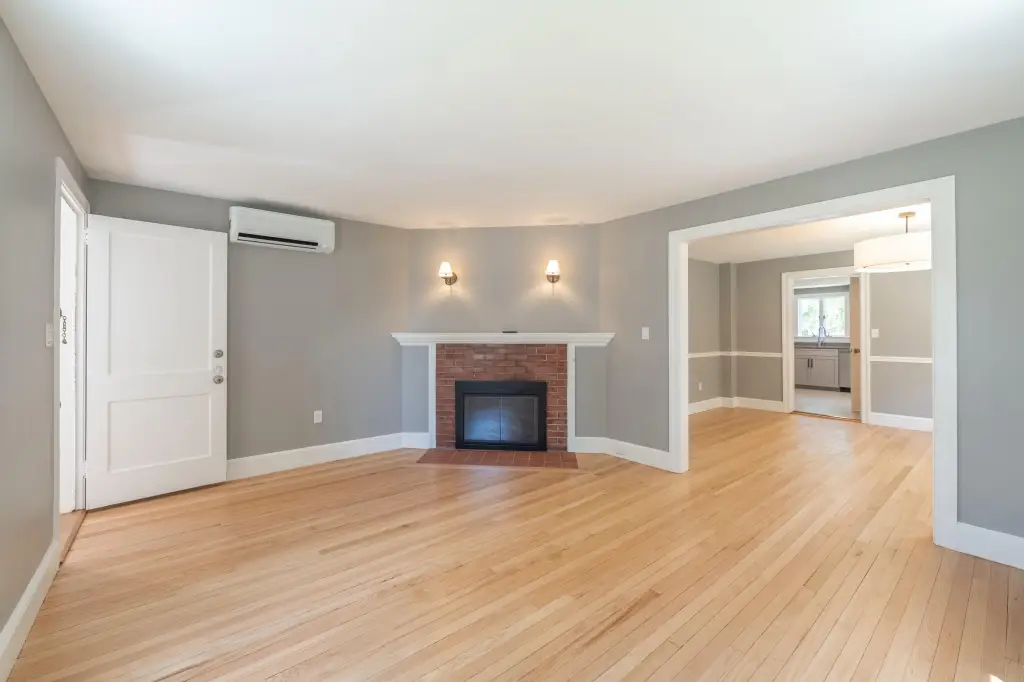
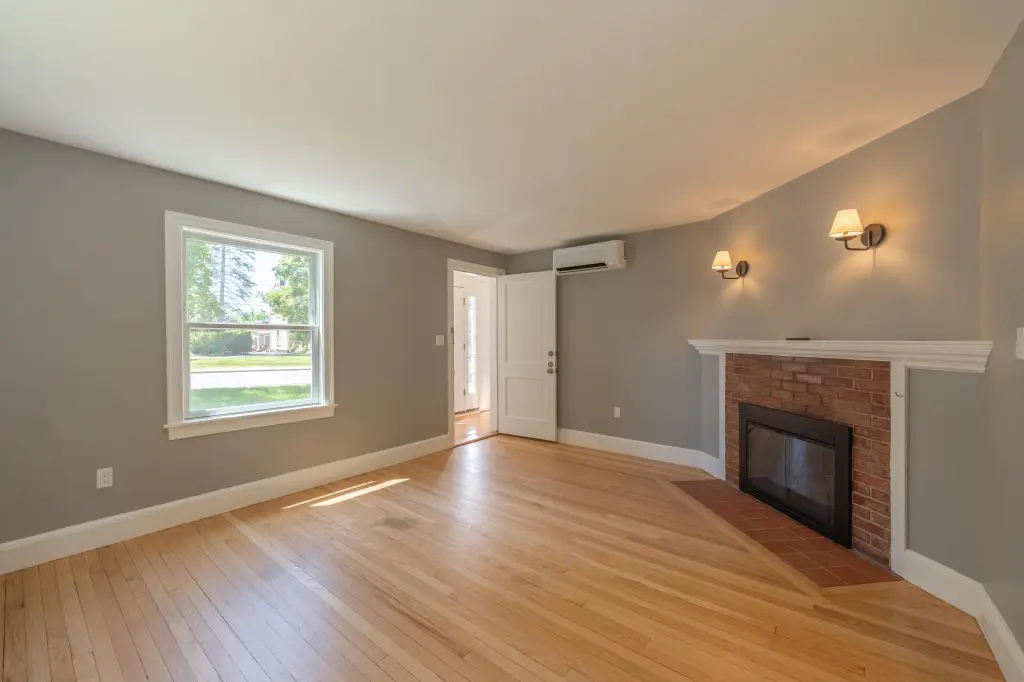
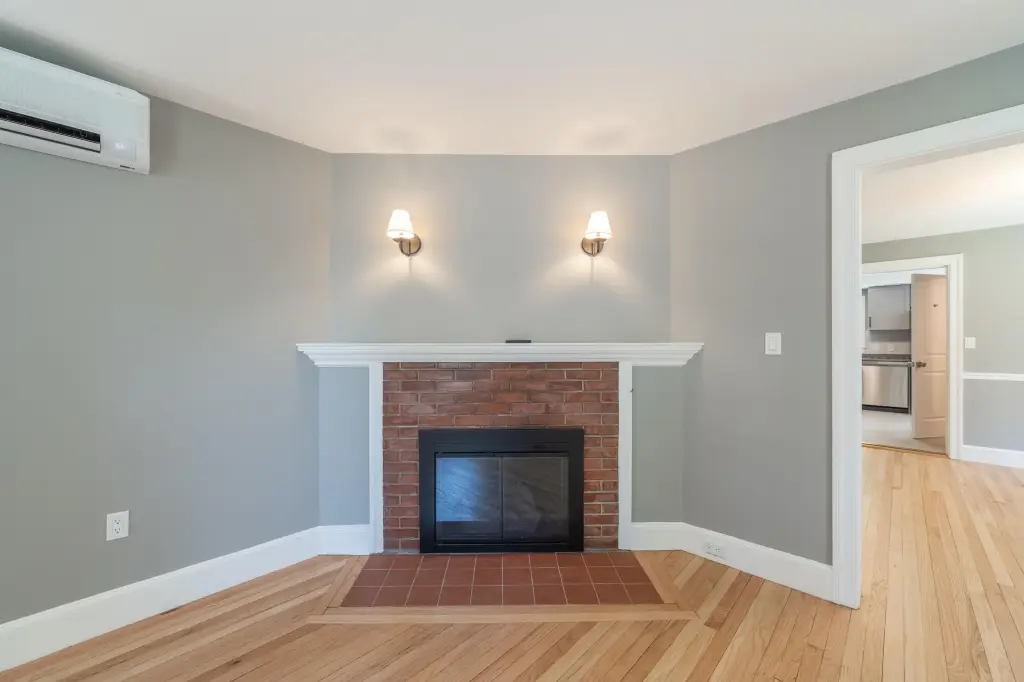
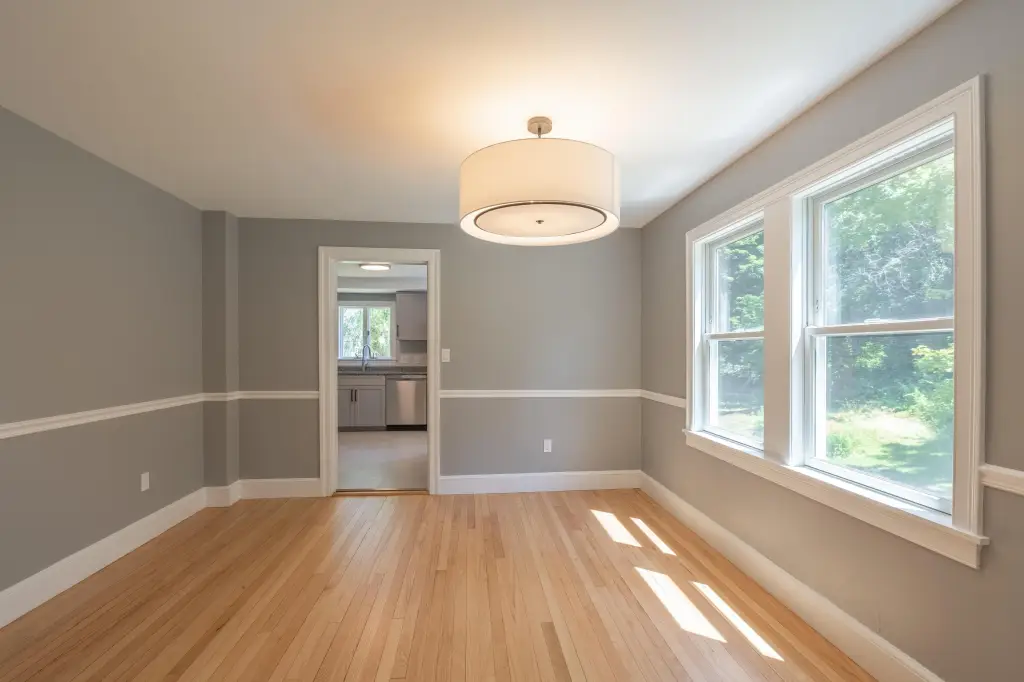
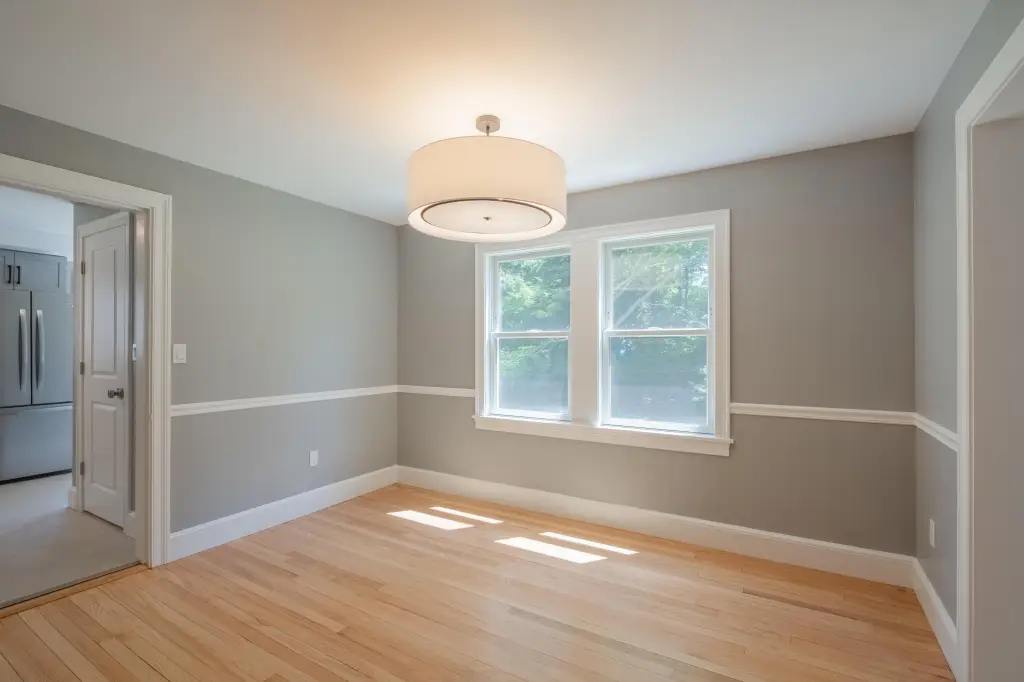
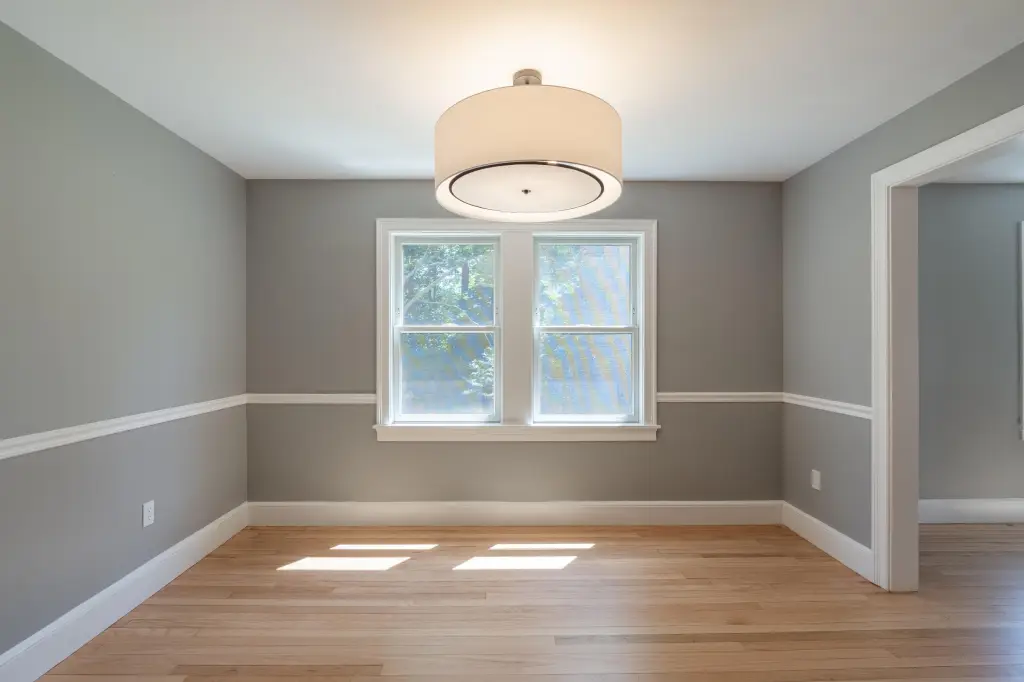
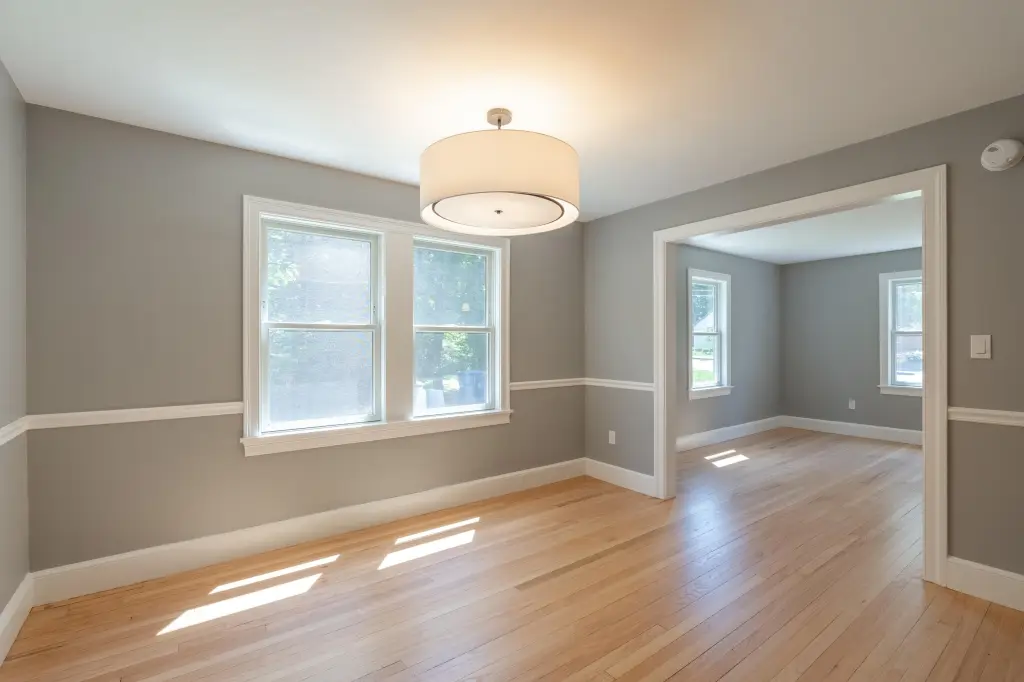
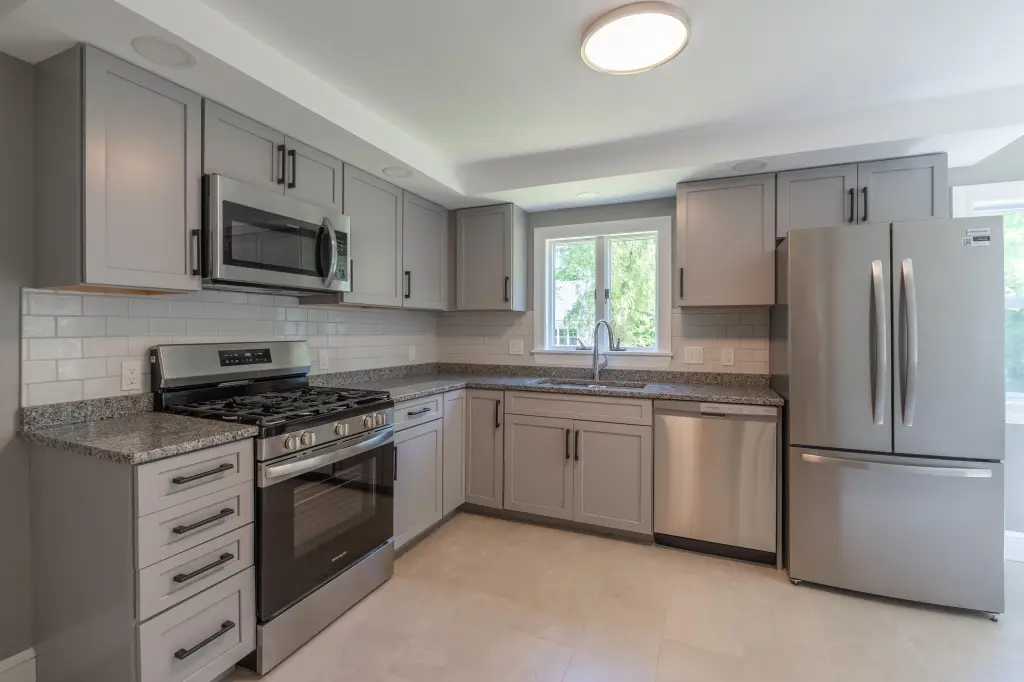
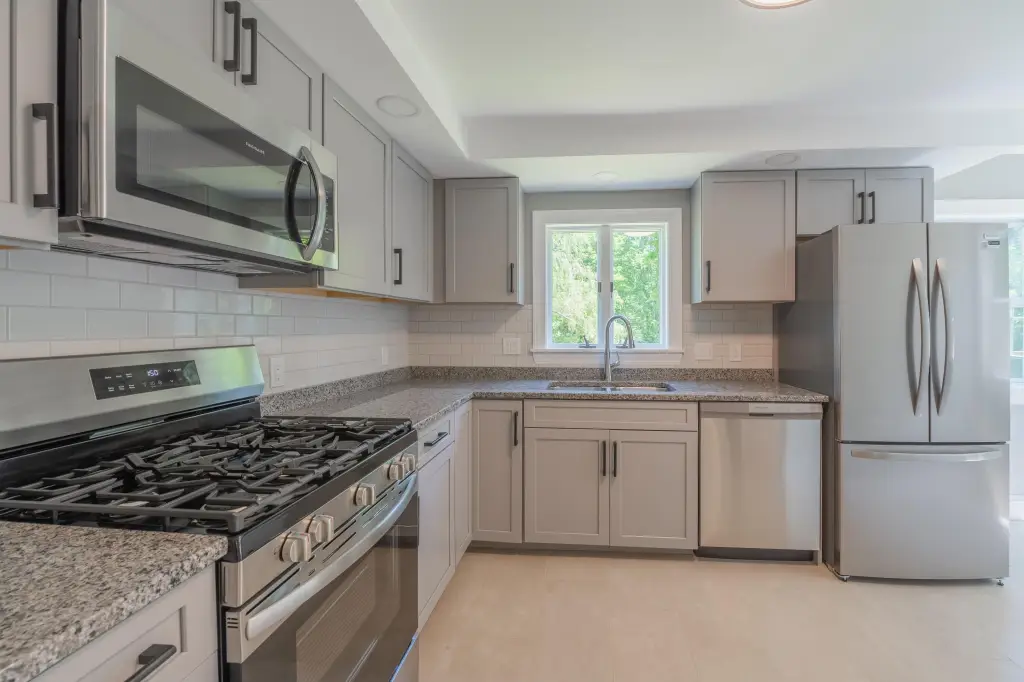
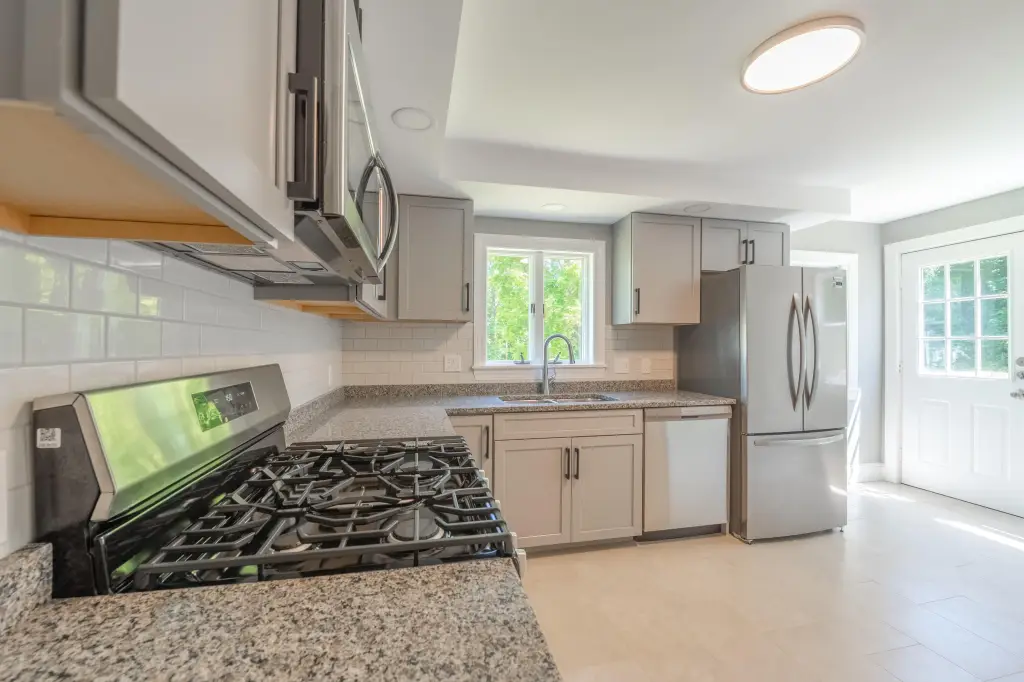
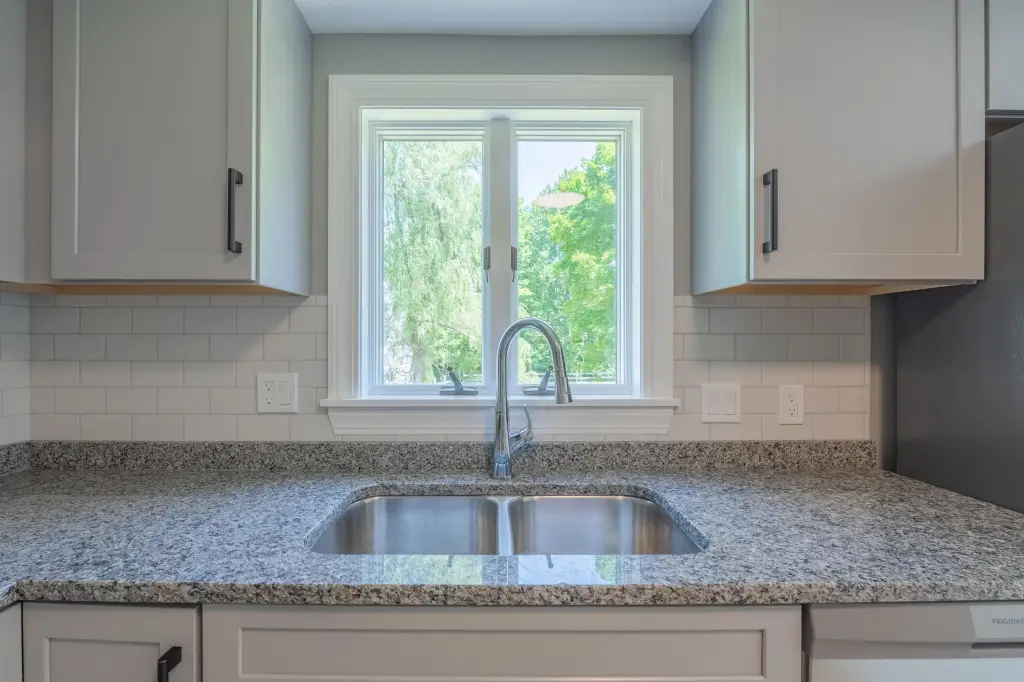
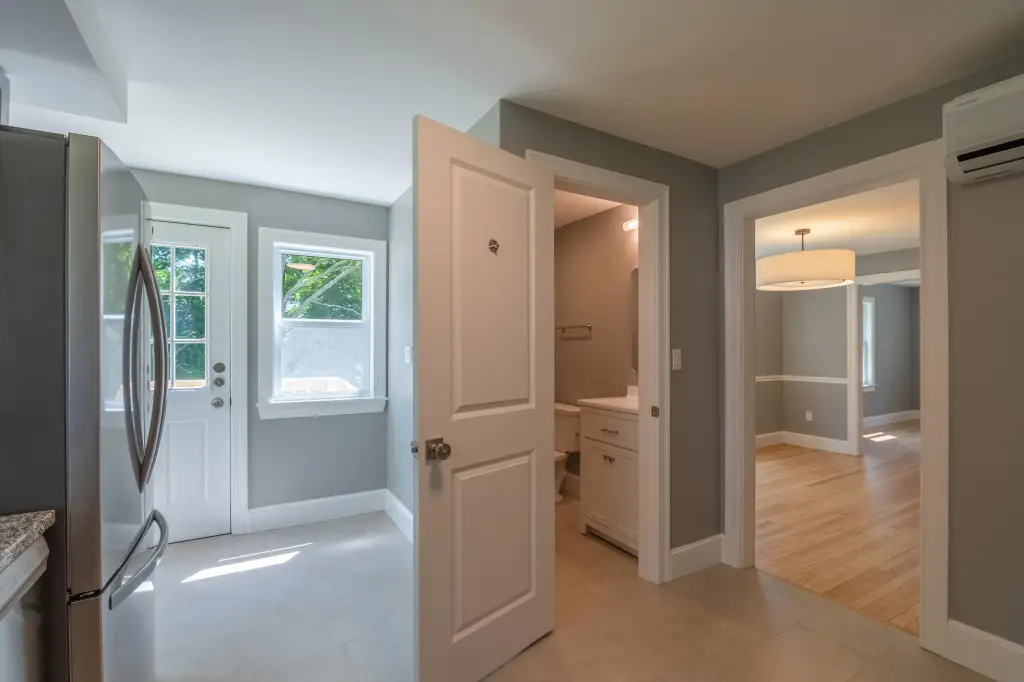
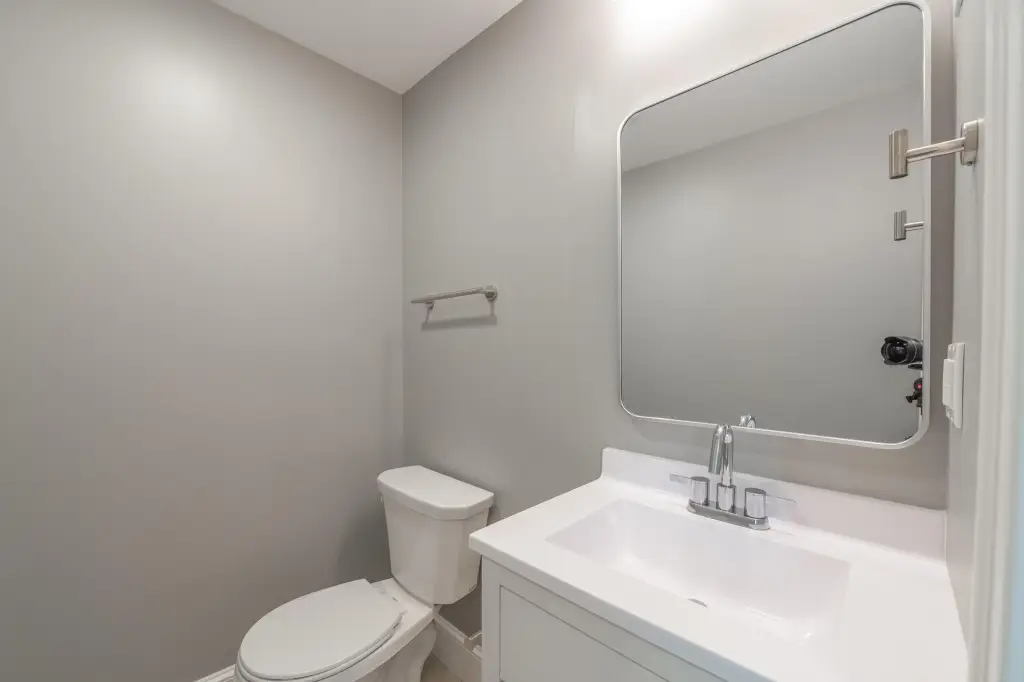
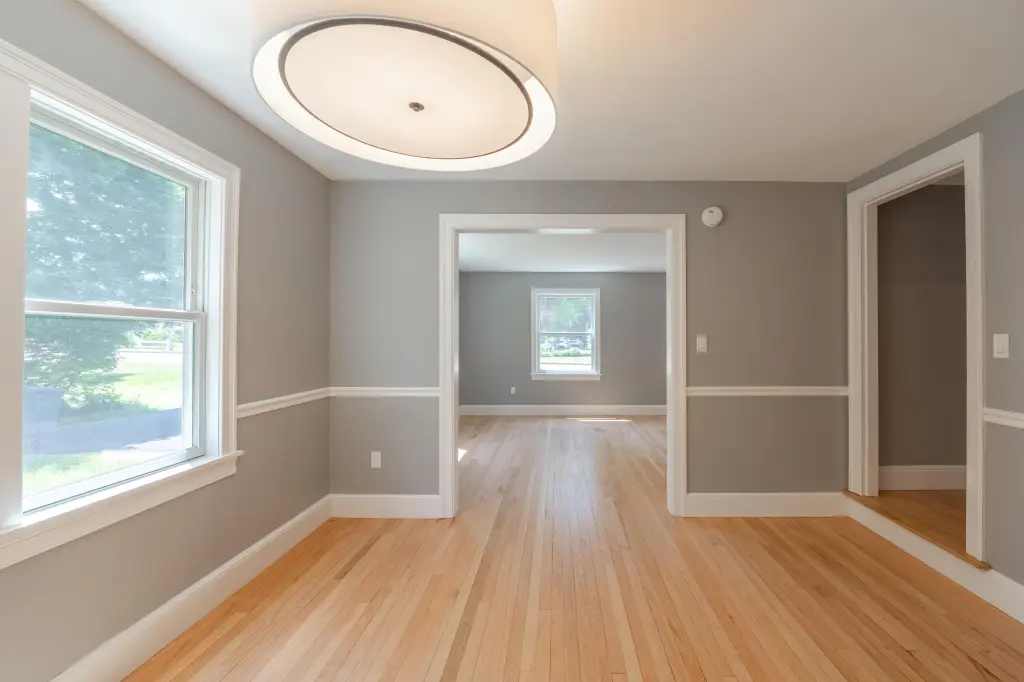
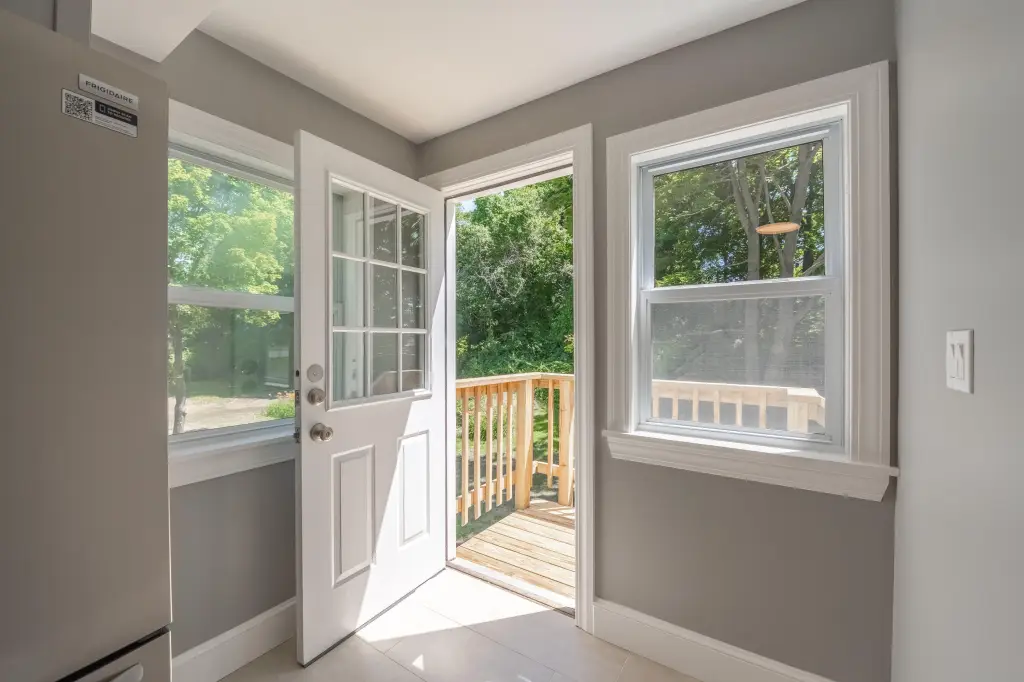
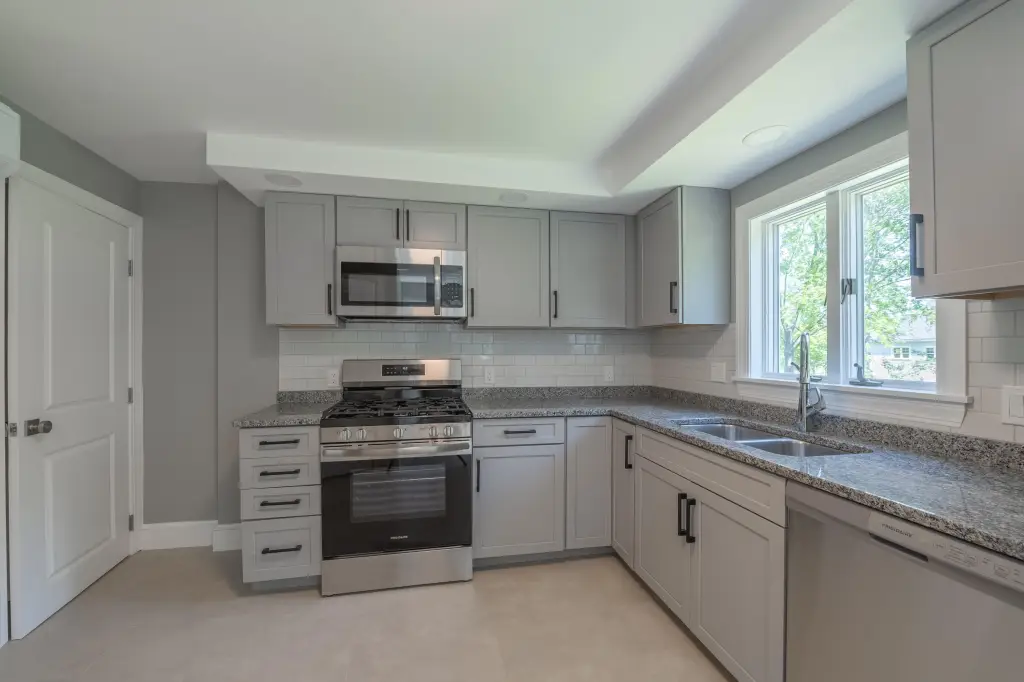
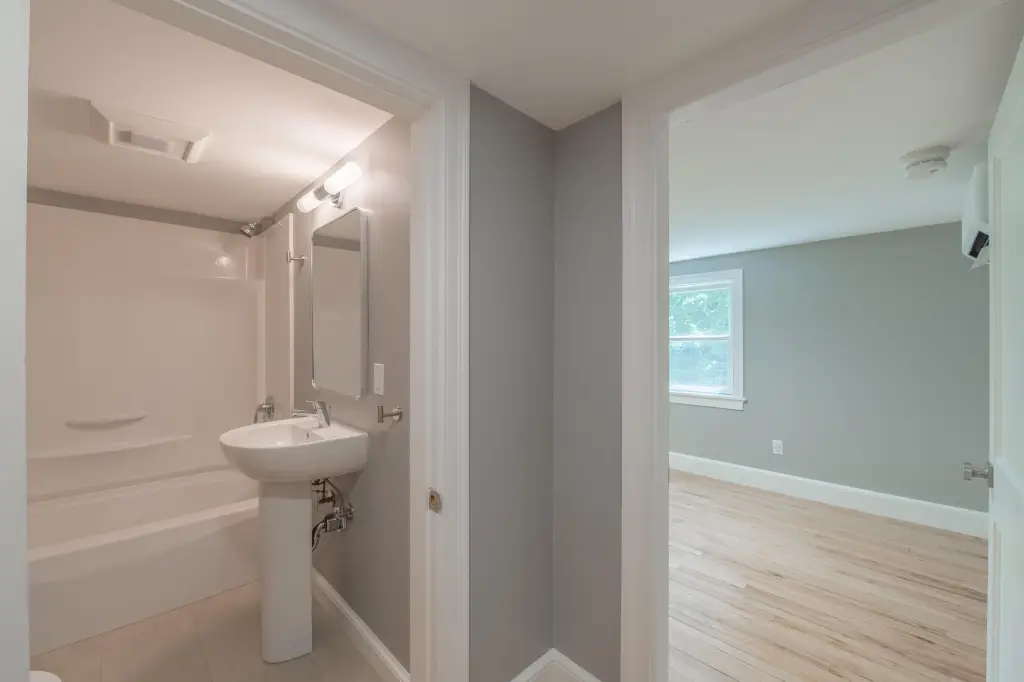
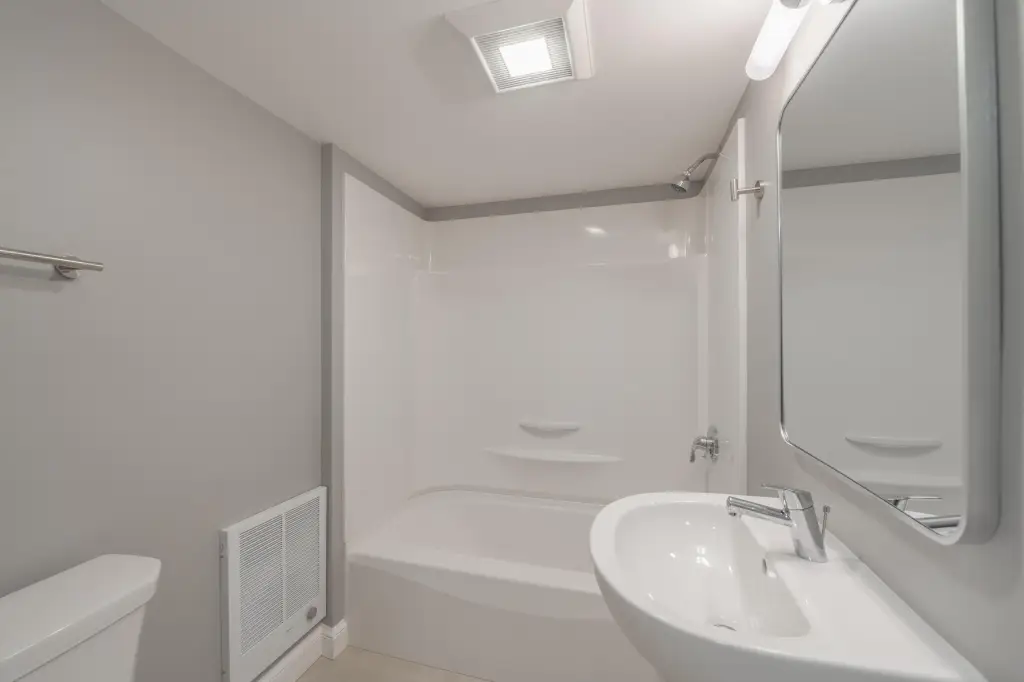
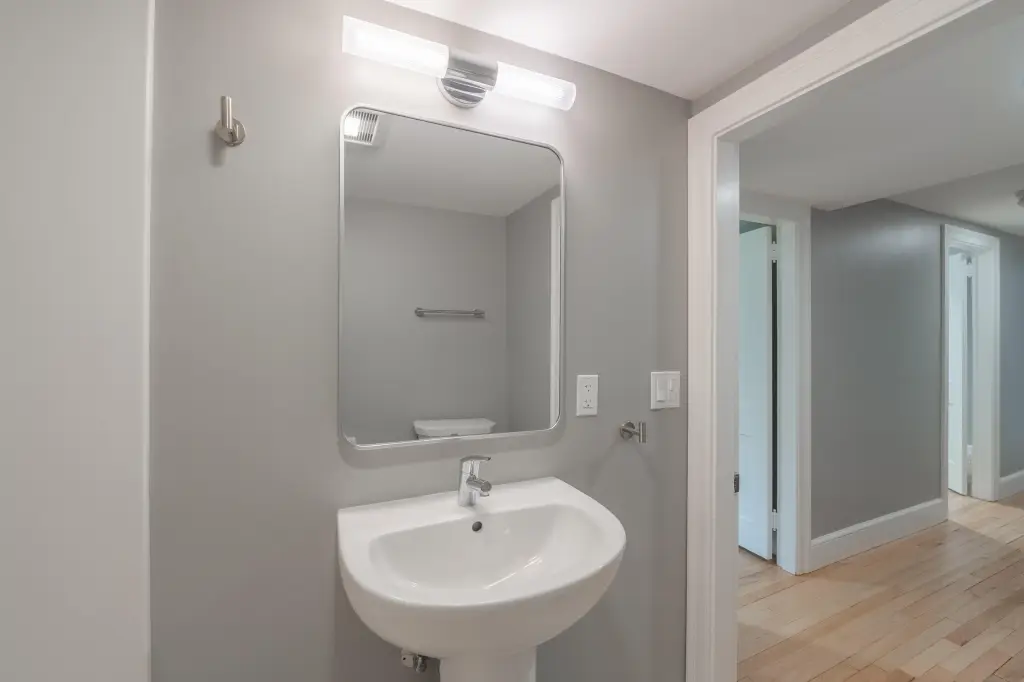
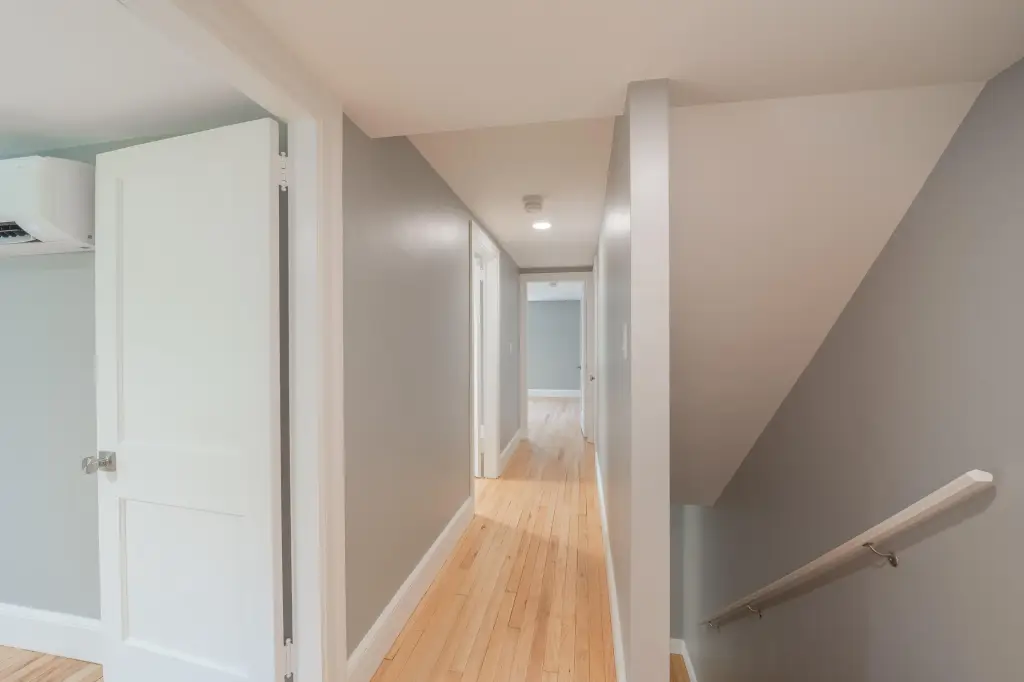
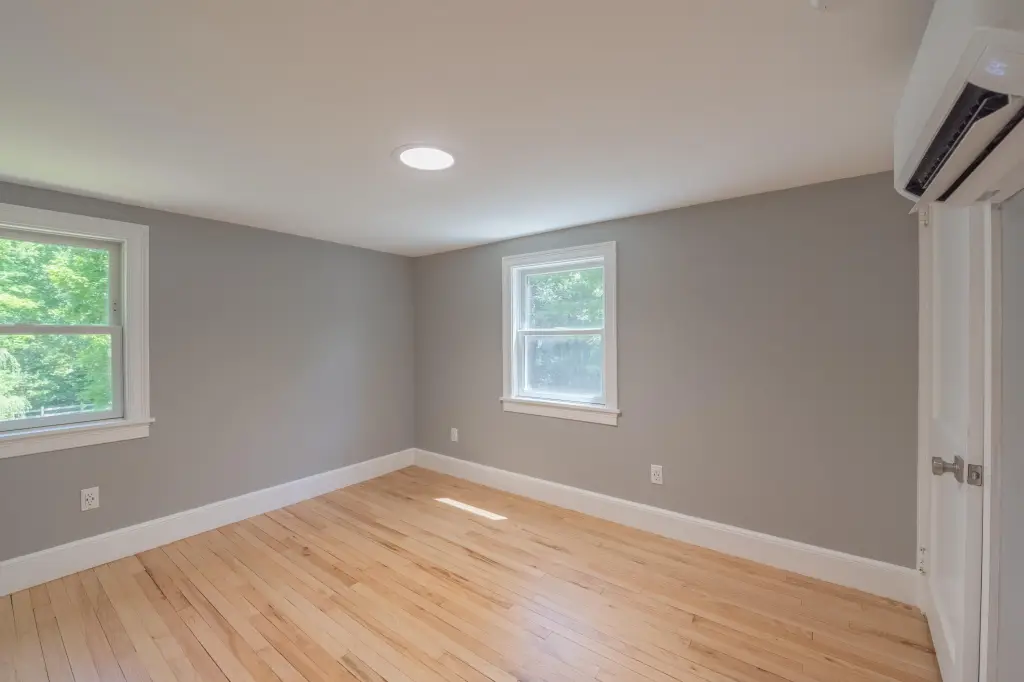
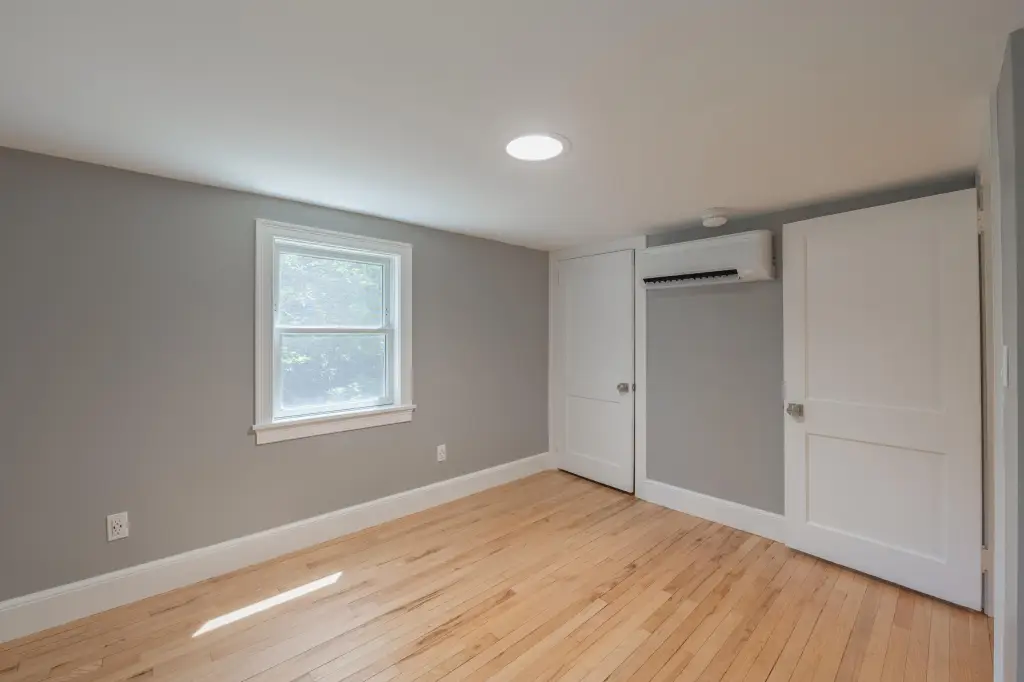
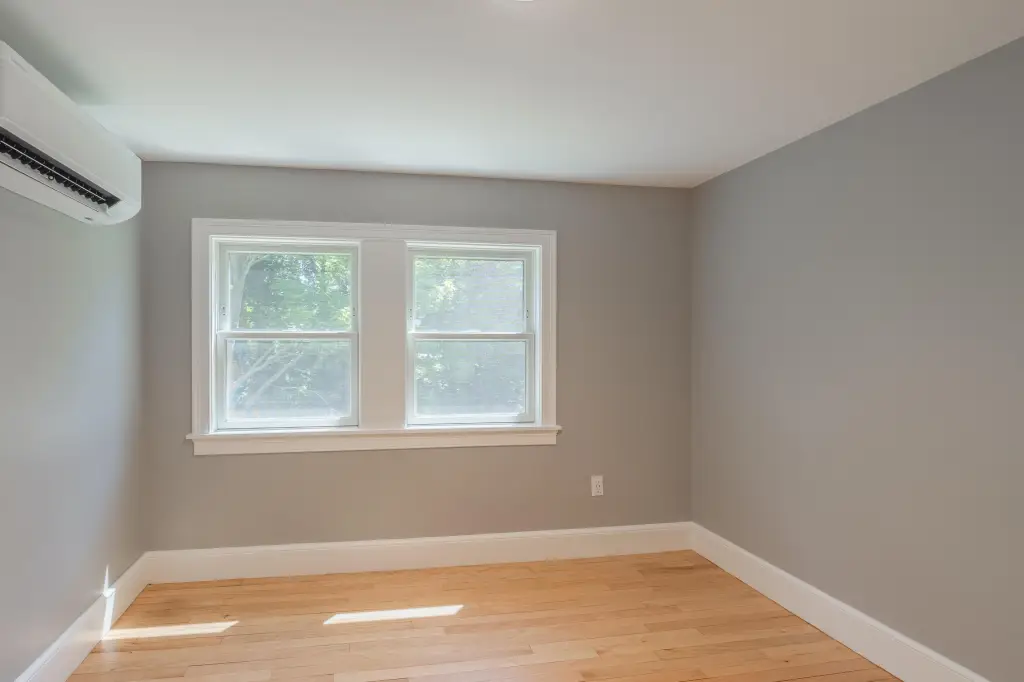
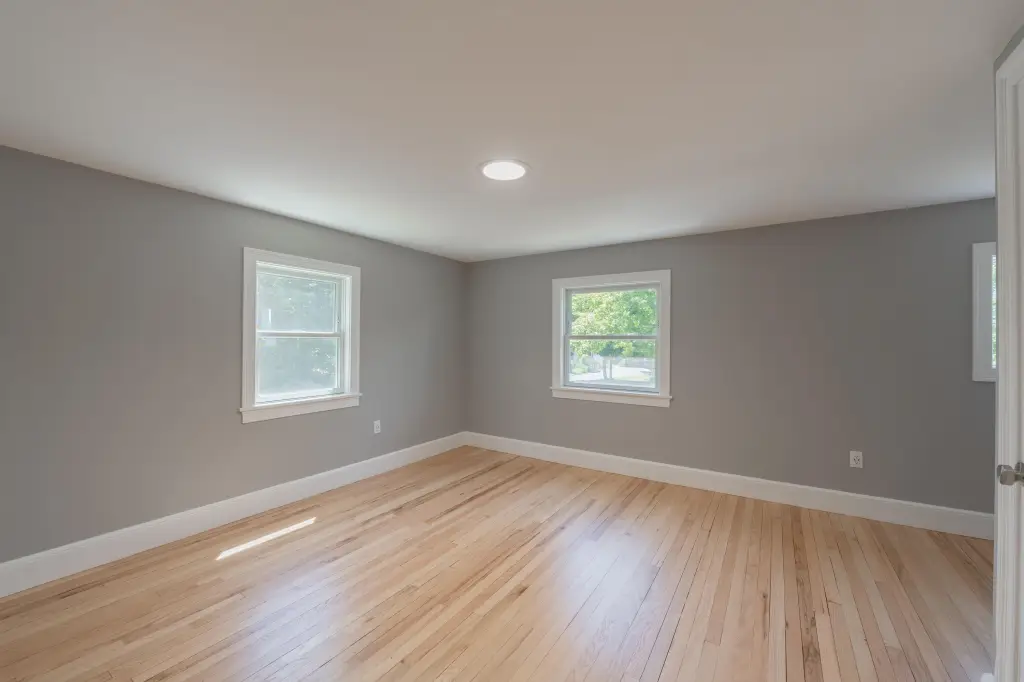
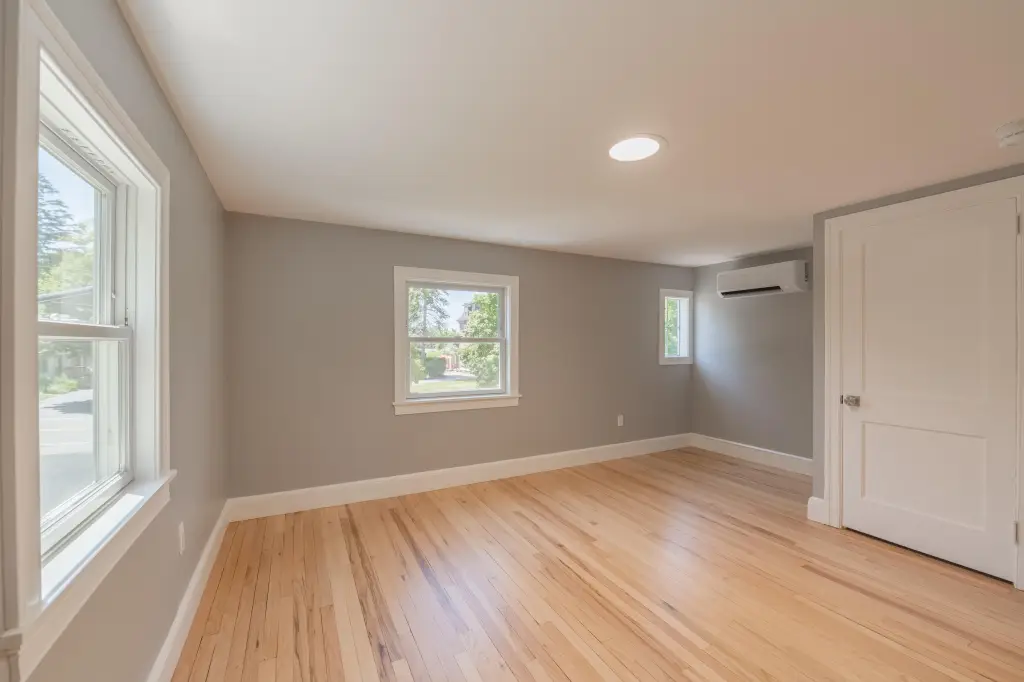
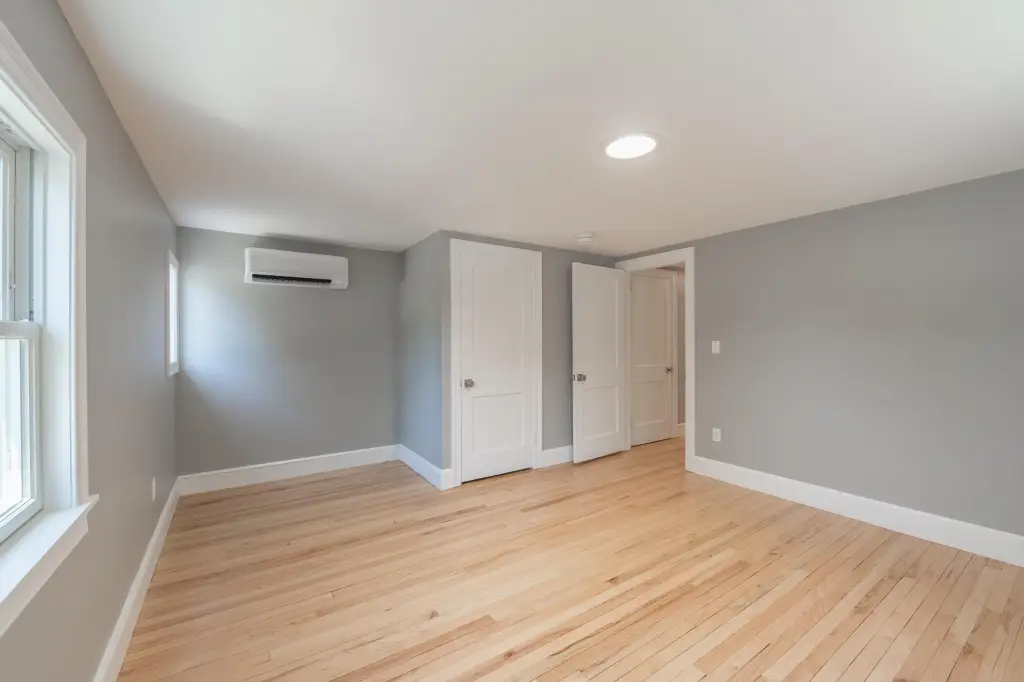
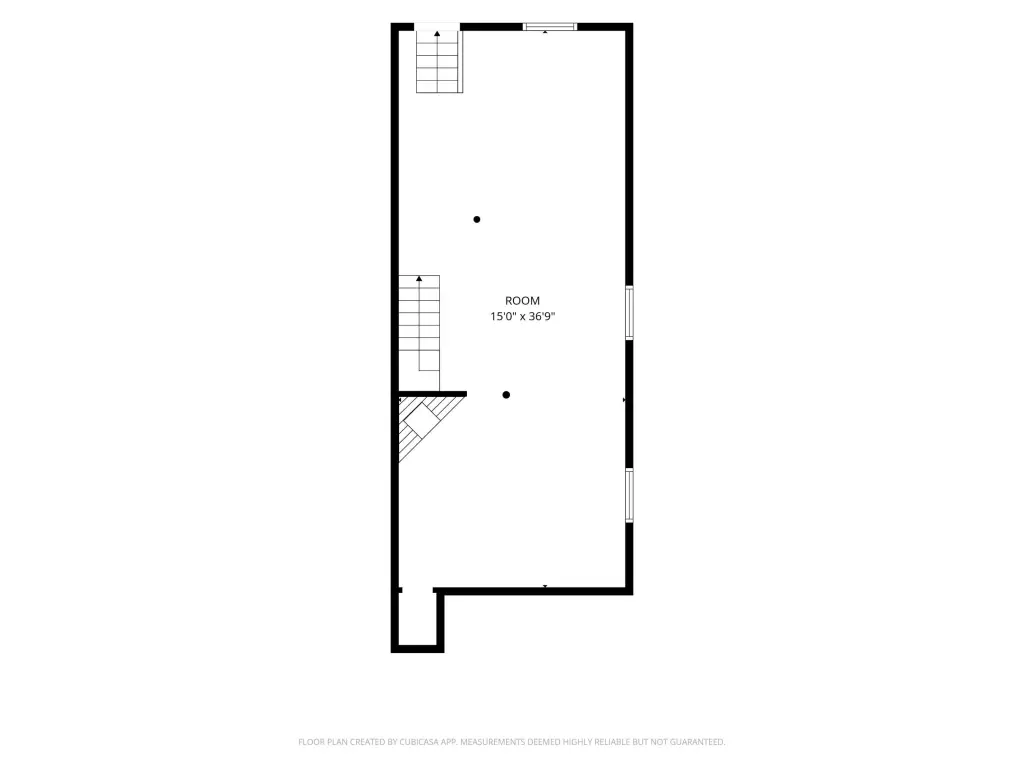
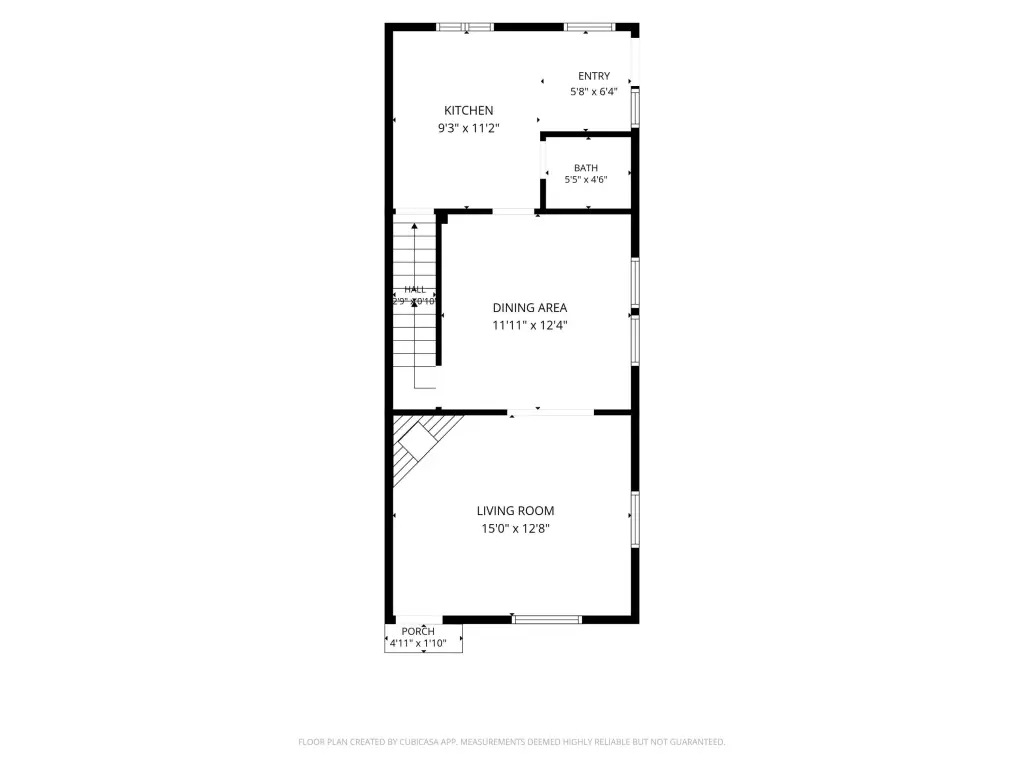
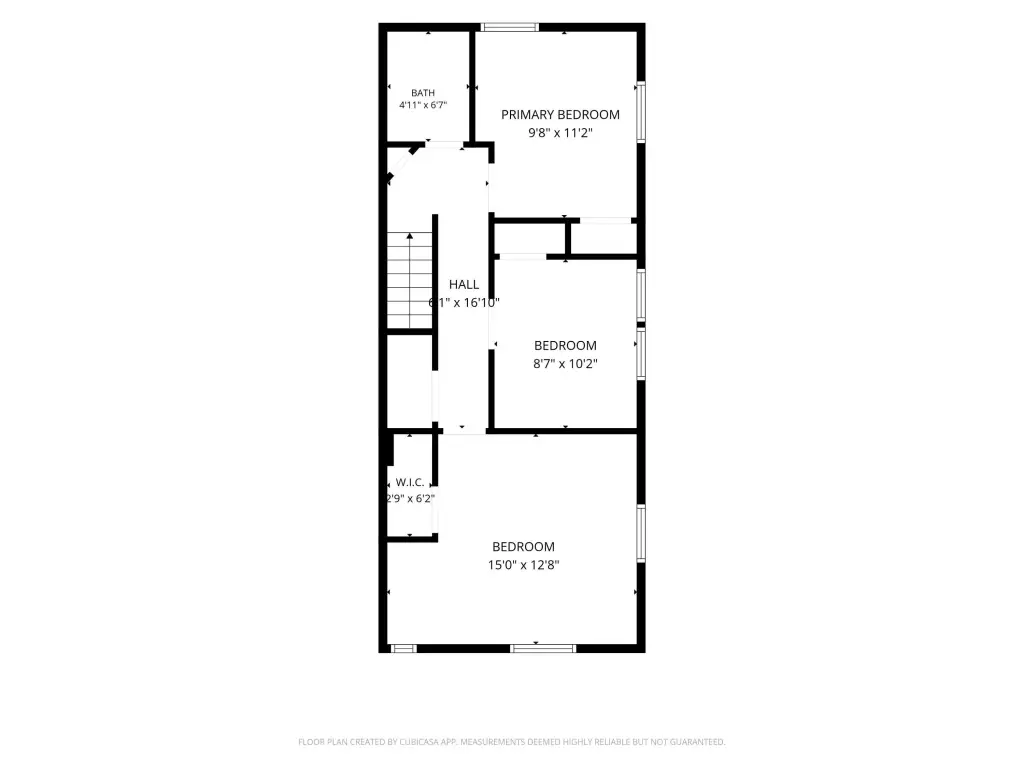
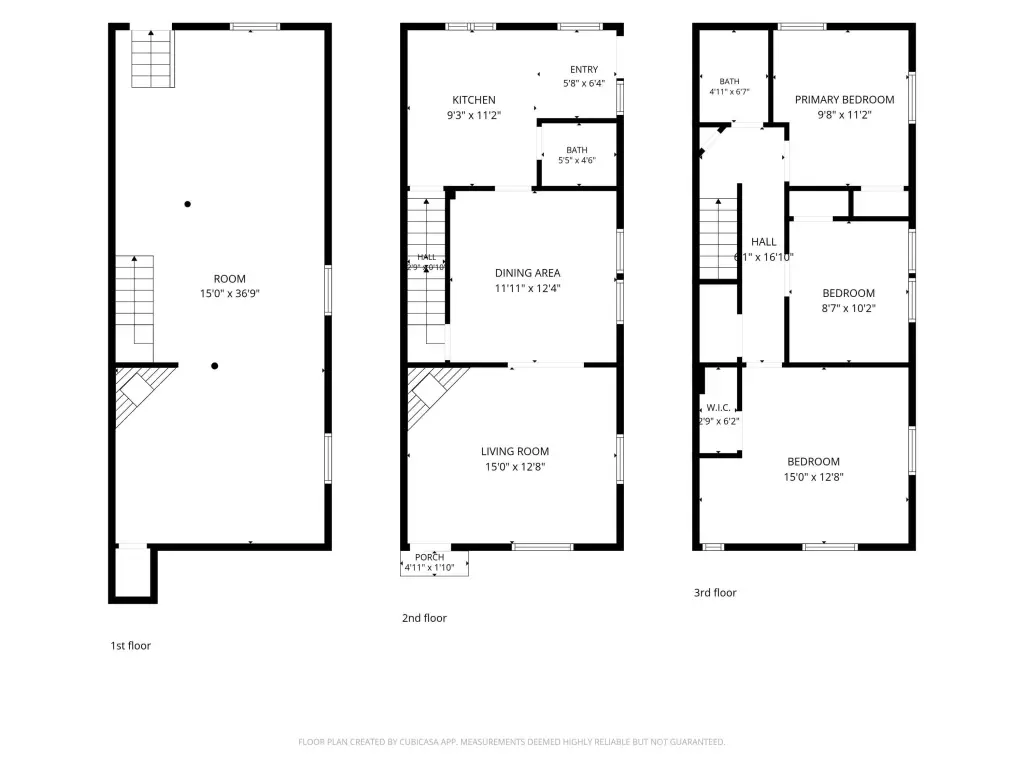
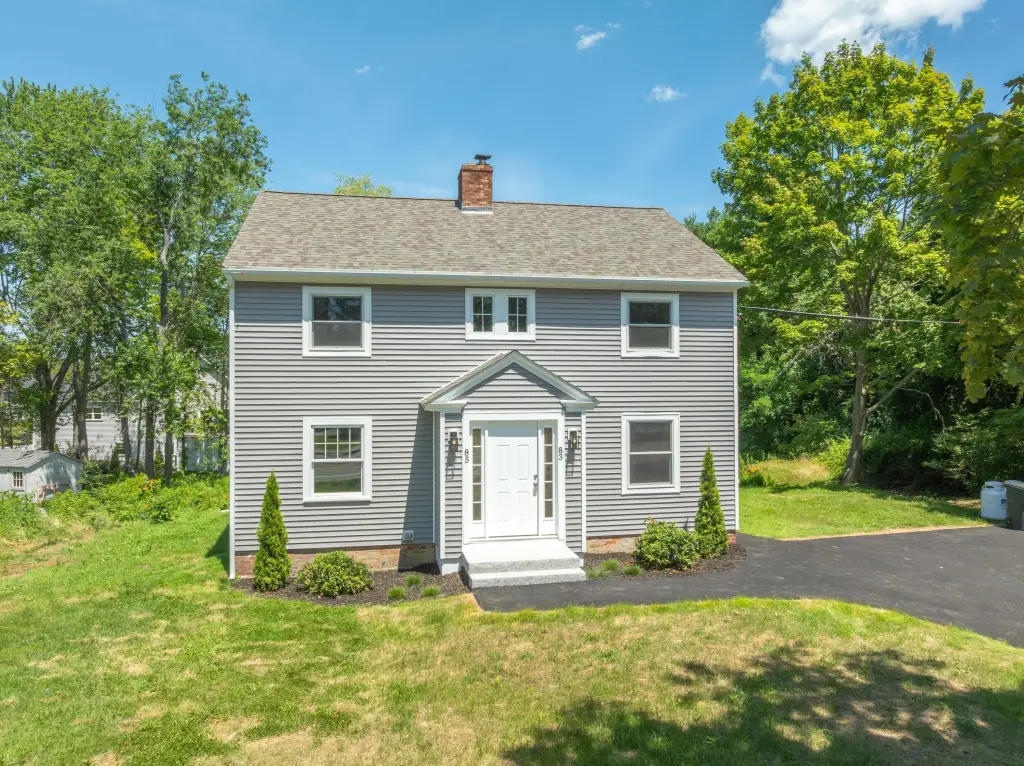
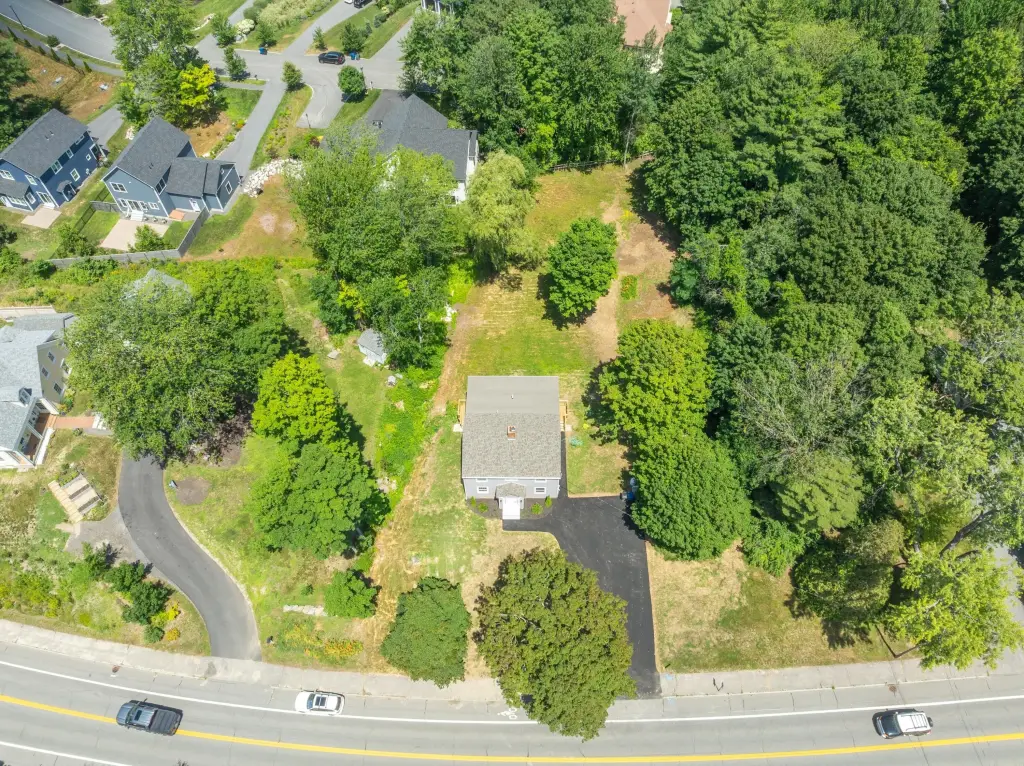
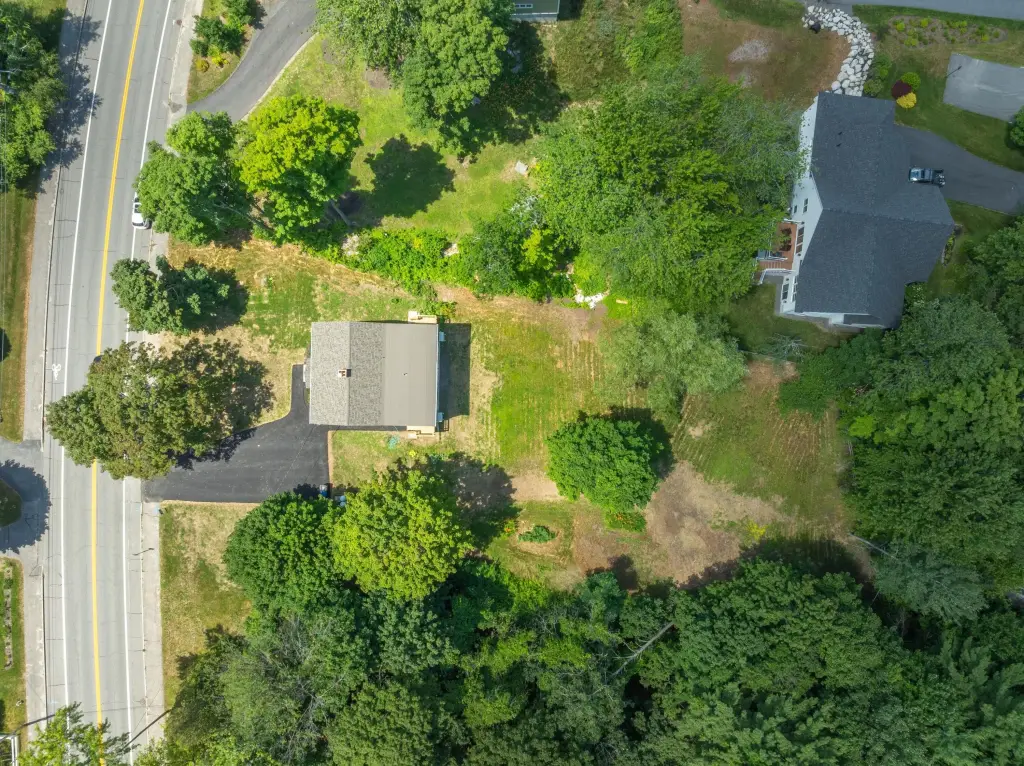
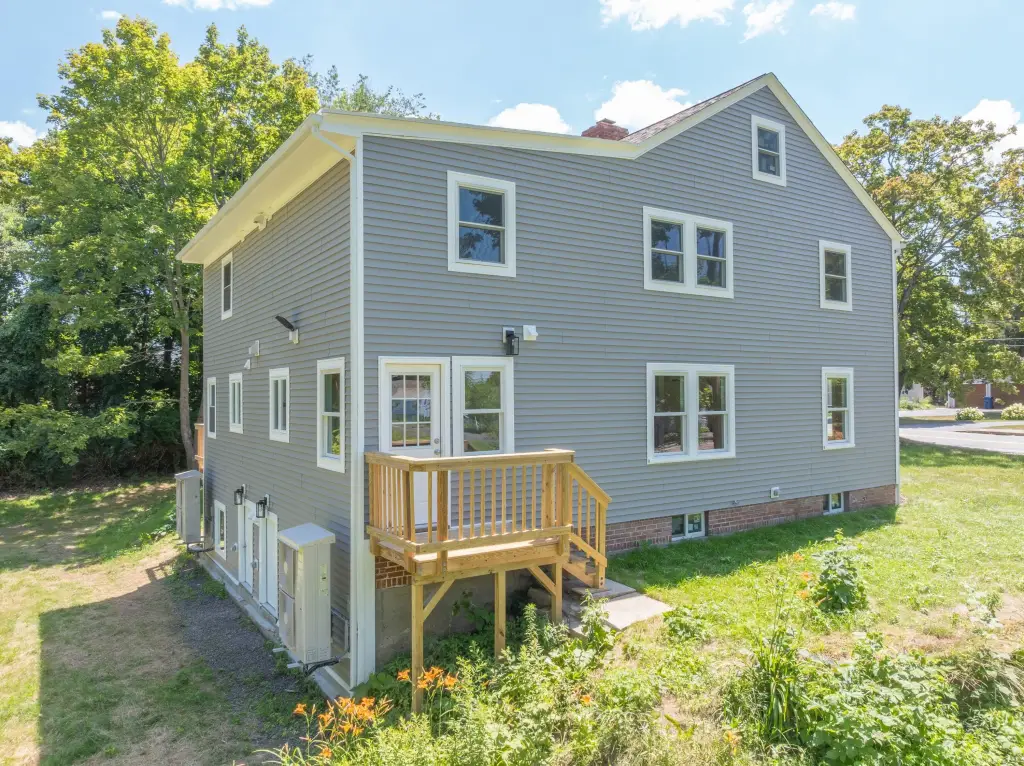
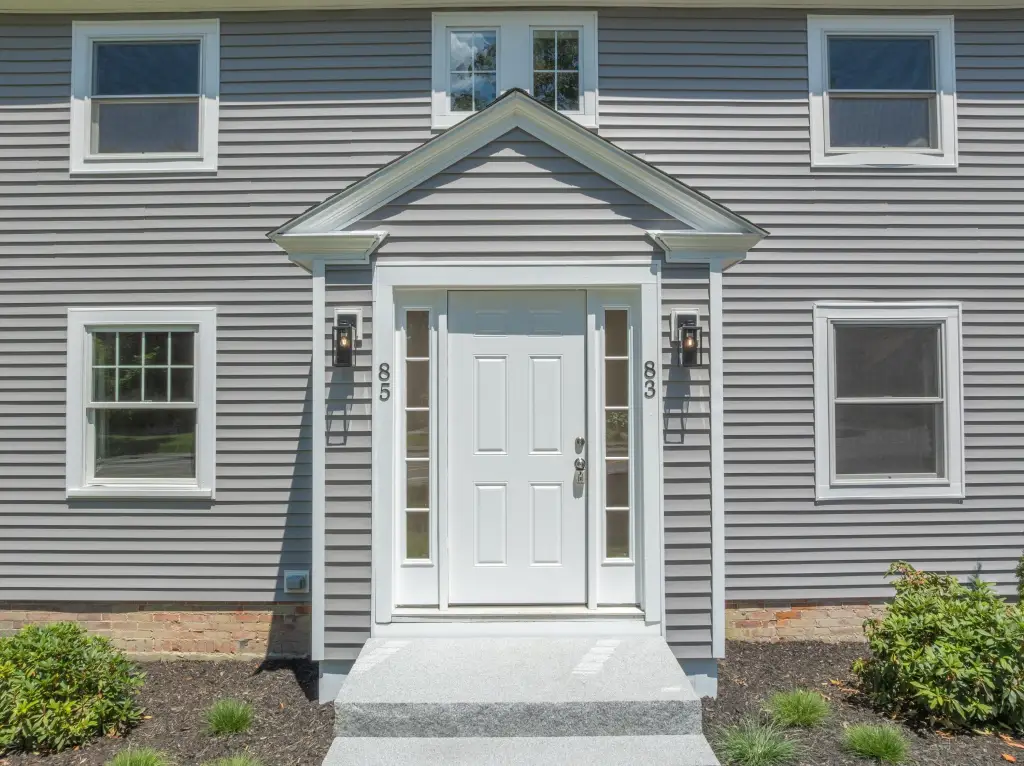
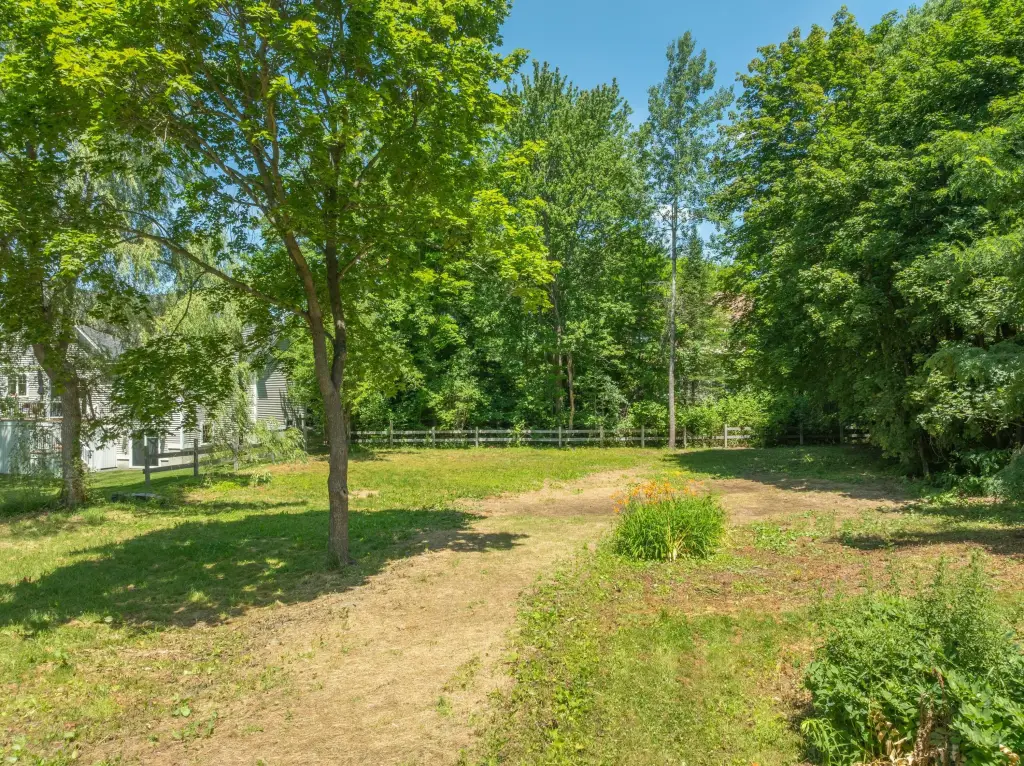
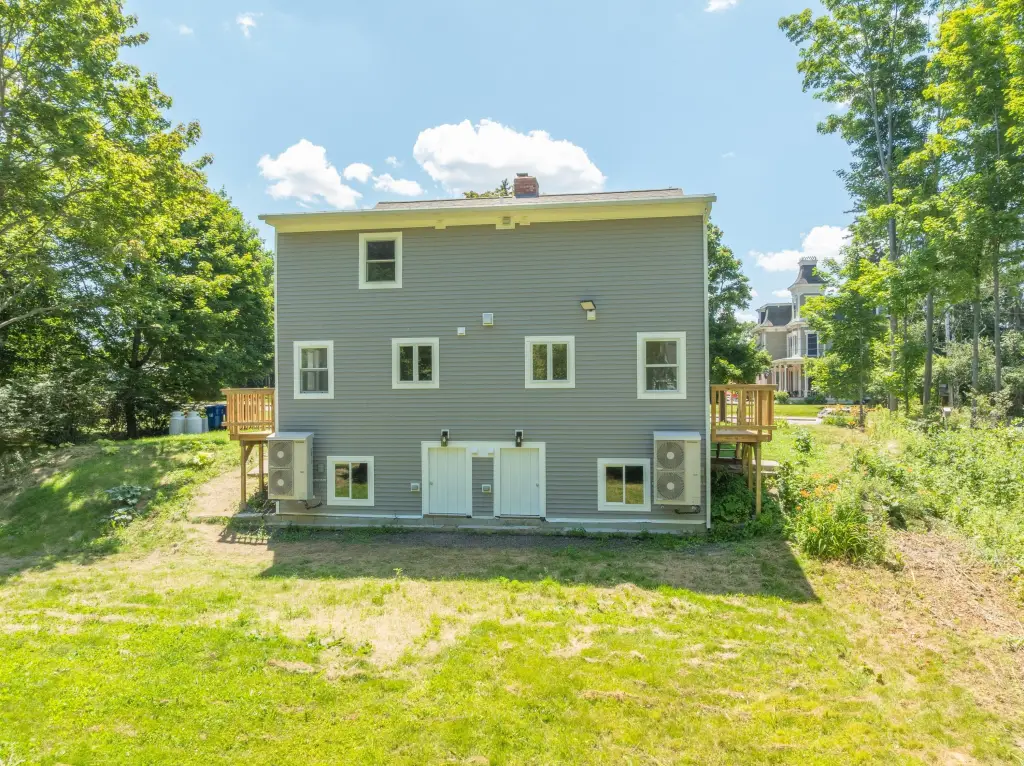
This completely renovated duplex at 83/85 Capisic Street offers two townhome-style units. Each unit features 3 bedrooms and 1.5 bathrooms, with bright, open living spaces and brand-new kitchens including cabinetry, countertops, and fixtures. Bathrooms have been beautifully updated, with new tile flooring and refinished hardwood floors throughout. Major improvements include new heat pumps, along with plumbing, electrical, insulation, windows, siding, trim, and a new roof, supported by a brand-new driveway. The property is set on an oversized 0.48-acre lot, providing a notably large yard for an in-town Portland setting, with possibilities for outdoor living, recreation, and gardening, or future expansion/additional units subject to municipal approvals.
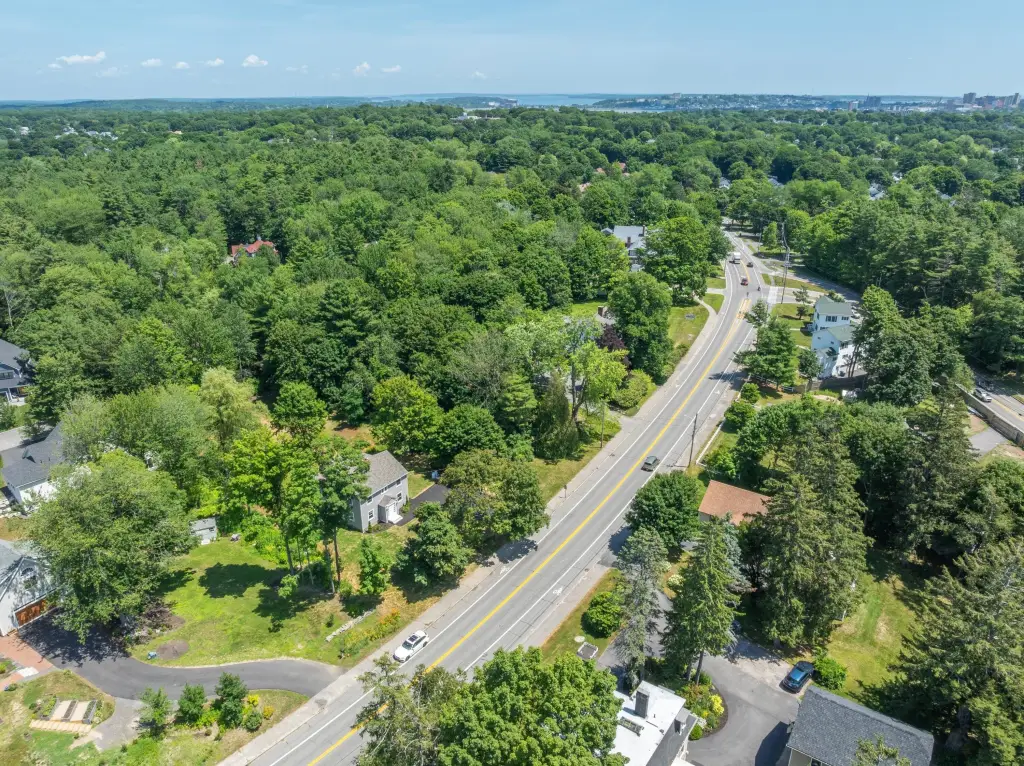
The property is zoned R3 and is located just minutes from downtown Portland, as well as local restaurants, shopping, schools, parks, and major commuter routes.
For investors, the property is noted as not subject to Portland’s rent control ordinance. With all renovations and system upgrades already completed, the duplex is positioned for straightforward, low-maintenance ownership.
The property is zoned R3 and is located just minutes from downtown Portland, as well as local restaurants, shopping, schools, parks, and major commuter routes.
For investors, the property is noted as not subject to Portland’s rent control ordinance. With all renovations and system upgrades already completed, the duplex is positioned for straightforward, low-maintenance ownership.
Key Highlights
- Completely renovated 2‑unit duplex at 83/85 Capisic Street with townhome‑style layouts
- Each unit features 3 bedrooms and 1.5 bathrooms with updated interiors including new kitchens
- Major upgrades: new heat pumps, plumbing, electrical, insulation, windows, siding, trim, and a new roof
Local Financial Insights For Multifamily LT 5
Simulate Cap Rate and NOI
NOI Build-Up
- Vacancy
- income lost from leasable area expected to sit empty during the year — subtracted from gross rent.
- EGI (Effective Gross Income)
- gross rent minus vacancy losses — the realistic income before paying operating costs.
- OpEx (Operating Expenses)
- recurring costs to operate the property (property tax, insurance, utilities, maintenance, management) — excludes financing and capital improvements.
- NOI (Net Operating Income)
- income a property generates after operating costs but before financing and taxes.
| Component | $ | $/SF |
|---|---|---|
| Gross rent | $65.7k | $27.00 |
| − Vacancy | −$4.3k | −$1.76 |
| EGI | $61.4k | $25.25 |
| − OpEx | −$18.4k | −$7.57 |
| NOI | $43.0k | $17.67 |
2,432 SF · lease $27.00/SF/yr · vacancy 6.50% · expense 30.00%
Alternative Uses
Best Use
Multifamily LT 5
$614.0K
$537.2K – $716.3K
NOI $42,977 @ 7.0% cap · market cap 4.52%
Second Best
Apartment 5plus
$571.2K
$499.8K – $666.4K
NOI $39,984 @ 7.0% cap · market cap 4.21%
Theoretical Best
Office A
$668.4K
$584.9K – $779.9K
NOI $46,791 @ 7.0% cap · market cap 4.93%
Zoning and permitted uses should be independently verified with local authorities.
Property Analytics
Property Profile
Location Intelligence
Current Use by Public Records
Duplexes
Similar For Sale Nearby
FAQs
What type of property is this?
Duplex - Turnkey duplex in Portland with two townhome-style units, renovated interiors, and brand-new systems on a large lot.
Where is this duplex located?
The property is located at 83 Capisic Street Portland, ME.
What is the asking price?
The asking price for this property is $950,000.
What are key features of this property?
This property features: Completely renovated 2‑unit duplex at 83/85 Capisic Street with townhome‑style layouts; Each unit features 3 bedrooms and 1.5 bathrooms with updated interiors including new kitchens; Major upgrades: new heat pumps, plumbing, electrical, insulation, windows, siding, trim, and a new roof


