Uptown Chicago Redevelopment
For Sale
$2,250,000
Pending
822 West Wilson Avenue, Chicago, IL 60640
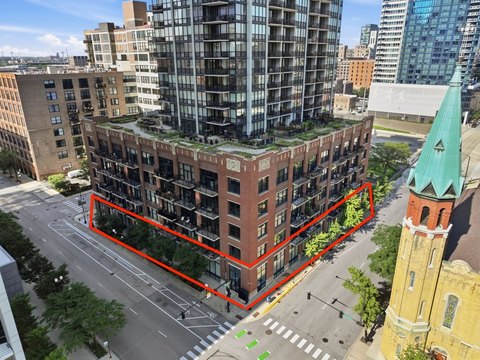
Two-story warehouse building in Chicago's Uptown neighborhood.
Property Size10,766 SF
Lot Size0.25 Acres
Days on Market195
Property Features for 822 West Wilson Avenue
General Information
Standard status
Pending
Size
10,766 SF
Lot size
0.25 Acres
Property subtype
Land
Listing Agency:
CBRE | Chicago
Listed By:
Tom Svoboda
(312) 935-1481
Source:
Cbre
Added: Mar 25
Changed: Sep 25
Last Checked: Oct 4 at 6:36AM
Displayed information is deemed reliable but is not guaranteed and should be independently verified. All listing content including descriptions, pricing, images are the copyrighted material of CBRE | Chicago
Investment Insights
Based on property information with market context.
Located in Chicago's Uptown neighborhood, this property presents a flexible use opportunity, allowing for industrial, flex, adaptive reuse, or total redevelopment. The improved site spans approximately 10,766 square feet and features a two-story warehouse building with an area of approximately 12,625 square feet. The property benefits from rear alley access, which is advantageous for servicing and potential future multifamily development. It is situated approximately 0.5 miles, a 9-minute walk, from the Wilson CTA Station, providing access to the Red and Purple Lines. This transit-oriented infill development opportunity offers a 20–25 minute train ride to Downtown Chicago. The location also provides convenient access to amenities, including Wrigley Field, Jewel-Osco, Aldi, Mariano’s, and the Sydney Marovitz Golf Course.
Key Highlights
- Transit‑oriented development: Located just 0.5 miles from Wilson CTA Station (Red and Purple Lines) for an easy commute to Downtown Chicago.
- Flexible use/redevelopment potential: Suitable for industrial, flex use, adaptive reuse, or total redevelopment.
- Rear alley access: Beneficial for servicing and future multifamily development.
Financial Insights
Estimated NOI and Cap Rate
NOI / Yr
$181,676
Cap Rate
8.07%
Suggested Prices Based on Cap Rates
Cap Rate 5%
$3,633,520
$3.6M
Cap Rate 7%
$2,595,371
$2.6M
Cap Rate 9%
$2,018,622
$2.0M
Market Conditions
NOI Build-Up for 10,766 SF
Gross rent
$323.0K $30.00/SF
− Vacancy
−$32.3K −$3.00/SF
EGI
$290.7K $27.00/SF
− OpEx
−$109.0K −$10.13/SF
NOI
$181.7K $16.88/SF
Area
Chicago, IL
Vacancy
10.00%
Lease Rate
$30.00 /SF/Yr
Expense Ratio
37.50%
Simulate Cap Rate and NOI
Suggested Prices Based on Cap Rates
Cap Rate 5%
$3,633,520
Cap Rate 7%
$2,595,371
Cap Rate 9%
$2,018,622
Alternative Uses
Best Use
Mixed Use
$2.60M
$2.27M – $3.03M
NOI $181,676 @ 7.0% cap · market cap 8.07%
Second Best
Warehouse
$1.16M
$1.02M – $1.36M
NOI $81,549 @ 7.0% cap · market cap 3.62%
Theoretical Best
Office A
$5.08M
$4.44M – $5.92M
NOI $355,330 @ 7.0% cap · market cap 15.79%
Zoning and permitted uses should be independently verified with authorities.
Property Analytics
Unlock full access to Insights
Subscribe to Realmo Intelligence
Open Analytics
Current Use
Location Intelligence
Trade Area within ½ mile
2,978
Businesses Nearby
Explore this area
Business Placement
Demographics for 60640, IL
65,941
Population
40,850
Households
1.6
Avg Household Size
38
Median Age
63%
College-Educated
92%
High-School Grad
2.4 sq mi
ZIP Area
27,475
Density / Sq Mi
$71,030
Median Household Income
$59,264
Median Earnings
$1,374
Median Rent
$363,300
Median Home Value
Check the figures for this property
Cap Rate, Value Estimation, Potential NOI and more
View Realmo Analytics
Market
Vacancy Rate% for Industrial in Chicago, IL

Questions? Ask Rey
Realmo’s AI knows this listing — price, zoning, demand, history. Ask anything.




Frequently Asked Questions
What type of property is this?
Commercial land - Two-story warehouse building in Chicago's Uptown neighborhood.
Where is this commercial land located?
The property is located at 822 West Wilson Avenue Chicago, IL.
What is the asking price?
The asking price for this property is $2,250,000.
What are key features of this property?
This property features: Transit‑oriented development: Located just 0.5 miles from Wilson CTA Station (Red and Purple Lines) for an easy commute to Downtown Chicago.; Flexible use/redevelopment potential: Suitable for industrial, flex use, adaptive reuse, or total redevelopment.; Rear alley access: Beneficial for servicing and future multifamily development.