Mixed-Use Retail and Apartment
For Sale
$3,500,000
8212 N Denver Ave, Portland, OR 97217
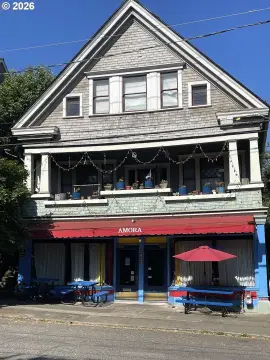
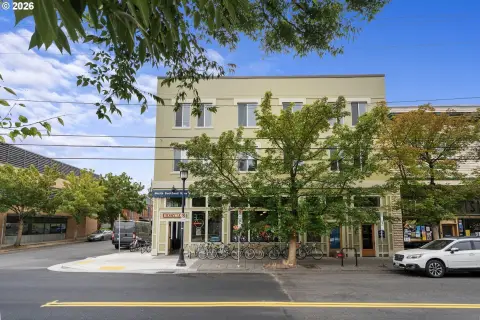
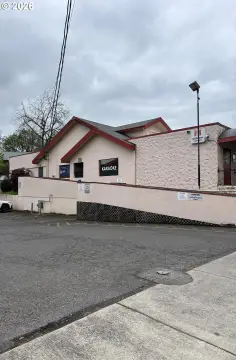
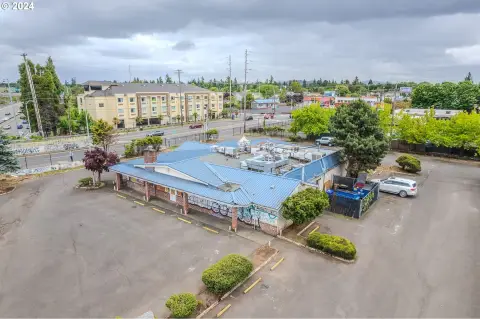
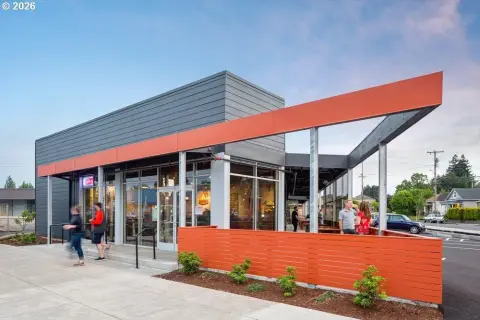
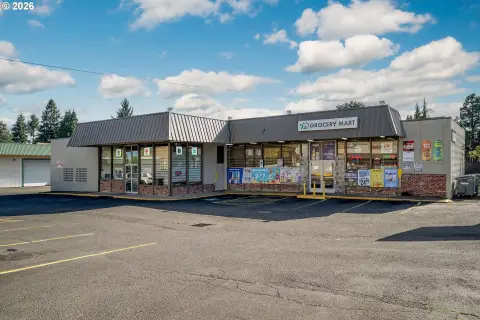
Remodeled mixed-use building with three fully leased storefront spaces and 11 upstairs residential units.
Property SizeContact for details
Days on Market225
Property Features for 8212 N Denver Ave
General Information
Standard status
Active
Property subtype
Residential Income
Units
Multifamily Units
11
Office Units
3
Additional Details
Business Included
Yes
Taxes and HOA fees
Annual Taxes
$16,971
Building Details
Year Renovated
2018
Stories
2
Tenancy
Multi
Listing Agency:
eXp Realty, LLC
(888) 814-9613
Listed By:
Evan Nelson · License #201206804
(310) 422-6044
Source:
Exprealty
Added: Feb 18
Changed: Sep 29
Last Checked: Sep 30 at 12:46PM
Displayed information is deemed reliable but is not guaranteed and should be independently verified. All listing content including descriptions, pricing, images are the copyrighted material of eXp Realty, LLC
Investment Insights
Based on property information with market context.
8212 N Denver Ave is a remodeled mixed-use property featuring three fully leased commercial spaces on the main level and 11 residential units on the second floor. The storefront units are described as mostly street-facing and individually metered. The residential mix includes two one-bedroom units with full bathrooms and kitchenettes, plus nine micro units, including one double-sized micro unit with an in-unit kitchenette, seven standard micro units with kitchenettes, and one streamlined unit without a kitchenette.
Common resident amenities include a large shared kitchen and dining area, an enclosed grilling space with built-in BBQ, seating, and a gas fire pit, and a rear deck with additional seating and elevated views. Interior conveniences include a washer/dryer closet, two powder rooms, and two dedicated shower rooms. The mostly open basement provides three secured storage units and space for potential additional build-out or flexible repurposing.
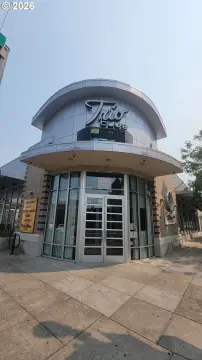
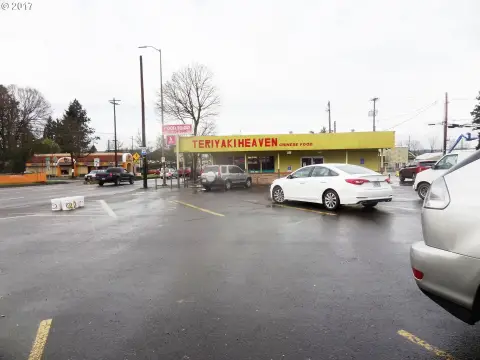
The building is positioned for owner-users and investors seeking a property that combines street-level retail/service space with upstairs housing. With commercial units presently occupied by a restaurant, a salon, and a record shop, and residential units arranged in a blend of standard and micro living formats, the layout supports both day-to-day income-producing operations and modern, amenity-forward living.
Common resident amenities include a large shared kitchen and dining area, an enclosed grilling space with built-in BBQ, seating, and a gas fire pit, and a rear deck with additional seating and elevated views. Interior conveniences include a washer/dryer closet, two powder rooms, and two dedicated shower rooms. The mostly open basement provides three secured storage units and space for potential additional build-out or flexible repurposing.
The building is positioned for owner-users and investors seeking a property that combines street-level retail/service space with upstairs housing. With commercial units presently occupied by a restaurant, a salon, and a record shop, and residential units arranged in a blend of standard and micro living formats, the layout supports both day-to-day income-producing operations and modern, amenity-forward living.
Key Highlights
- Year built 1911 remodeled mixed‑use building with 3 fully leased ground‑floor retail/storefront spaces
- Three street‑facing commercial spaces on N Denver Ave, each individually metered
- Upstairs second floor includes 11 residential units: (2) 1‑bedroom units and (9) micro units
Property Analytics
Unlock full access to Insights
Subscribe to Realmo Intelligence
Open Analytics
Current Use
Lease Details
3
Office units
11
Residential units
Multi-tenant
Tenancy
Turnkey business
Opportunity
Location Intelligence
Trade Area within ½ mile
845
Businesses Nearby
Explore this area
Business Placement
Demographics for 97217, OR
36,086
Population
17,038
Households
2.1
Avg Household Size
38
Median Age
59%
College-Educated
96%
High-School Grad
11.1 sq mi
ZIP Area
3,251
Density / Sq Mi
$100,387
Median Household Income
$56,790
Median Earnings
$1,789
Median Rent
$569,500
Median Home Value
Check the figures for this property
Cap Rate, Value Estimation, Potential NOI and more
View Realmo Analytics
Market
Vacancy Rate% for Multifamily in West region

Questions? Ask Rey
Realmo’s AI knows this listing — price, zoning, demand, history. Ask anything.




Frequently Asked Questions
What type of property is this?
Mixed-use property - Remodeled mixed-use building with three fully leased storefront spaces and 11 upstairs residential units.
Where is this mixed-use property located?
The property is located at 8212 N Denver Ave Portland, OR.
What is the asking price?
The asking price for this property is $3,500,000.
What are key features of this property?
This property features: Year built 1911 remodeled mixed‑use building with 3 fully leased ground‑floor retail/storefront spaces; Three street‑facing commercial spaces on N Denver Ave, each individually metered; Upstairs second floor includes 11 residential units: (2) 1‑bedroom units and (9) micro units



