Waterfront Duplex with Private
For Sale
$1,800,000
821 Palm St, Marco Island, FL 34145
Residential, 2 Story, Duplex, MARCO ISLAND, FL
Property Size3,754 SF
Lot Size0.35 Acres
Price / SF$479.49
Days on Market302
Property Features for 821 Palm St
General Information
Property type
Residential
Property subtype
Duplex
Bedrooms
5
Bathrooms
4
Full bathrooms
4
Rooms
Bedroom 3, Den, Bedroom 5, Bedroom 4, Bathroom 3, Bedroom 2, Bathroom 2, Bathroom 4, Bedroom 1, Laundry Room, Bathroom 1
Parking
2
Parking features
Driveway
Patio and Porch features
Deck
Pets allowed
Yes
Pool private
1
Interior features
Built-In Cabinets
Exterior features
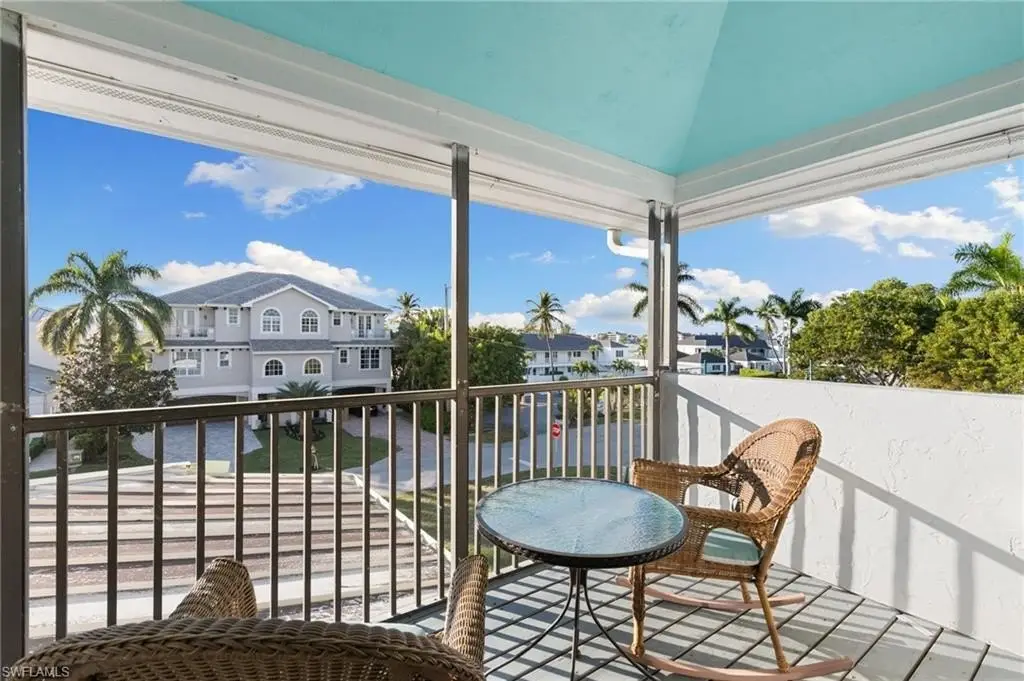
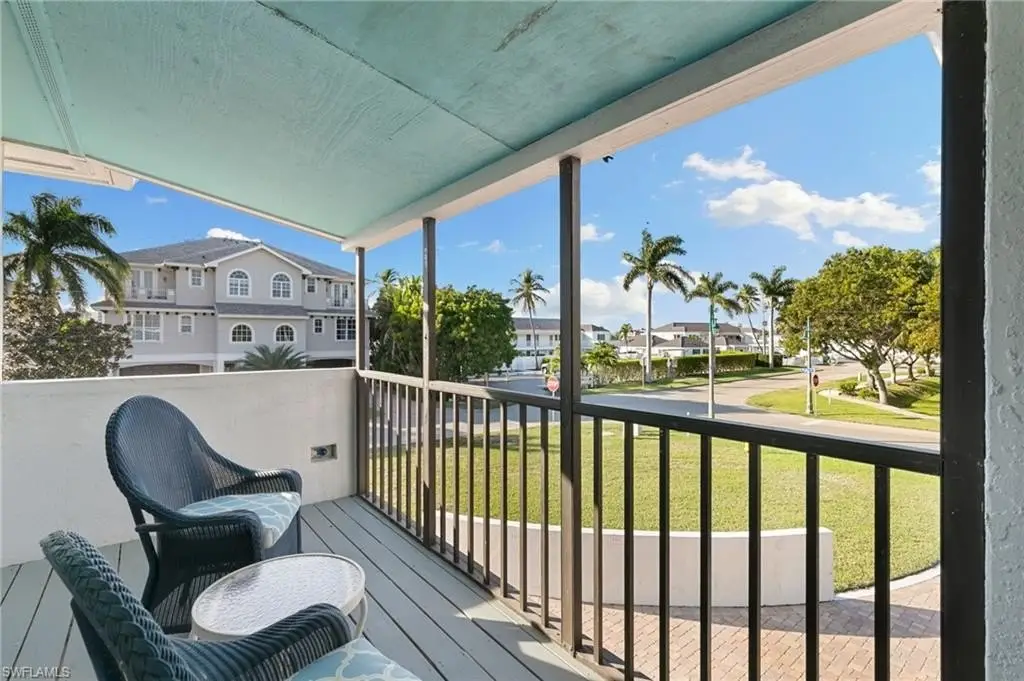
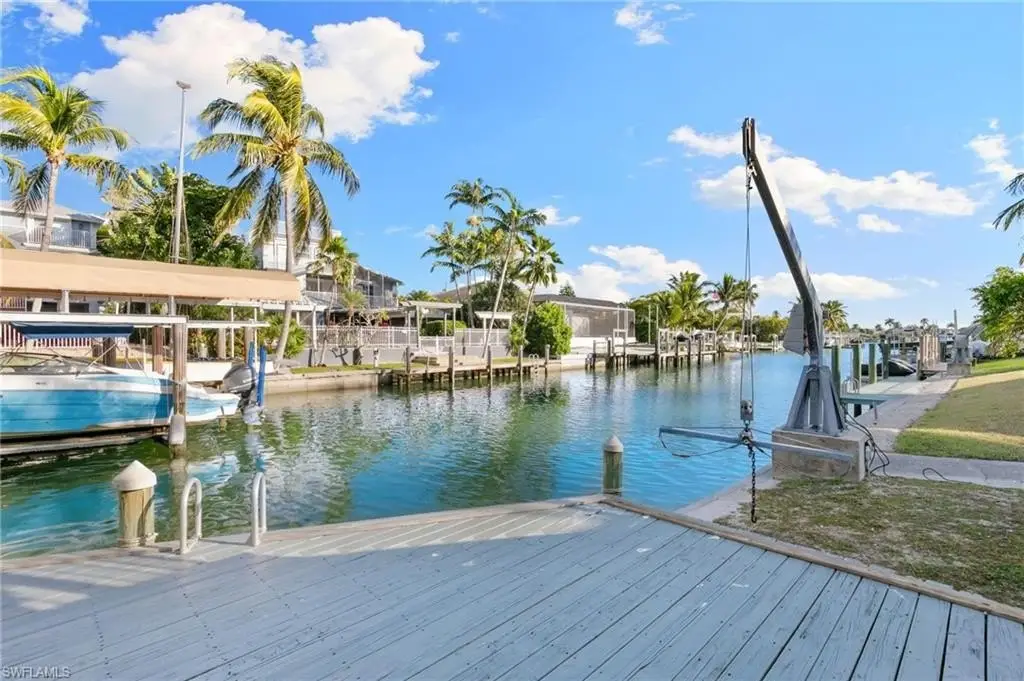
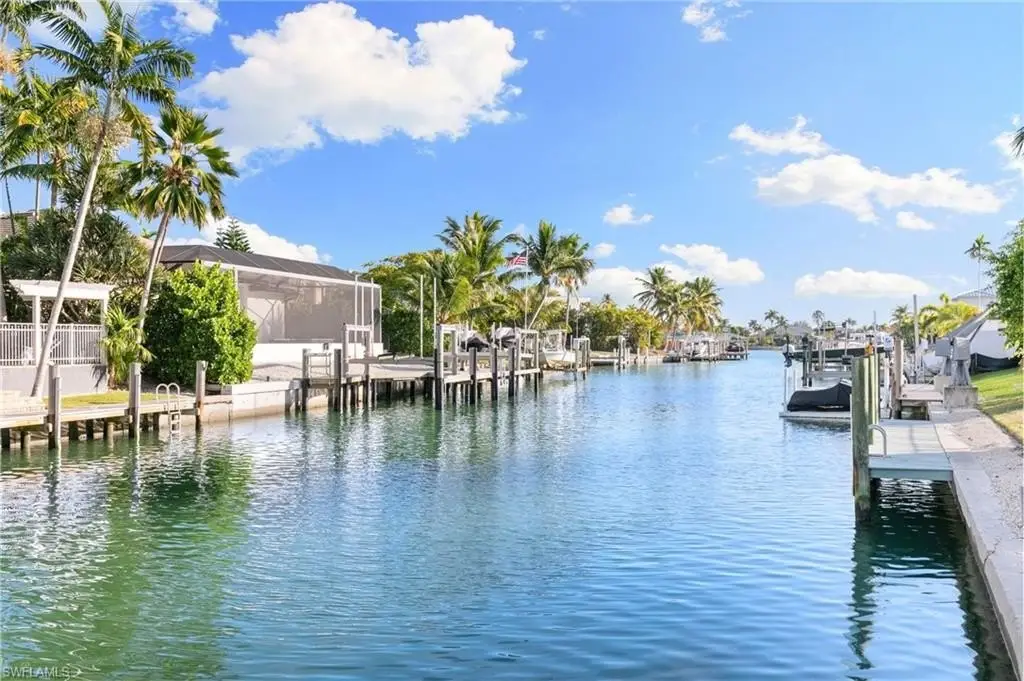
Boat Dock Private, Balcony, Screened Balcony
Appliances
Dishwasher, Dryer, Microwave, Refrigerator/Icemaker, Washer
Subdivision
MARCO ISLAND
Lot features
Oversize, Oversize
Elementary school
TOMMIE BARFIELD
Middle school
MANATEE MIDDLE
High school
MARCO ISLAND ACADEMY
Standard status
Active
APN
64611200002
Size
3,754 SF
Lot size
0.35 Acres
Taxes and HOA fees
Tax Year
2024
Tax Description
OLD MARCO VILLAGE BLK 1 LOT 38 OR 1213 PG 644
Tax Annual Amount
13206
Legal Description
OLD MARCO VILLAGE BLK 1 LOT 38 OR 1213 PG 644
Utilities
Heating system
Electric (Heating), Central
Cooling system
Central Air, Electric
Water front features
Seawall
Water front
1
Amenities
pool
water access
professional landscaping
private balcony
laundry room
wine-cooler
Building Details
Year built
1987
Floors in Building
2
Number of units
2
Flooring type
Wood, Carpet, Tile
Building materials
Concrete Block, Stucco
Roof type
Metal
Architectural style
Other
Listing Agency:
Premiere Plus Realty Company
(239) 732-7837
Listed By:
Joe Bartos, PA · License #267510559
(239) 394-3040
Added: Dec 18, 2025
Changed: Oct 16
Last Checked: Oct 16 at 10:06PM
MLS# 225082012
Copyright © 2026 Naples Area Board of REALTORS. All rights reserved. All information provided by the listing agent/broker is deemed reliable but is not guaranteed and should be independently verified.

Ask AI about this property
Review the available facts, identify missing information and prepare questions for the agent.
Investment Insights
Based on property information with market context.
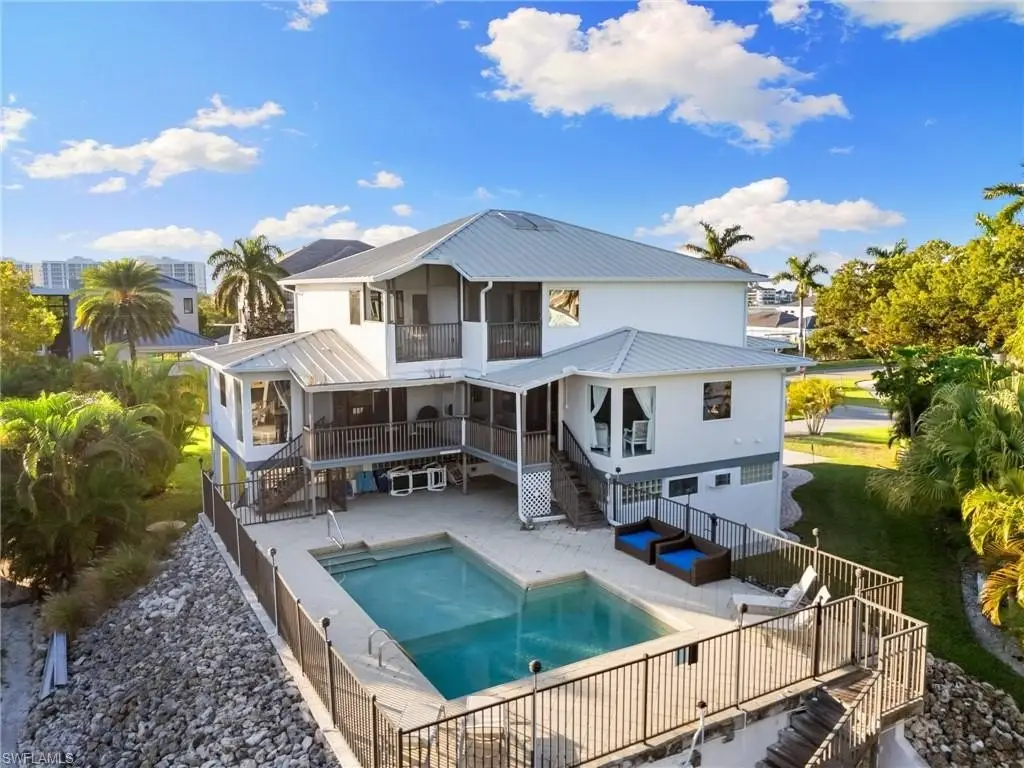
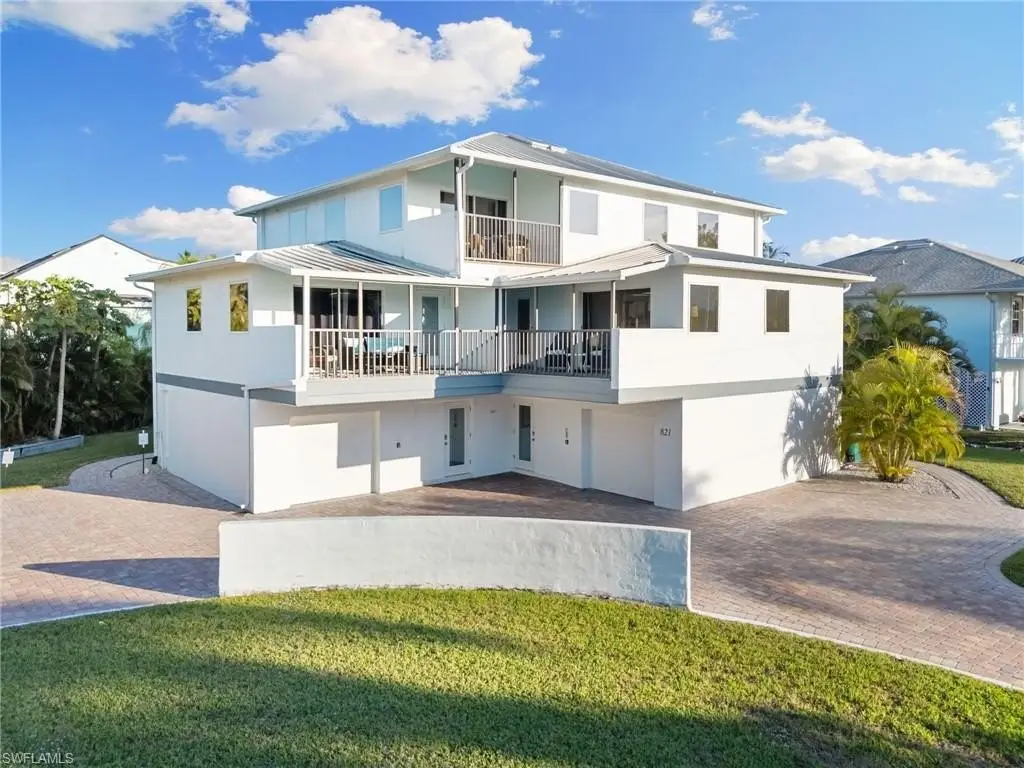
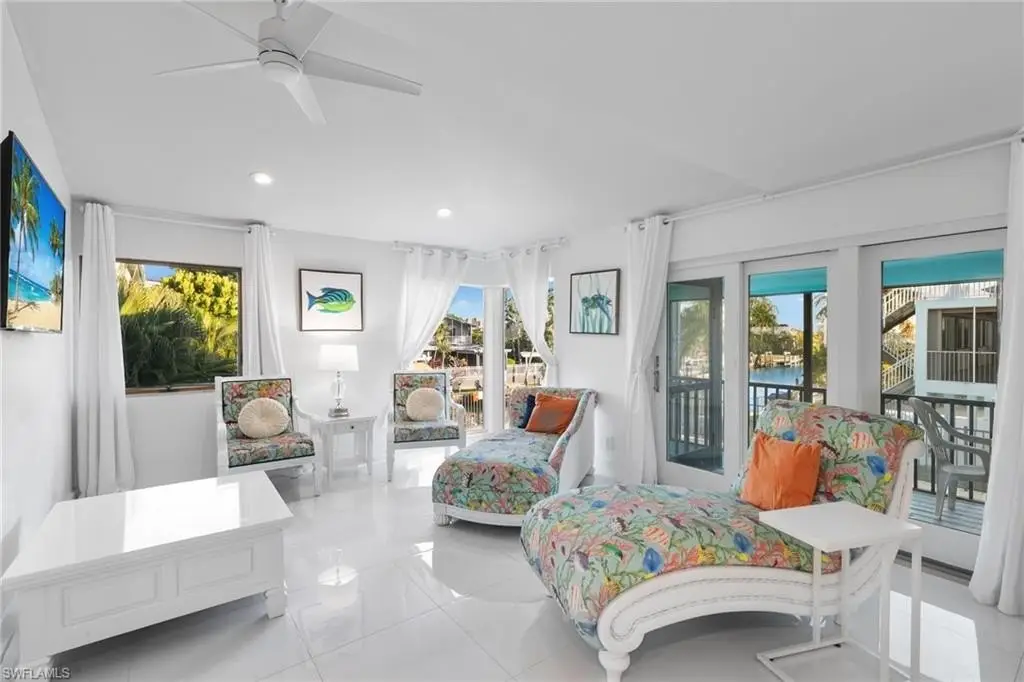
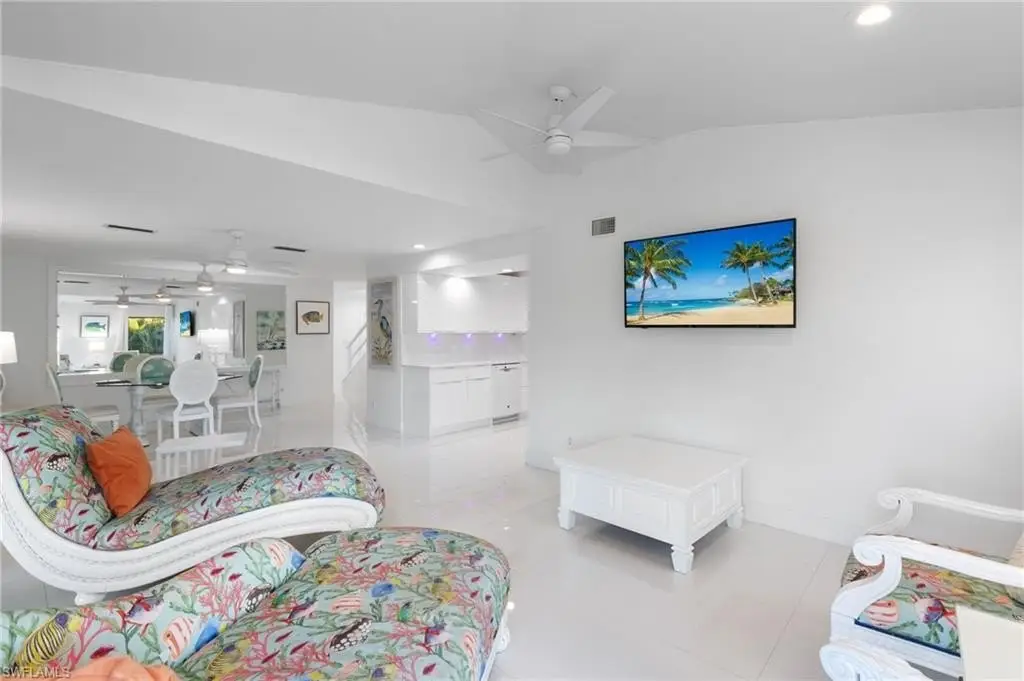
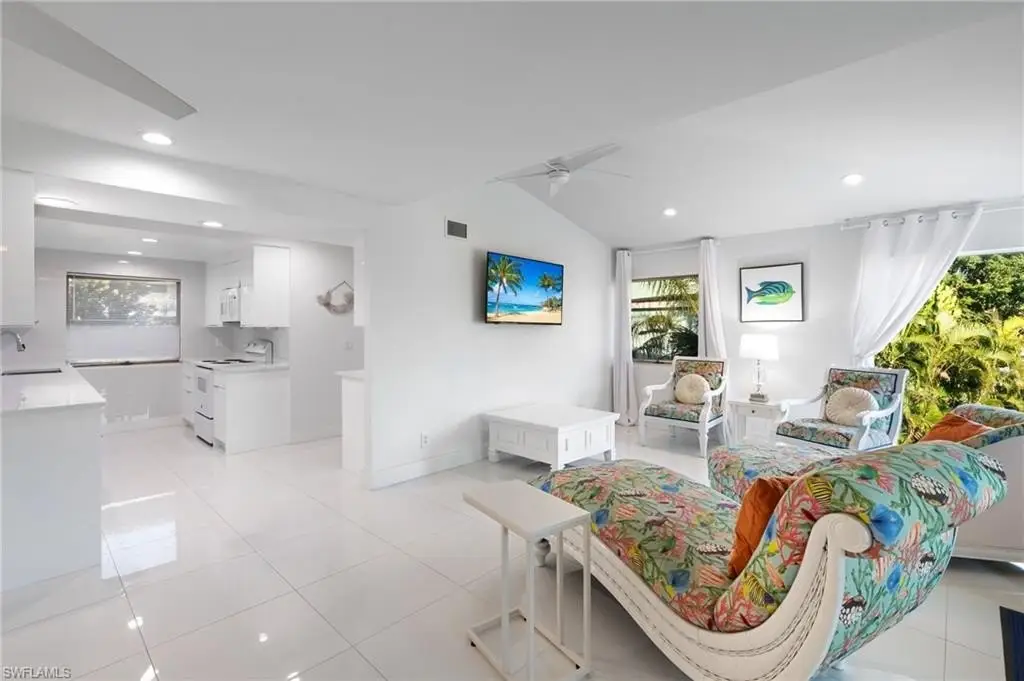
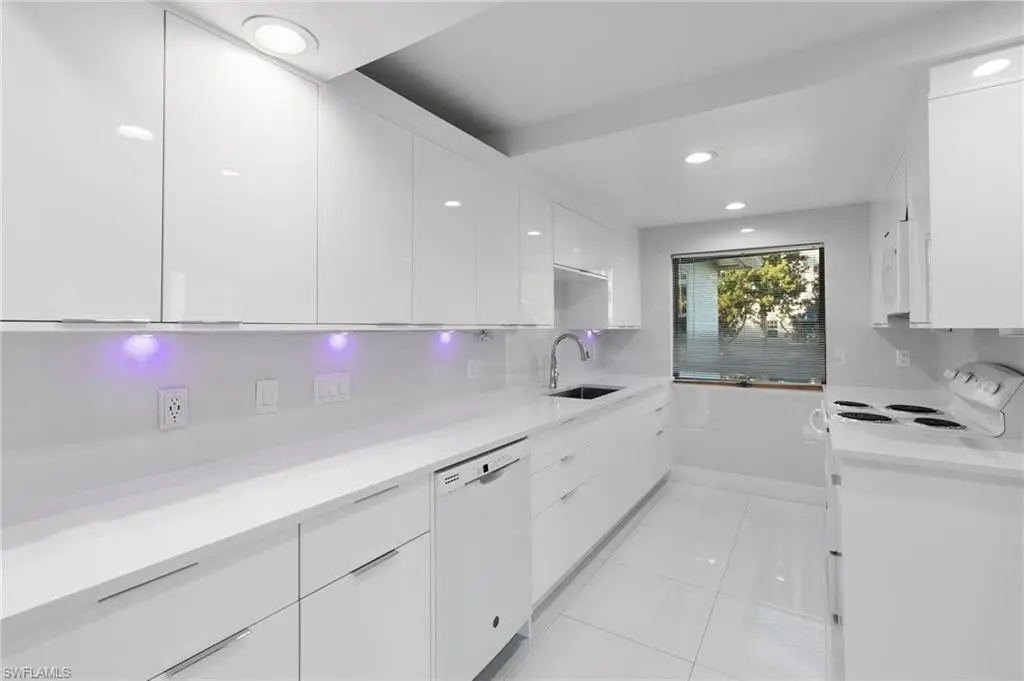
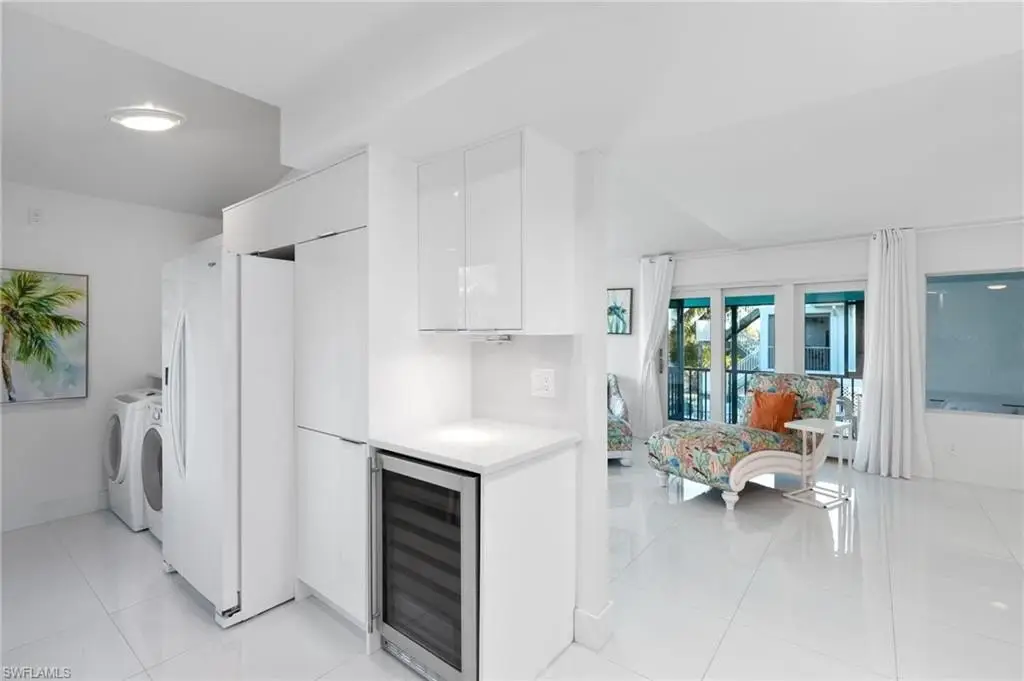
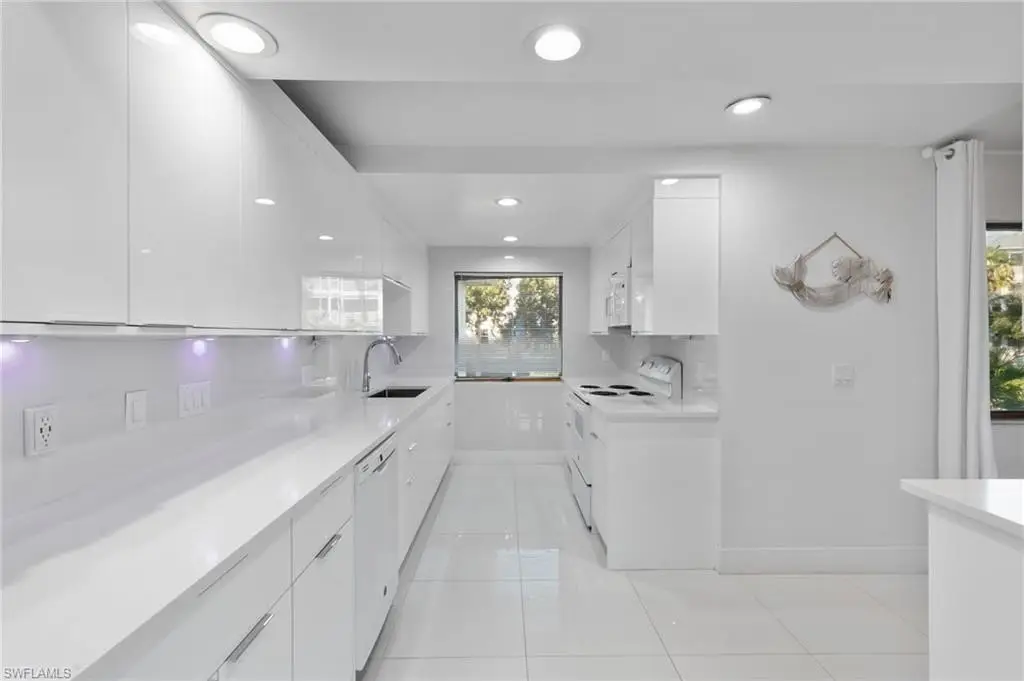
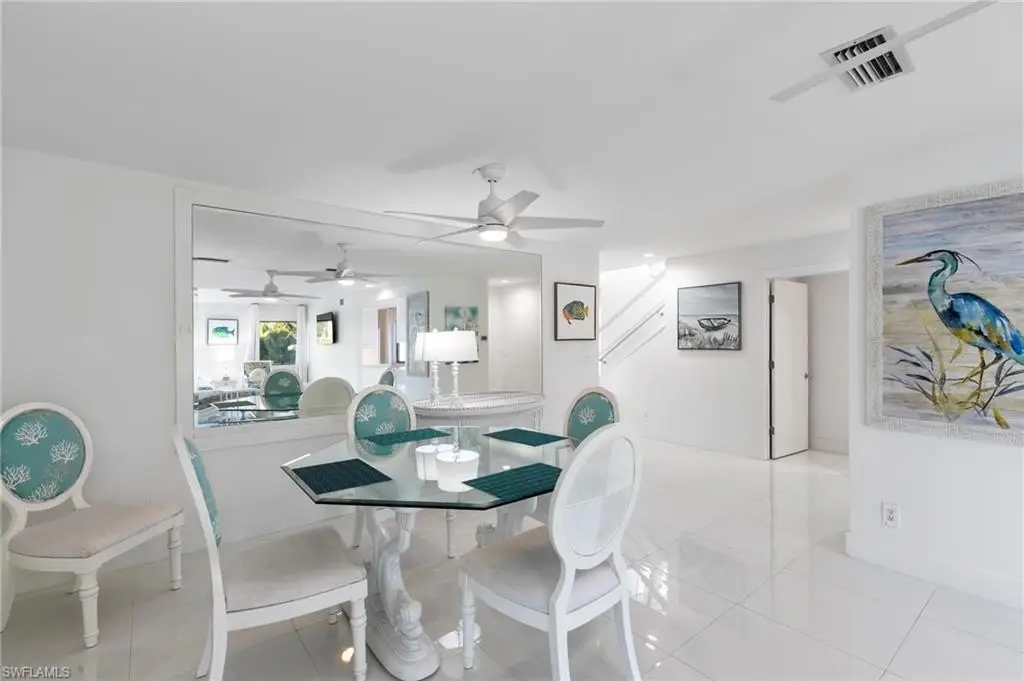
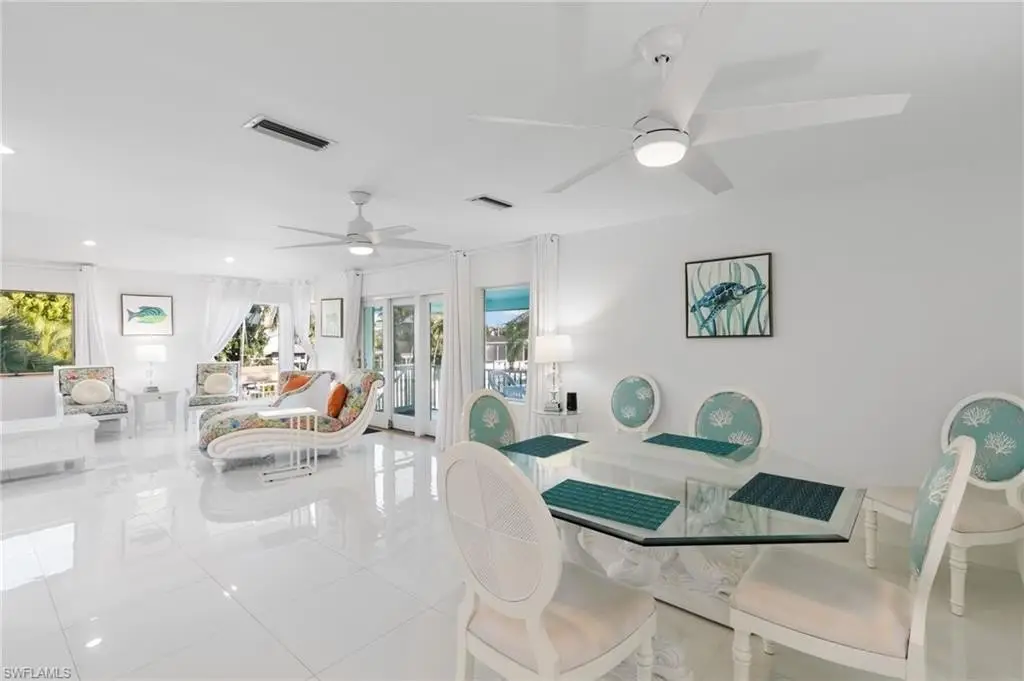
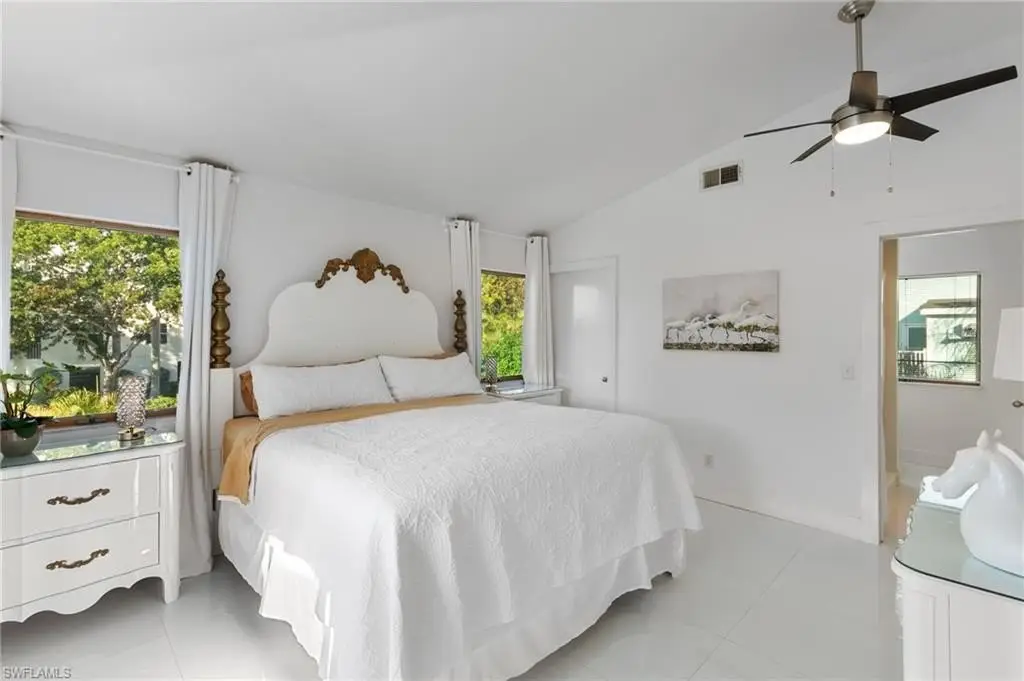
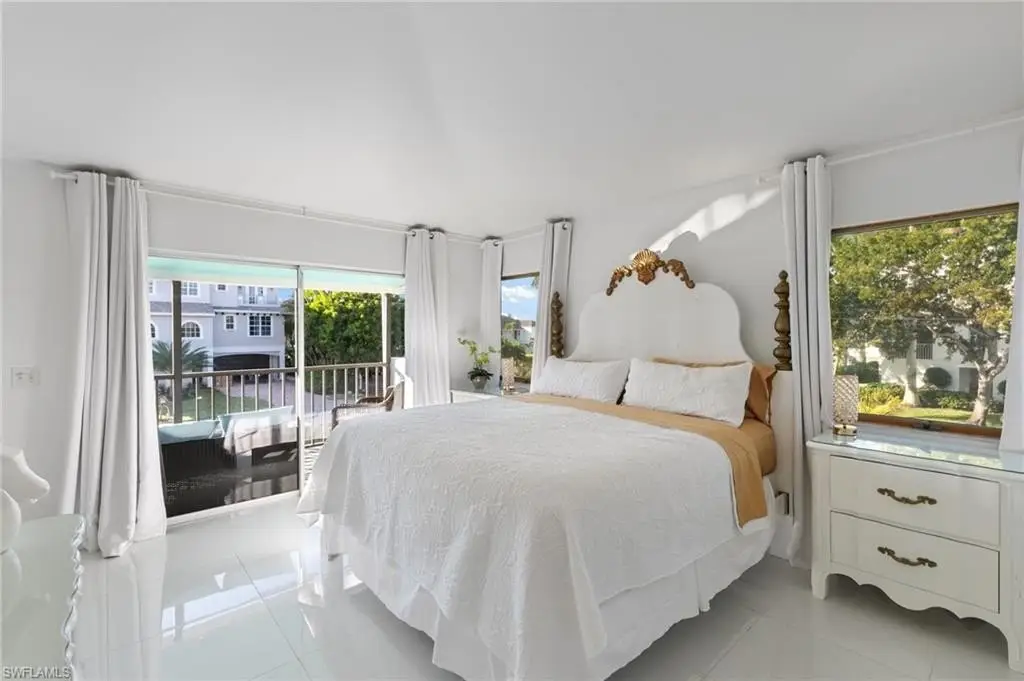
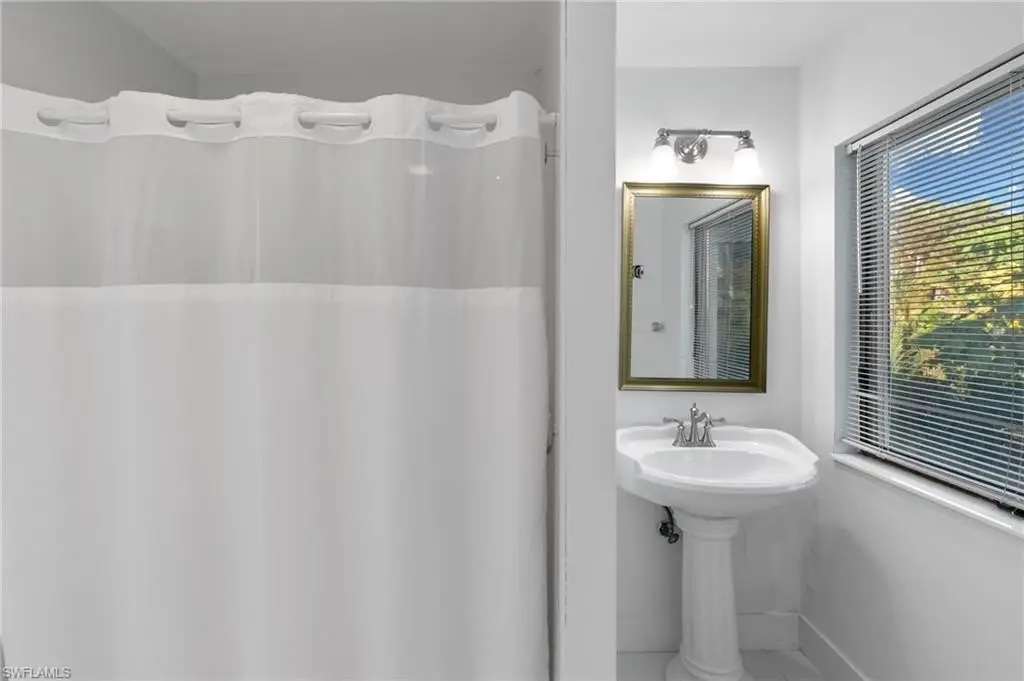
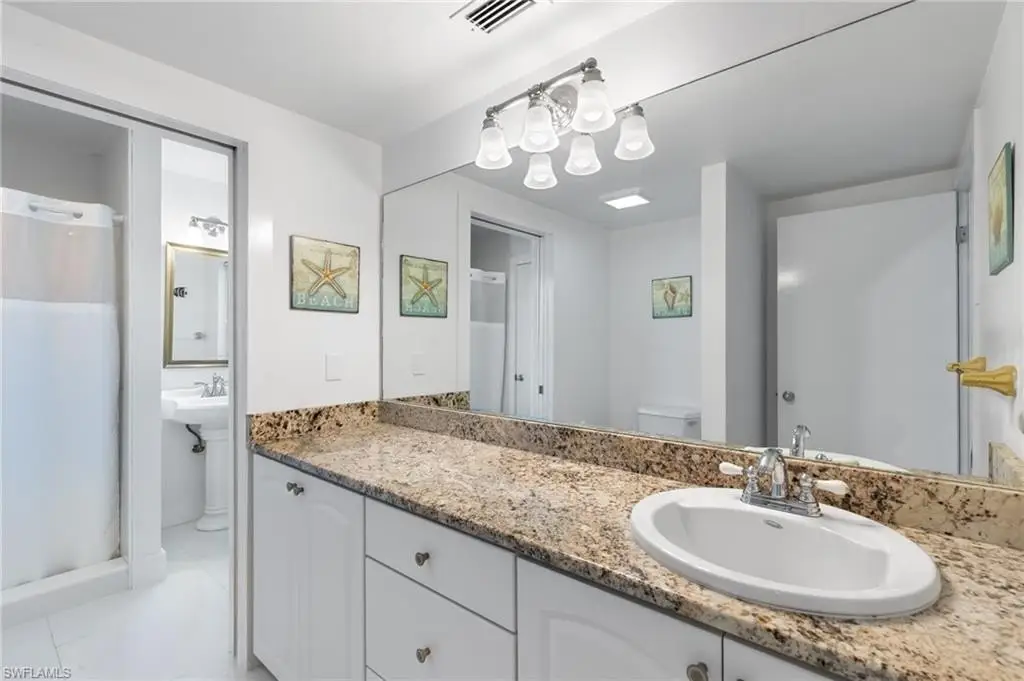
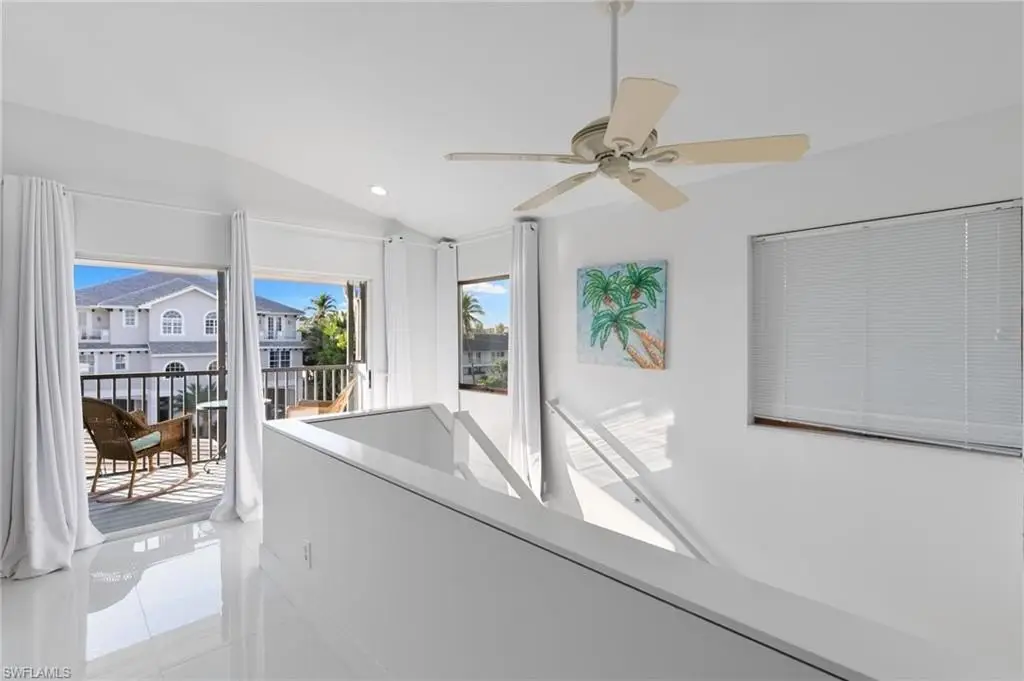
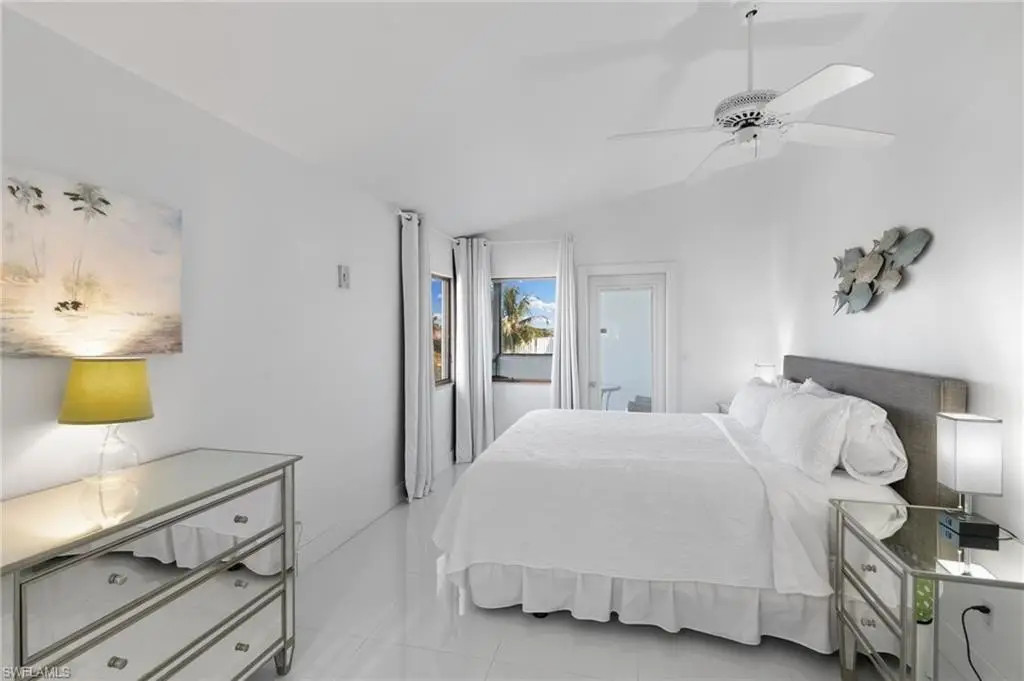
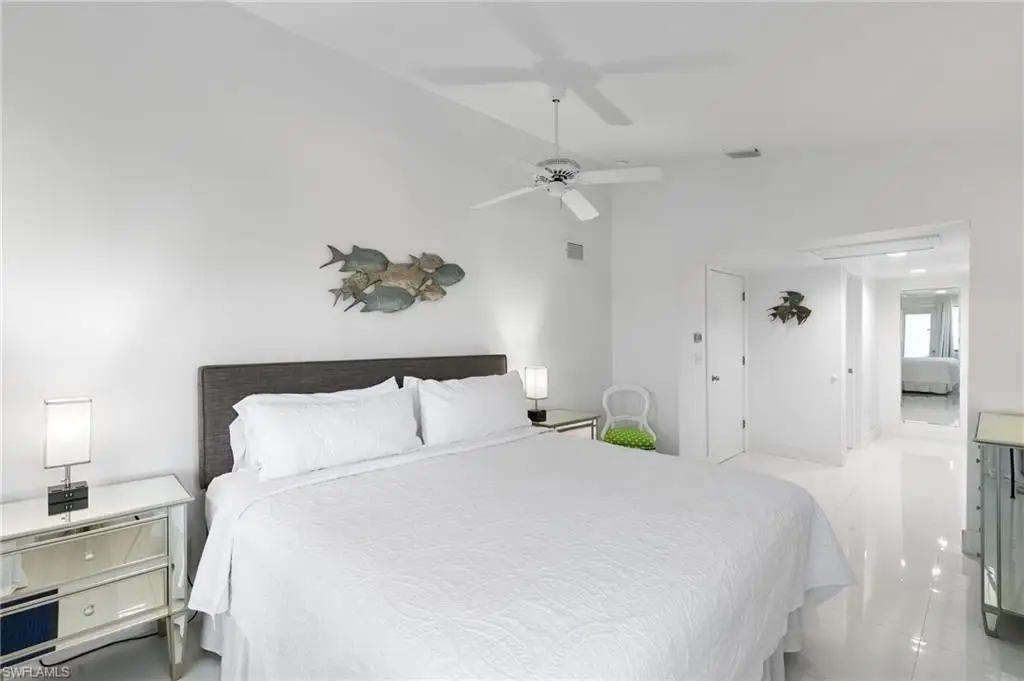
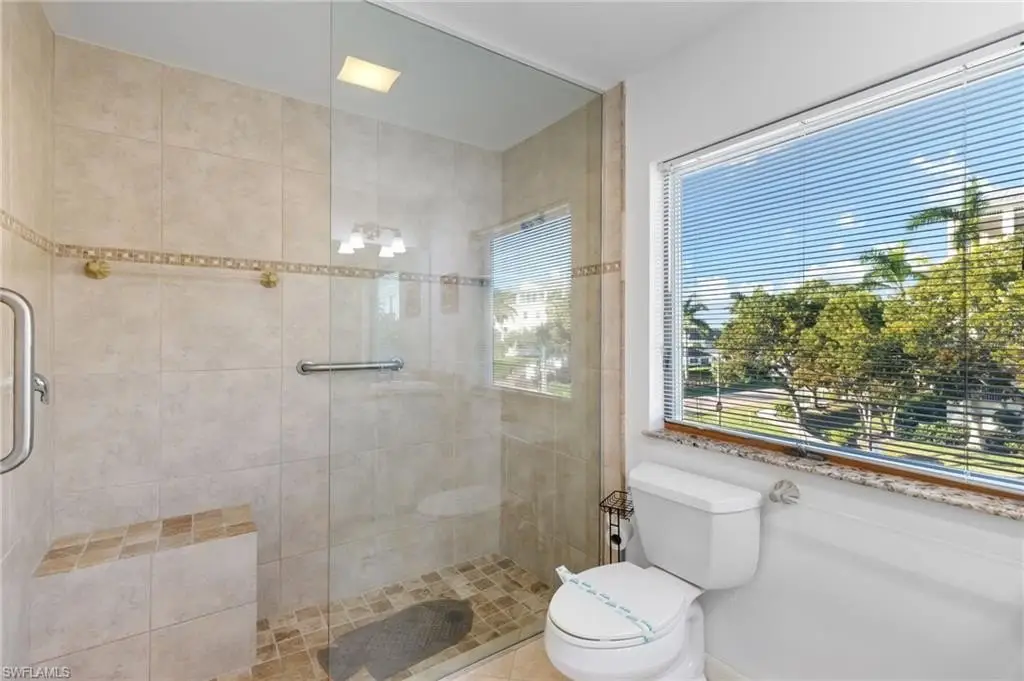
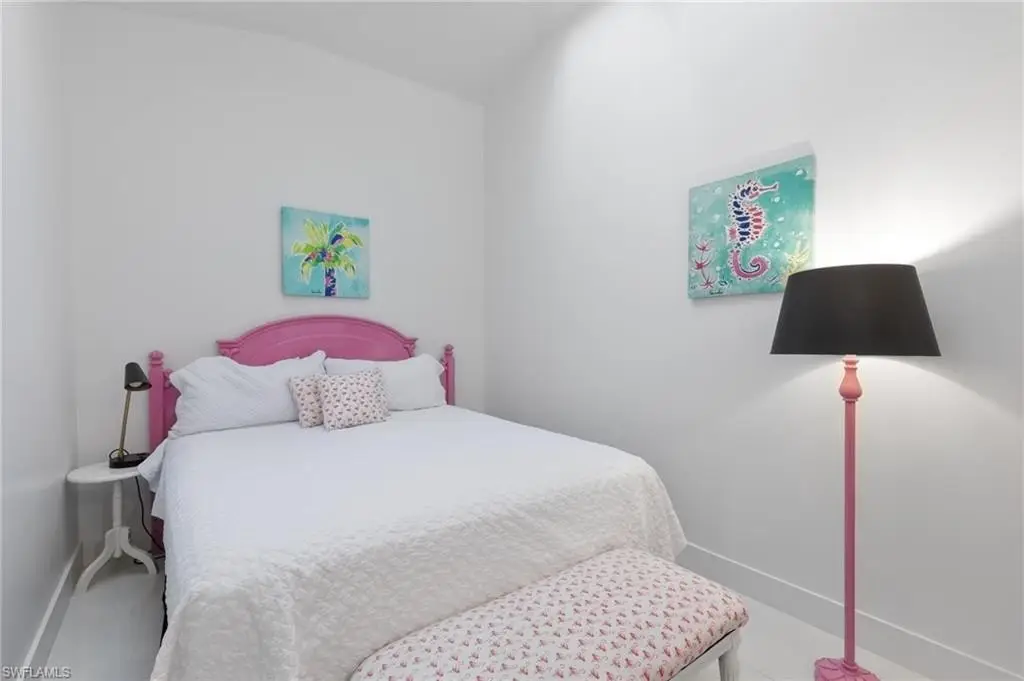
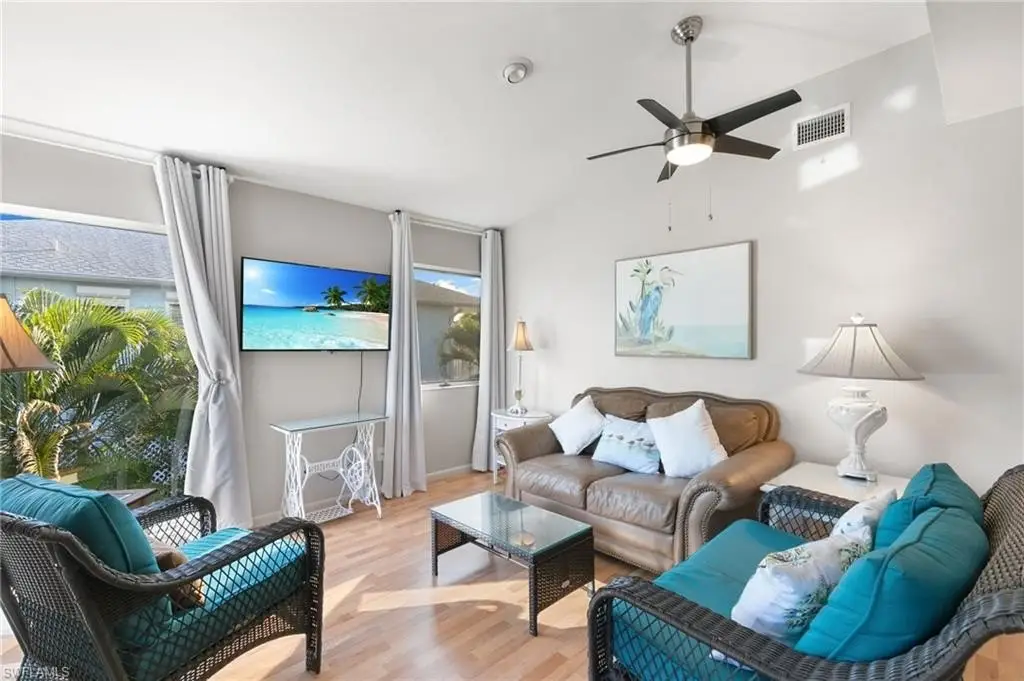
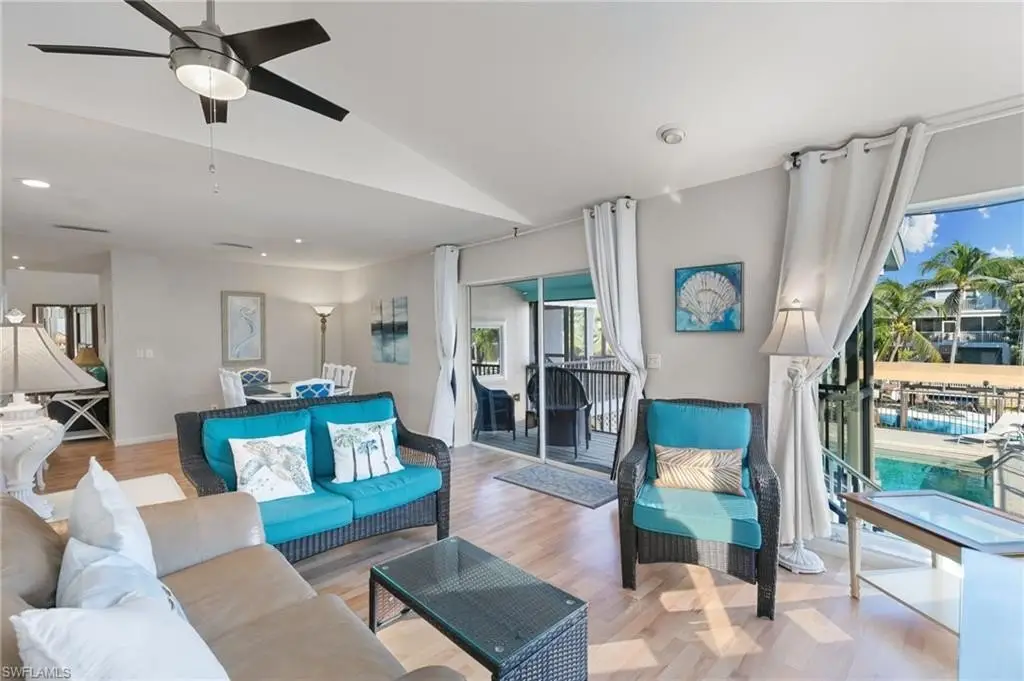
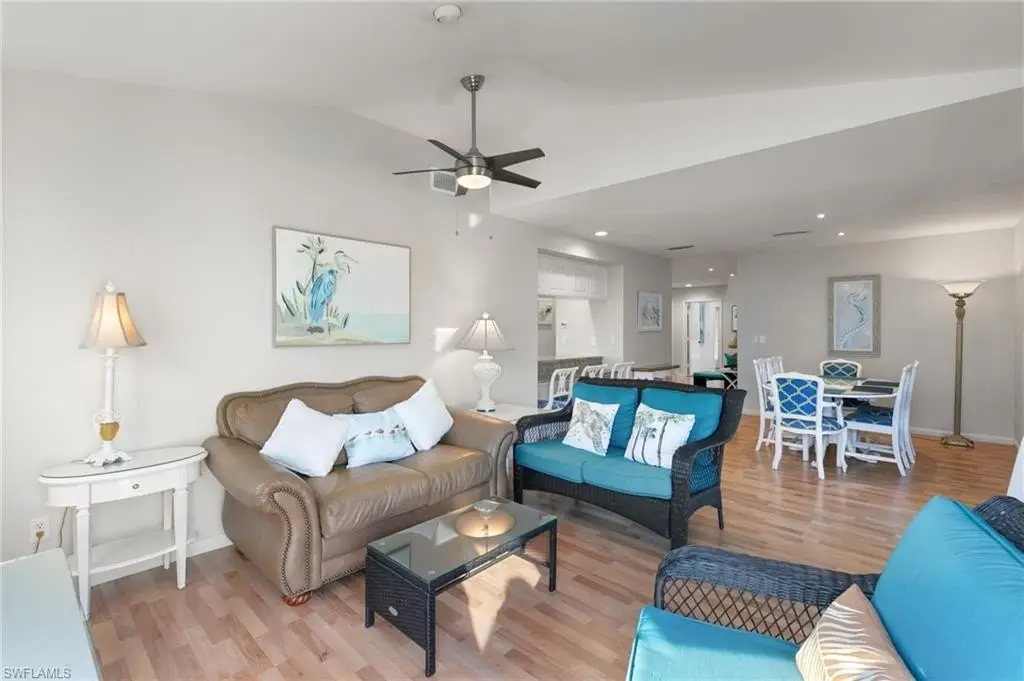
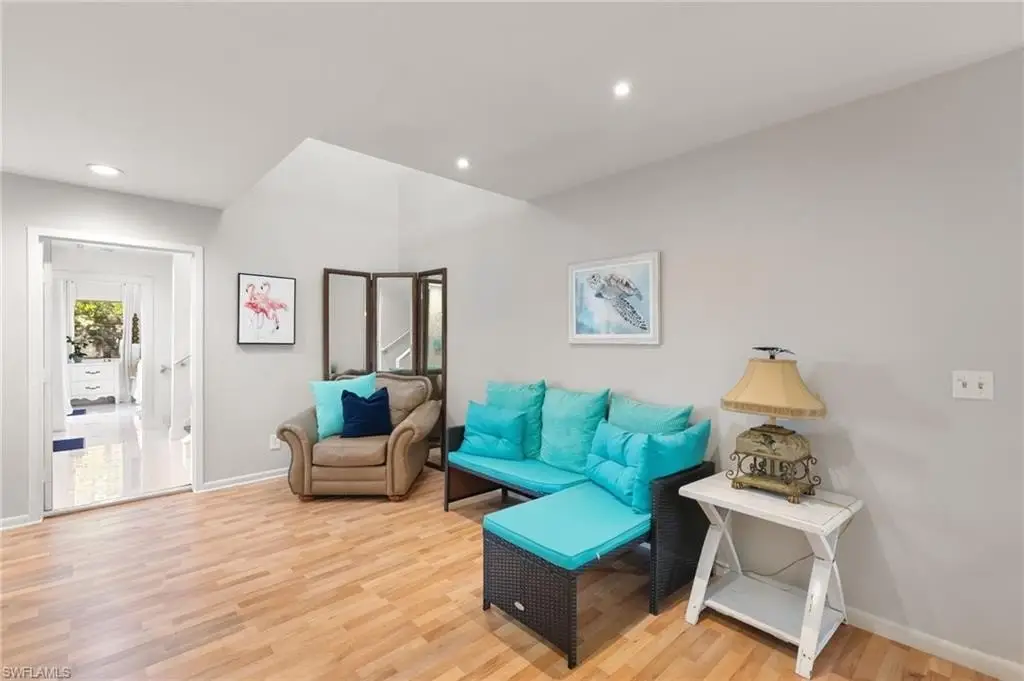
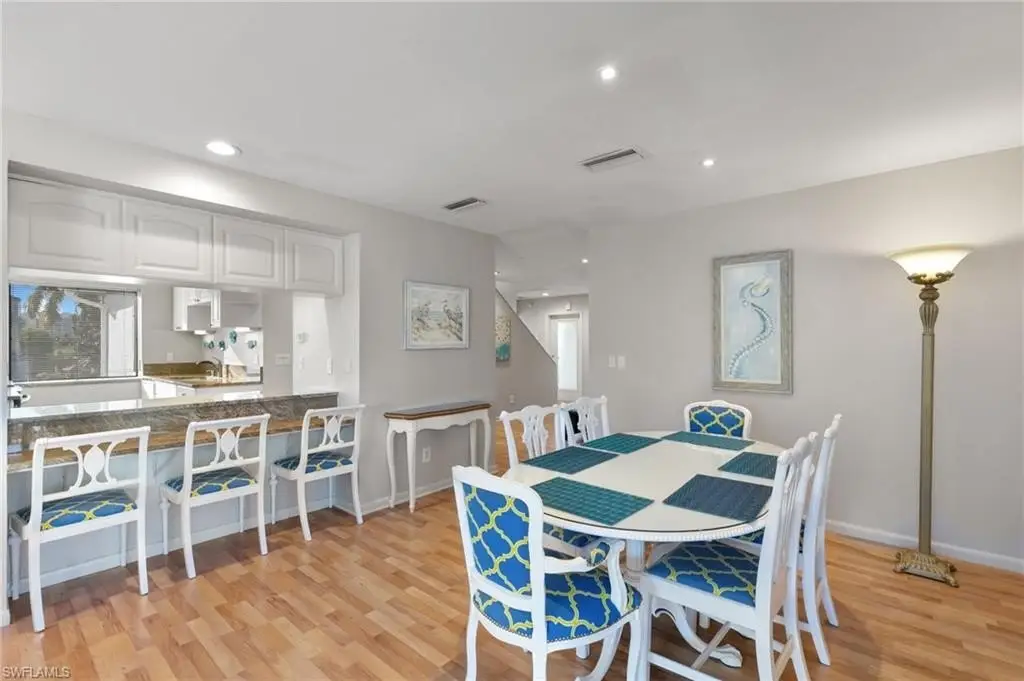
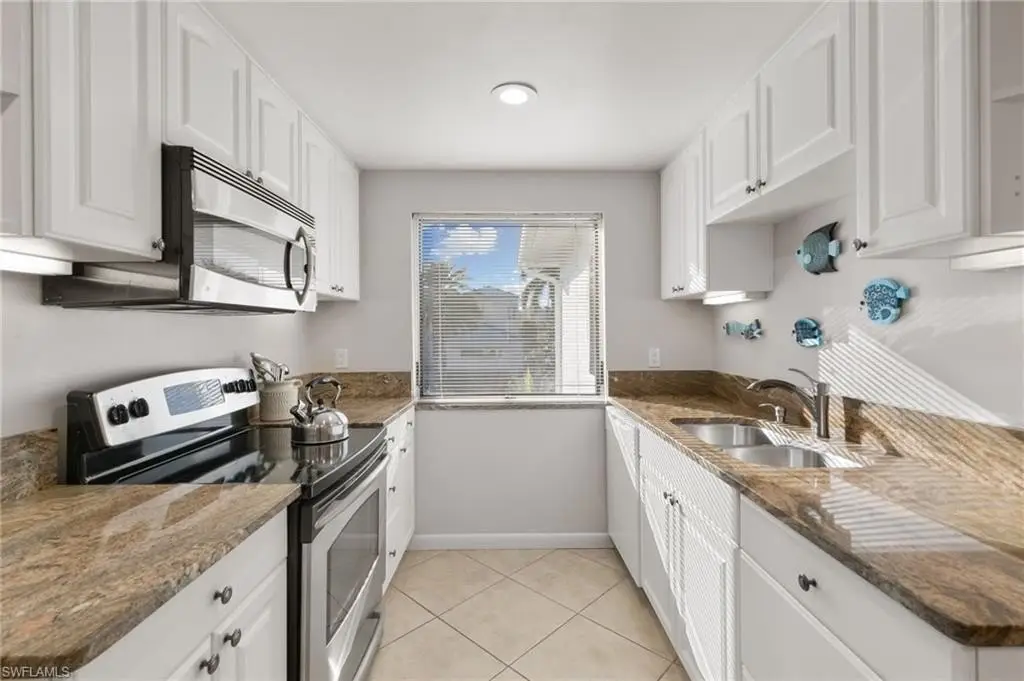
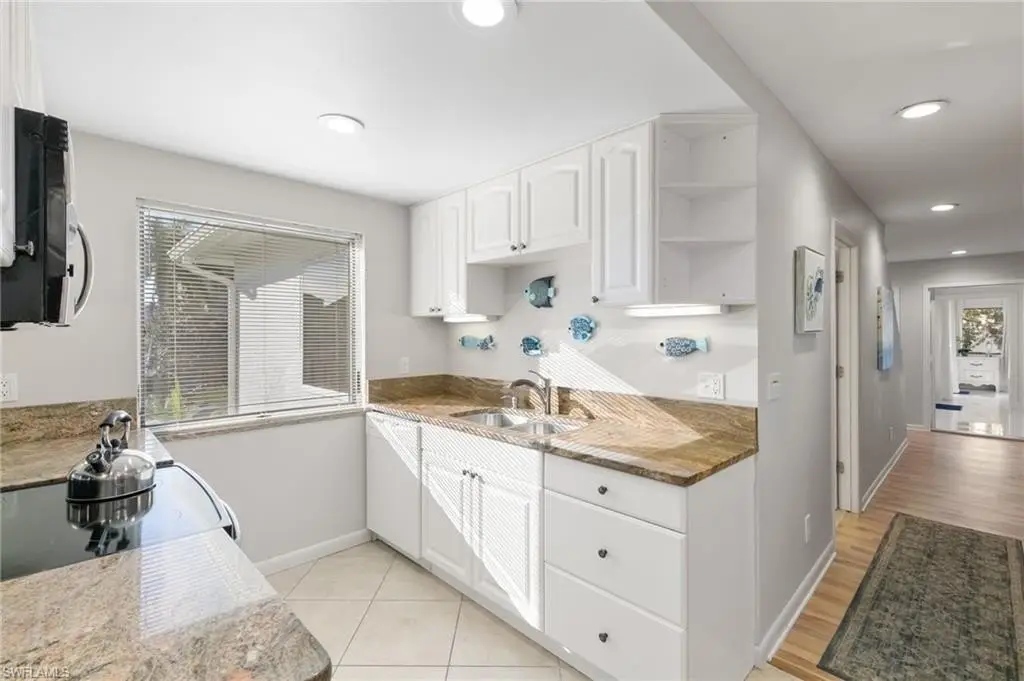
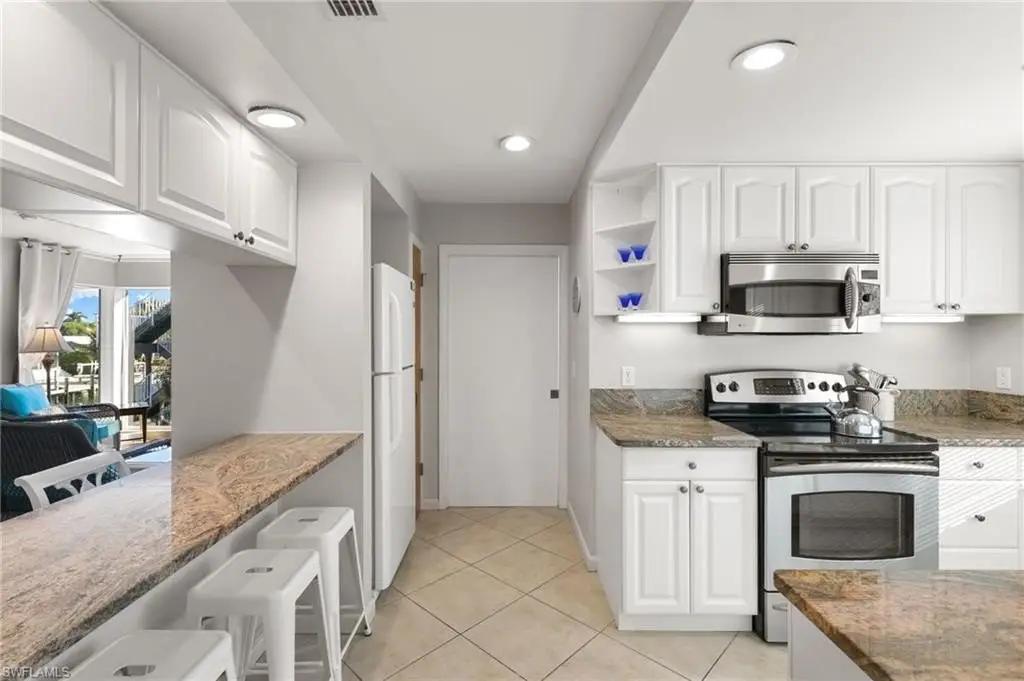
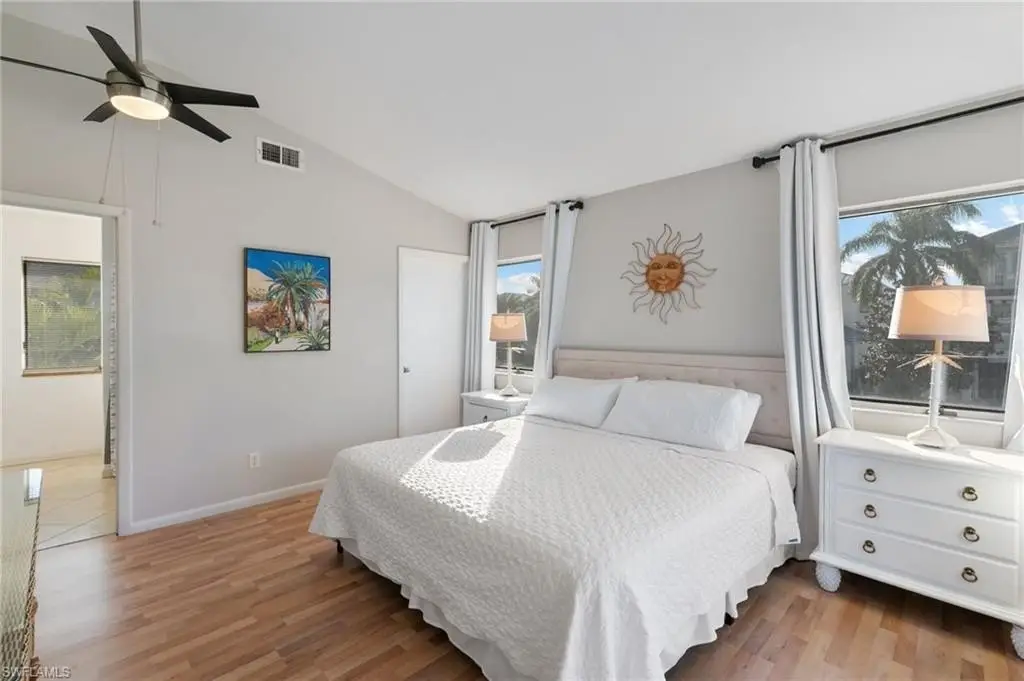
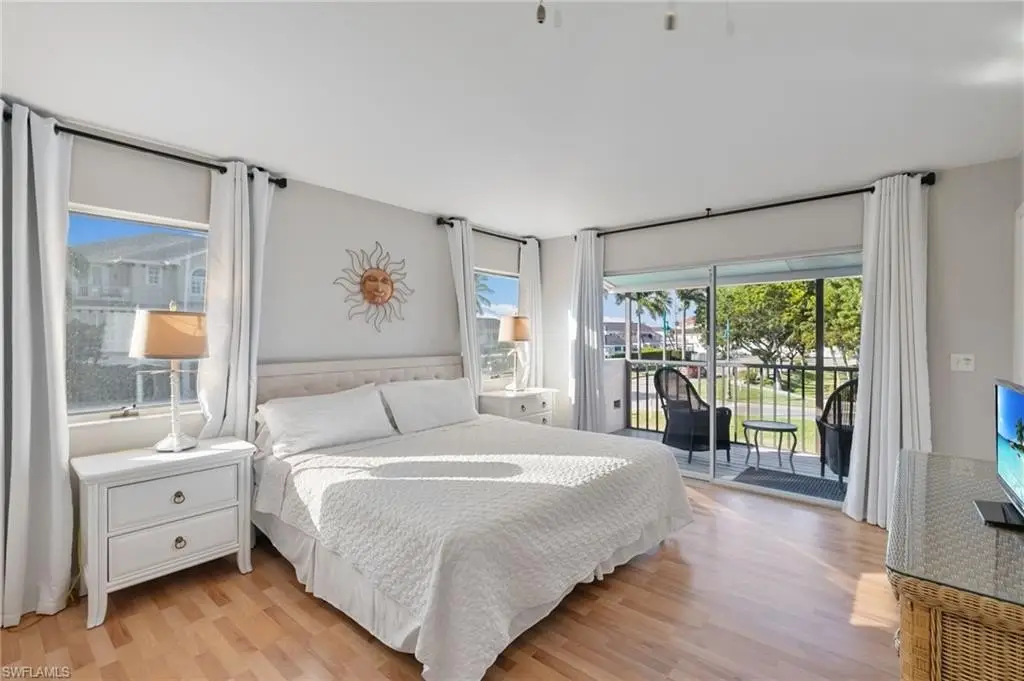
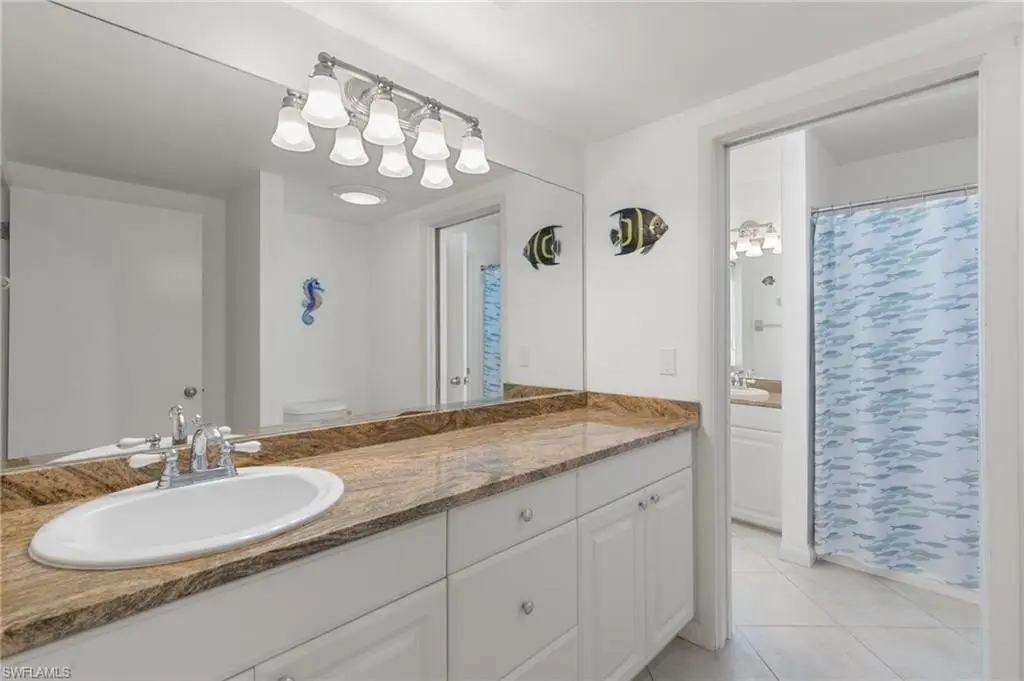
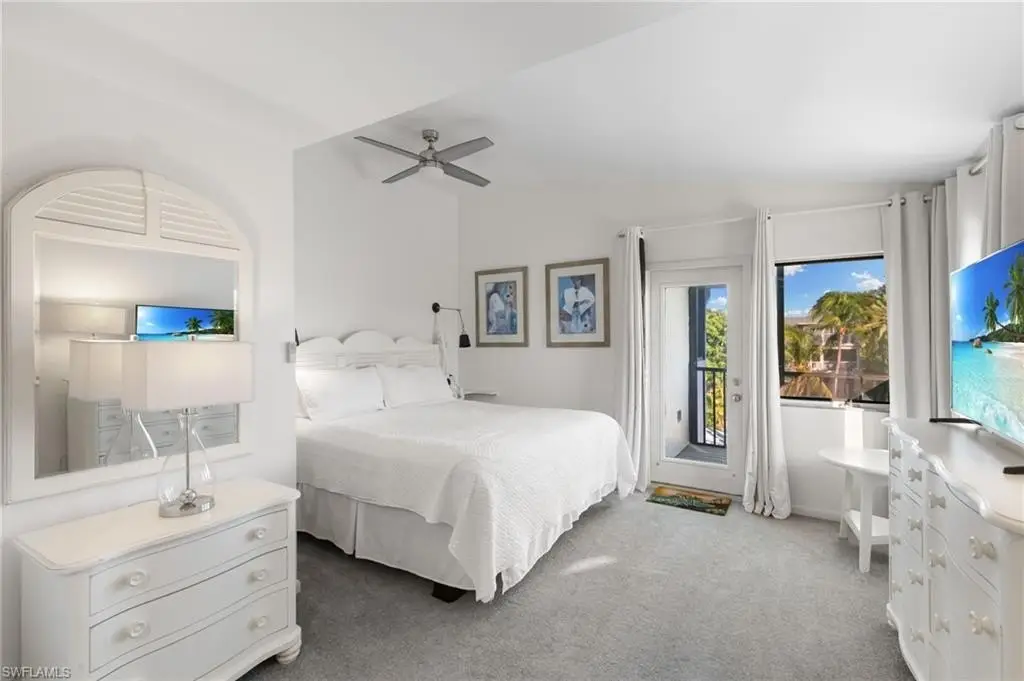
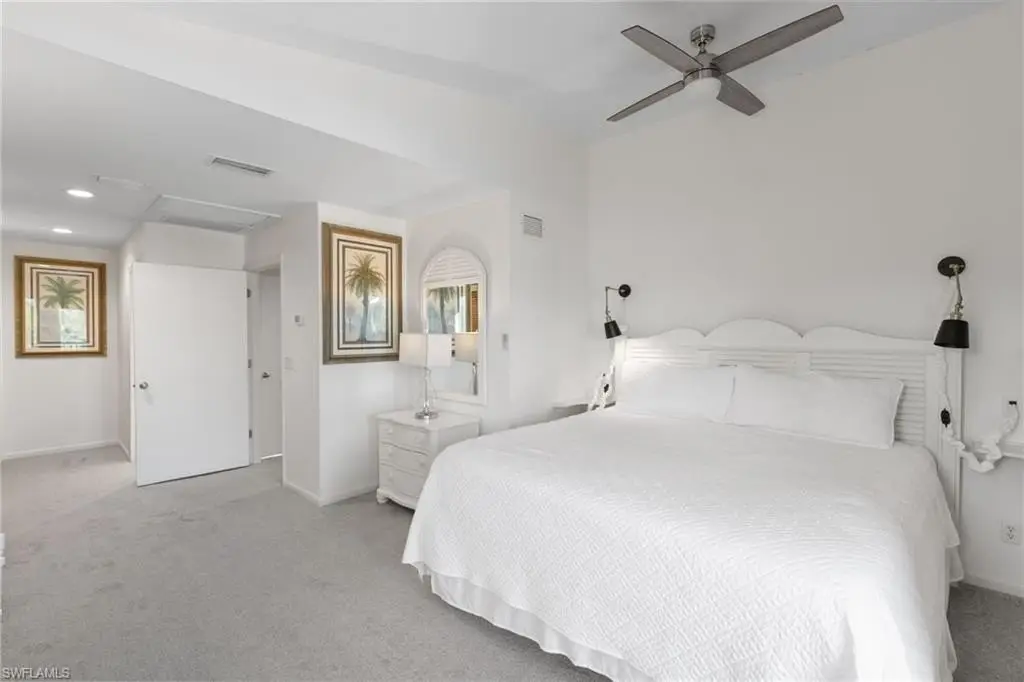
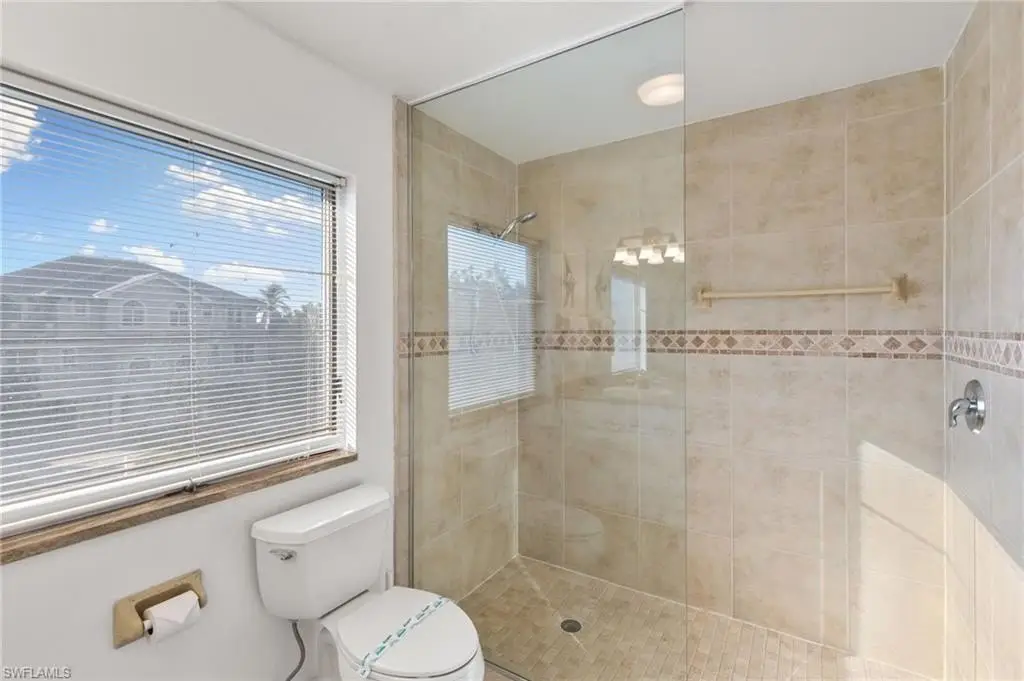
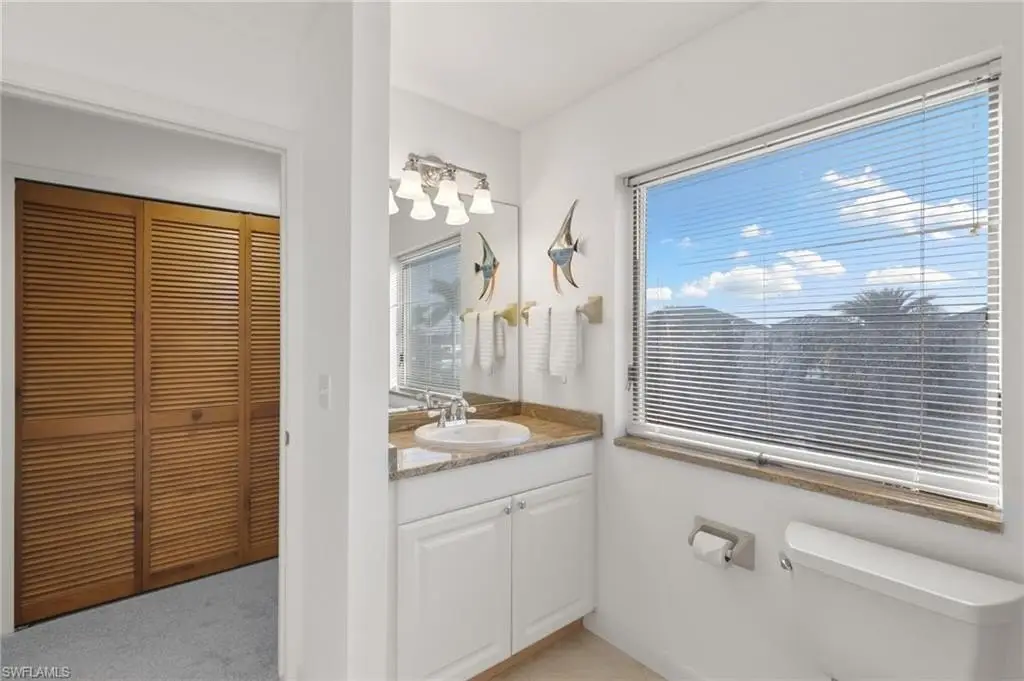
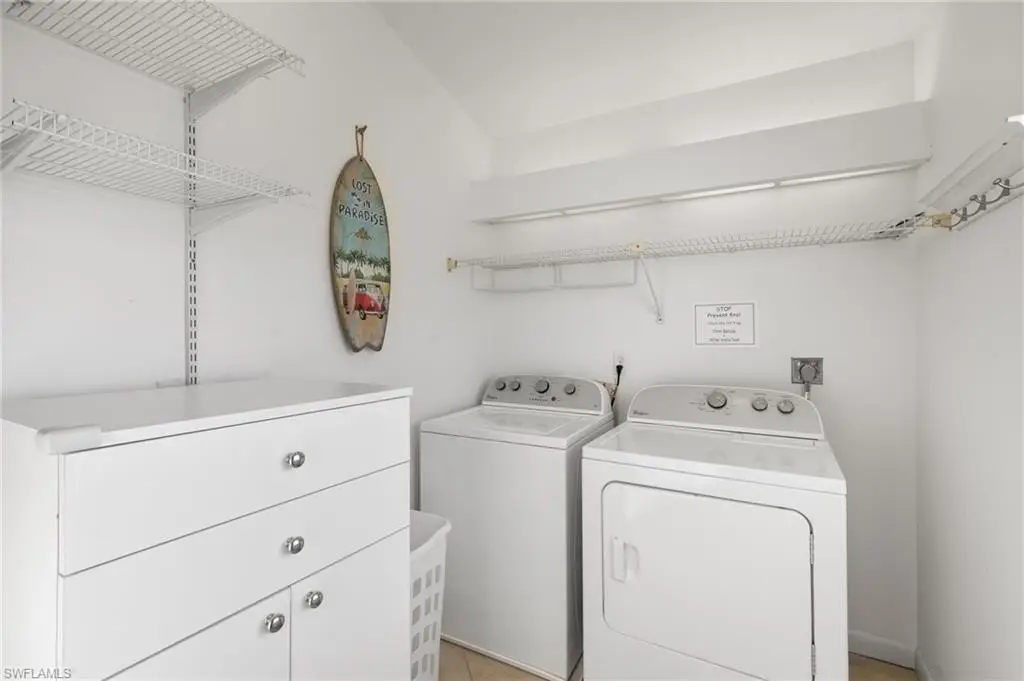
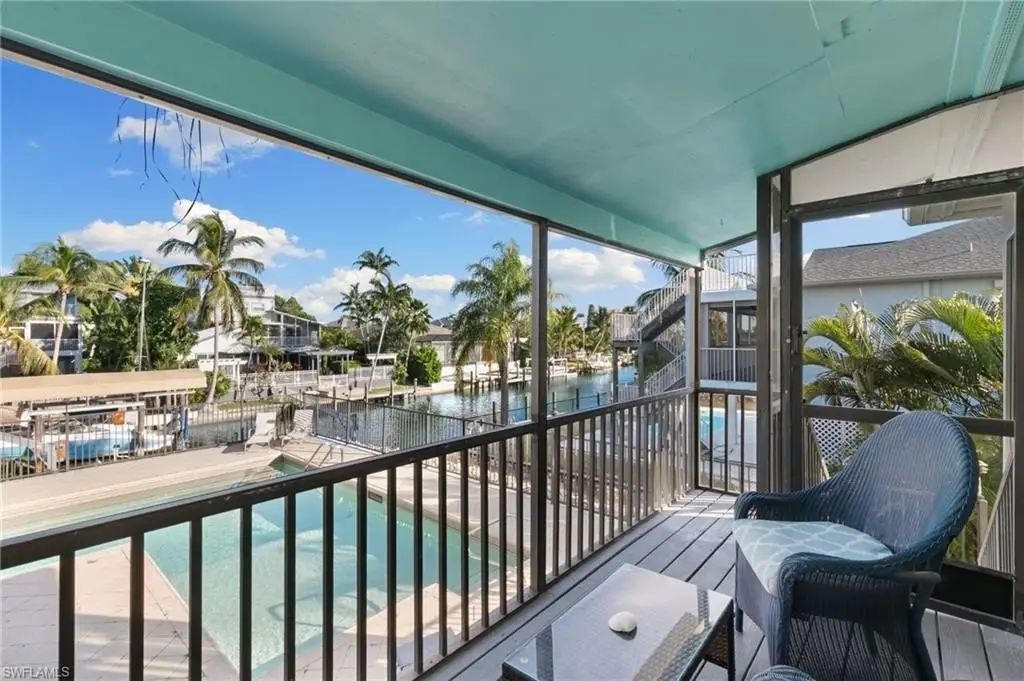
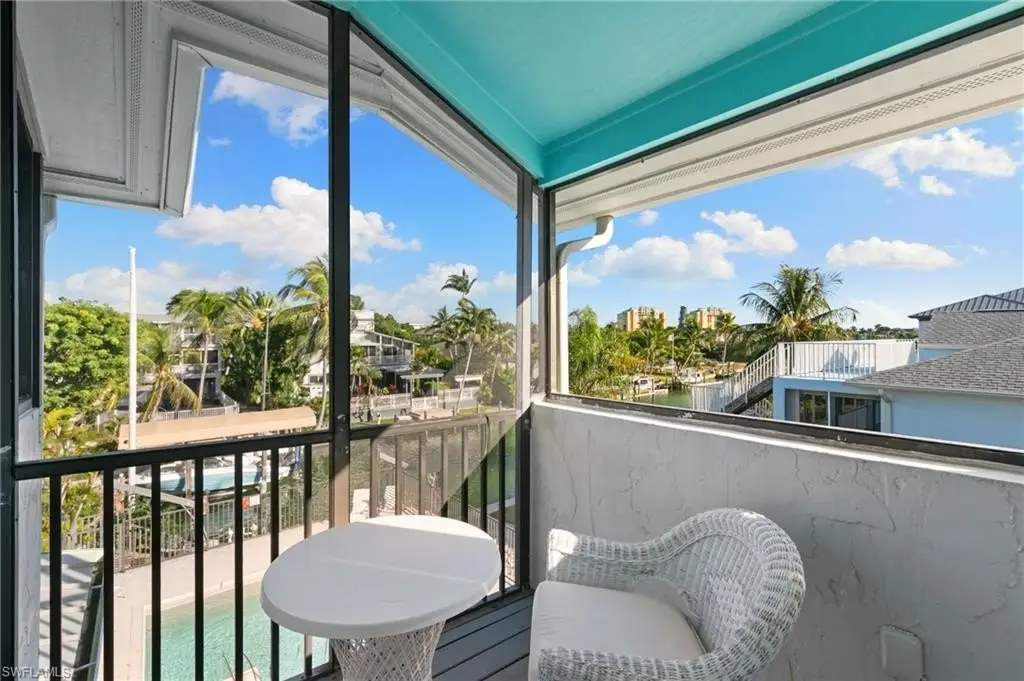
This 3,754-square-foot duplex on a 0.35-acre parcel includes two furnished residences, each with separate water and power connections and access to a private garage. Unit A contains two bedrooms, two bathrooms, private balconies, a loft, full laundry room, kitchen, dining area, and living room. Unit B provides three bedrooms, two bathrooms, four balconies, a galley kitchen, and remodeled interiors with quartz counters, tile flooring, a wine cooler, and washer and dryer. Four separate A/C units serve the property, while a walk-out basement adds storage space and includes two additional air-conditioners.
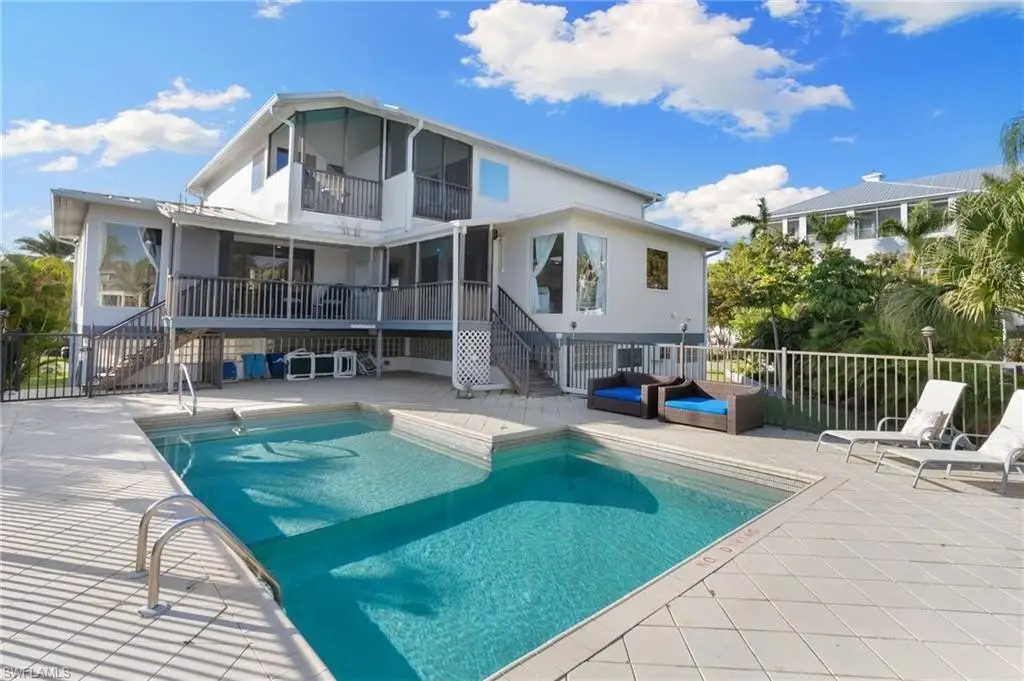
Built in 1987, the property features a private pool, seawall, boat dock, professional landscaping, canal views, and 6+ parking spaces, including two private garages. The location at Palm Street and Edington Place in Old Marco is within walking distance of shops and restaurants, including Snook Inn, and offers direct water access to the Gulf of America.
Built in 1987, the property features a private pool, seawall, boat dock, professional landscaping, canal views, and 6+ parking spaces, including two private garages. The location at Palm Street and Edington Place in Old Marco is within walking distance of shops and restaurants, including Snook Inn, and offers direct water access to the Gulf of America.
Key Highlights
- Two‑unit duplex with 3,754 square feet on 0.35 acres
- Unit A: 2 bedrooms, 2 bathrooms, loft, full laundry room, and private balconies
- Unit B: 3 bedrooms, 2 bathrooms, 4 balconies, and newly remodeled interiors
Financial Insights
Estimated NOI and Cap Rate
NOI / Yr
$55,455
Cap Rate
3.08%
Suggested Prices Based on Cap Rates
Cap Rate 5%
$1,109,100
$1.1M
Cap Rate 7%
$792,214
$792.2K
Cap Rate 9%
$616,167
$616.2K
Market Conditions
NOI Build-Up for 3,754 SF
Gross rent
$83.3K $22.20/SF
− Vacancy
−$4.1K −$1.10/SF
EGI
$79.2K $21.10/SF
− OpEx
−$23.8K −$6.33/SF
NOI
$55.5K $14.77/SF
Area
Collier County, FL
Vacancy
4.94%
Lease Rate
$22.20 /SF/Yr
Expense Ratio
30.00%
Simulate Cap Rate and NOI
Suggested Prices Based on Cap Rates
Cap Rate 5%
$1,109,100
Cap Rate 7%
$792,214
Cap Rate 9%
$616,167
Alternative Uses
Best Use
Multifamily LT 5
$792.2K
$693.2K – $924.3K
NOI $55,455 @ 7.0% cap · market cap 3.08%
Second Best
Apartment 5plus
$728.1K
$637.1K – $849.5K
NOI $50,969 @ 7.0% cap · market cap 2.83%
Theoretical Best
Office A
$1.51M
$1.32M – $1.76M
NOI $105,466 @ 7.0% cap · market cap 5.86%
Zoning and permitted uses should be independently verified with authorities.
How Realmo checks its estimates
Property Analytics
Unlock full access to Insights
Subscribe to Realmo Intelligence
Open Analytics
Current Use
Lease Details
2
Residential units
Yes
Paved road access
Yes
Utilities to site
Location Intelligence
Trade Area within ½ mile
126
Businesses Nearby
Explore this area
Business Placement
Demographics for 34145, FL
15,717
Population
18,436
Households
0.9
Avg Household Size
66
Median Age
48%
College-Educated
97%
High-School Grad
16.3 sq mi
ZIP Area
964
Density / Sq Mi
$104,105
Median Household Income
$53,813
Median Earnings
$1,955
Median Rent
$866,200
Median Home Value
Check the figures for this property
Cap Rate, Value Estimation, Potential NOI and more
View Realmo Analytics
Market
Vacancy Rate% for Multifamily in South region




Frequently Asked Questions
What type of property is this?
Duplex - Two furnished residences offer separate utilities, private garages, balconies, and access to a private pool.
Where is this duplex located?
The property is located at 821 Palm St Marco Island, FL.
What is the asking price?
The asking price for this property is $1,800,000.
What are key features of this property?
This property features: Two‑unit duplex with 3,754 square feet on 0.35 acres; Unit A: 2 bedrooms, 2 bathrooms, loft, full laundry room, and private balconies; Unit B: 3 bedrooms, 2 bathrooms, 4 balconies, and newly remodeled interiors


