Multi-Tenant Industrial Flex
For Sale
Contact for pricing
820 W Harrison Road, Longview, TX 75604
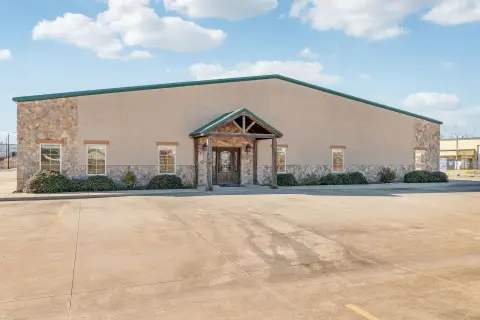
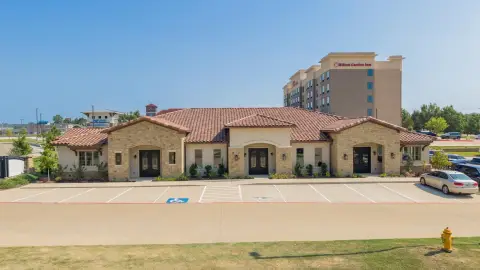
Three industrial properties combine office, shop, storage, yard, fueling, crane, and wash-bay improvements across Longview.
Property Size38,500 SF
Price / SF$172.73
Days on Market58
Property Features for 820 W Harrison Road
General Information
Standard status
Active
Size
38,500 SF
Class
A
Property subtype
Industrial
Zoning
I-2 Industrial & No Zoning
Occupancy
100%
Lease Type
NNN
Investment Type
Net Lease
Net Operating Income
$438,000
Building Details
Year Built
2006
Year Renovated
2020
Buildings
6
Stories
1
Tenancy
Multi
Listing Agency:
Ihrig Properties
Listed By:
Cole Ihrig · License #687179-B
(903) 533-1255
Source:
Crexi
Added: Aug 24
Changed: Oct 2
Last Checked: Oct 19 at 5:35AM
Displayed information is deemed reliable but is not guaranteed and should be independently verified. All listing content including descriptions, pricing, images are the copyrighted material of Ihrig Properties

Ask AI about this property
Review the available facts, identify missing information and prepare questions for the agent.
Investment Insights
Based on property information with market context.
This multi-property flex-space offering includes three industrial sites totaling approximately 17.76 acres. The improvements include office, shop, warehouse, storage, fueling, and crew facilities, with concrete and asphalt areas supporting industrial operations. The largest property at 851 W. Harrison Road spans approximately 13.76 acres and includes approximately 29,000 SF under roof, a ±21,303 SF shop, a ±6,860 SF standalone office, 28-foot clear height, 10 overhead doors, two bridge cranes, two 25-foot-wide wash bays, and a fenced equipment and truck yard. It was built in 2006 and renovated in 2020.
The remaining sites include a ±5,125 SF office and warehouse facility on approximately 1.80 acres and a ±3,900 SF office and shop facility on approximately 2.20 acres. The smaller industrial building provides approximately 750 SF of office space, 3,150 SF of shop and warehouse area, four grade-level overhead doors, and a fenced service yard. Tenancy includes PCL Solar Constructors, Freedom Hot Oil, and Love’s Travel Stops, with the portfolio also including a natural gas fueling station. Zoning is identified as I-2 Industrial & No Zoning.
The remaining sites include a ±5,125 SF office and warehouse facility on approximately 1.80 acres and a ±3,900 SF office and shop facility on approximately 2.20 acres. The smaller industrial building provides approximately 750 SF of office space, 3,150 SF of shop and warehouse area, four grade-level overhead doors, and a fenced service yard. Tenancy includes PCL Solar Constructors, Freedom Hot Oil, and Love’s Travel Stops, with the portfolio also including a natural gas fueling station. Zoning is identified as I-2 Industrial & No Zoning.
Key Highlights
- Three industrial properties across approximately 17.76 acres
- 851 W. Harrison Road includes approximately 29,000 SF under roof on approximately 13.76 acres
- Industrial features include 28‑foot clear height, 10 overhead doors, two bridge cranes, and two 25‑foot‑wide wash bays
Financial Insights
Estimated NOI and Cap Rate
NOI / Yr
$273,084
Cap Rate
4.11%
Suggested Prices Based on Cap Rates
Cap Rate 5%
$5,461,680
$5.5M
Cap Rate 7%
$3,901,200
$3.9M
Cap Rate 9%
$3,034,267
$3.0M
Market Conditions
NOI Build-Up for 38,500 SF
Gross rent
$351.1K $9.12/SF
− Vacancy
−$29.8K −$0.78/SF
EGI
$321.3K $8.34/SF
− OpEx
−$48.2K −$1.25/SF
NOI
$273.1K $7.09/SF
Area
Gregg County, TX
Vacancy
8.50%
Lease Rate
$9.12 /SF/Yr
Expense Ratio
15.00%
Simulate Cap Rate and NOI
Suggested Prices Based on Cap Rates
Cap Rate 5%
$5,461,680
Cap Rate 7%
$3,901,200
Cap Rate 9%
$3,034,267
Alternative Uses
Best Use
Office B
$9.20M
$8.05M – $10.73M
NOI $643,991 @ 7.0% cap · market cap 9.68%
Second Best
Warehouse
$3.90M
$3.41M – $4.55M
NOI $273,084 @ 7.0% cap · market cap 4.11%
Theoretical Best
Hotel Hospitality
$29.00M
$25.37M – $33.83M
NOI $2,029,913 @ 7.0% cap · market cap 30.53%
Zoning and permitted uses should be independently verified with authorities.
How Realmo checks its estimates
Property Analytics
Unlock full access to Insights
Subscribe to Realmo Intelligence
Open Analytics
Current Use
Location Intelligence
Trade Area within ½ mile
118
Businesses Nearby
Balanced
Demand for This Use
Explore this area
Business Placement
Demographics for 75604, TX
30,752
Population
13,579
Households
2.3
Avg Household Size
36
Median Age
23%
College-Educated
85%
High-School Grad
44.1 sq mi
ZIP Area
697
Density / Sq Mi
$67,826
Median Household Income
$40,484
Median Earnings
$1,058
Median Rent
$189,900
Median Home Value
Check the figures for this property
Cap Rate, Value Estimation, Potential NOI and more
View Realmo Analytics
Market
Vacancy Rate% for Office in South region






Frequently Asked Questions
What type of property is this?
Flex space - Three industrial properties combine office, shop, storage, yard, fueling, crane, and wash-bay improvements across Longview.
Where is this flex space located?
The property is located at 820 W Harrison Road Longview, TX.
What is the asking price?
The asking price for this property is $6,650,000.
What are key features of this property?
This property features: Three industrial properties across approximately 17.76 acres; 851 W. Harrison Road includes approximately 29,000 SF under roof on approximately 13.76 acres; Industrial features include 28‑foot clear height, 10 overhead doors, two bridge cranes, and two 25‑foot‑wide wash bays


