Storefront Retail
For Sale
$375,000
807 Napier Ave, St Joseph, MI 49085
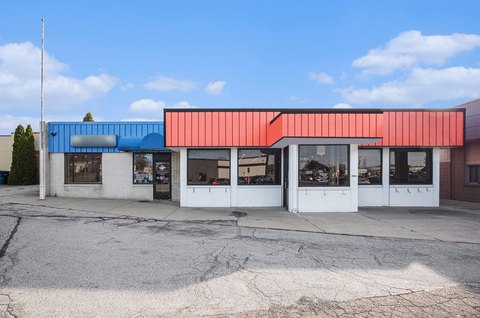
Street-facing windows, a glass entry, and covered canopy create a customer-oriented commercial frontage.
Property Size2,641 SF
Price / SF$141.99
Days on Market48
Property Features for 807 Napier Ave
General Information
Standard status
Active
Size
2,641 SF
Building Details
Year Built
1940
Listing Agency:
RE/MAX by the Lake
Listed By:
David E Shepherd · License #6506048705
(269) 930-5564
Source:
Katie-k
Added: Sep 6
Changed: Oct 11
Last Checked: Oct 7 at 4:50PM
Displayed information is deemed reliable but is not guaranteed and should be independently verified. All listing content including descriptions, pricing, images are the copyrighted material of RE/MAX by the Lake

Ask AI about this property
Review the available facts, identify missing information and prepare questions for the agent.
Investment Insights
Based on property information with market context.
This 1940-built storefront property at 807 Napier Avenue in St. Joseph, Michigan, presents a flexible commercial layout with room for customization. The street-facing exterior includes expansive front windows, a glass entry, a covered canopy, and stone accents. The interior can be opened and reconfigured to suit a new commercial concept.
The property sits along a major road near neighboring businesses and established commercial activity. Its existing storefront presentation and adaptable configuration support consideration for retail, service-oriented, or other commercial use. The building was formerly associated with a pharmacy use and is positioned for a new operating concept.
The property sits along a major road near neighboring businesses and established commercial activity. Its existing storefront presentation and adaptable configuration support consideration for retail, service-oriented, or other commercial use. The building was formerly associated with a pharmacy use and is positioned for a new operating concept.
Key Highlights
- 1940‑built commercial storefront at 807 Napier Avenue
- Expansive front windows with a glass entry
- Covered canopy and stone exterior accents
Financial Insights
Estimated NOI and Cap Rate
NOI / Yr
$27,416
Cap Rate
7.31%
Suggested Prices Based on Cap Rates
Cap Rate 5%
$548,320
$548.3K
Cap Rate 7%
$391,657
$391.7K
Cap Rate 9%
$304,622
$304.6K
Market Conditions
NOI Build-Up for 2,641 SF
Gross rent
$40.9K $15.48/SF
− Vacancy
−$1.7K −$0.65/SF
EGI
$39.2K $14.83/SF
− OpEx
−$11.7K −$4.45/SF
NOI
$27.4K $10.38/SF
Area
Berrien County, MI
Vacancy
4.20%
Lease Rate
$15.48 /SF/Yr
Expense Ratio
30.00%
Simulate Cap Rate and NOI
Suggested Prices Based on Cap Rates
Cap Rate 5%
$548,320
Cap Rate 7%
$391,657
Cap Rate 9%
$304,622
Alternative Uses
Best Use
Retail
$391.7K
$342.7K – $456.9K
NOI $27,416 @ 7.0% cap · market cap 7.31%
Second Best
—
—
no second resolved use
Theoretical Best
Office A
$555.7K
$486.3K – $648.4K
NOI $38,902 @ 7.0% cap · market cap 10.37%
Zoning and permitted uses should be independently verified with authorities.
How Realmo checks its estimates
Property Analytics
Current Use
Location Intelligence
Trade Area within ½ mile
730
Businesses Nearby
Under-served
Demand for This Use
Explore this area
Business Placement
Demographics for 49085, MI
24,047
Population
11,468
Households
2.1
Avg Household Size
44
Median Age
49%
College-Educated
97%
High-School Grad
24.1 sq mi
ZIP Area
998
Density / Sq Mi
$101,763
Median Household Income
$58,316
Median Earnings
$1,099
Median Rent
$287,300
Median Home Value
Market
Vacancy Rate% for Retail in Midwest region






Similar Off Market Nearby
- Tara Florist Atelier — 2309 Lakeshore Dr, St Joseph, MI 49085
Frequently Asked Questions
What type of property is this?
Storefront property - Street-facing windows, a glass entry, and covered canopy create a customer-oriented commercial frontage.
Where is this storefront property located?
The property is located at 807 Napier Ave St Joseph, MI.
What is the asking price?
The asking price for this property is $375,000.
What are key features of this property?
This property features: 1940‑built commercial storefront at 807 Napier Avenue; Expansive front windows with a glass entry; Covered canopy and stone exterior accents


