First-Floor Office
For Sale
$535,000
802 Lily Creek Rd, Louisville, KY 40243
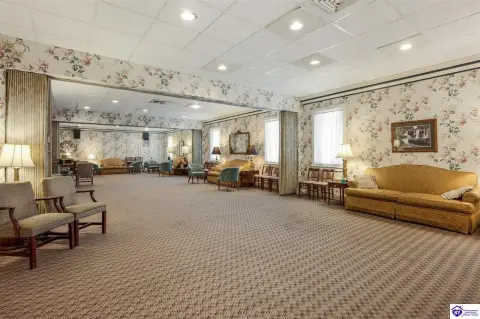
Configured with reception, conference rooms, private offices, a break room, storage, and two restrooms.
Property Size3,000 SF
Price / SF$178.33
Days on Market52
Property Features for 802 Lily Creek Rd
General Information
Standard status
Active
Size
3,000 SF
Property subtype
Office
Zoning
OR3
Additional Details
Floor
First Floor
HOA Fee
$450.19
Office Units
1
Amenities
Power
Water
Sewer
Building Details
Year Built
2010
Owner Occupied
Yes
Listing Agency:
simpler.realestate
Listed By:
Paul Jordan · License #185995
(502) 396-9595
Source:
Kcrea.resimplifi
Added: Aug 26
Changed: Oct 12
Last Checked: Oct 16 at 5:50AM
Displayed information is deemed reliable but is not guaranteed and should be independently verified. All listing content including descriptions, pricing, images are the copyrighted material of simpler.realestate

Ask AI about this property
Review the available facts, identify missing information and prepare questions for the agent.
Investment Insights
Based on property information with market context.
This 3,000-square-foot office condominium occupies the first floor of the Blankenbaker Centre office condominium development. The interior includes a reception area, two conference rooms, eight offices, a break room, two restrooms, and a storage room. Two HVAC systems serve the space, and the layout can be divided into two separate units if desired.
Built in 2010, the property is zoned OR3 and sits approximately one block west of Blankenbaker Parkway. The configuration supports a range of office arrangements, including a single-user setup or separately managed suites within the existing floor plan.
Built in 2010, the property is zoned OR3 and sits approximately one block west of Blankenbaker Parkway. The configuration supports a range of office arrangements, including a single-user setup or separately managed suites within the existing floor plan.
Key Highlights
- 3,000 SF first‑floor office condominium
- Eight offices, two conference rooms, reception area, break room, storage room, and two restrooms
- Two HVAC systems serve the office interior
Financial Insights
Estimated NOI and Cap Rate
NOI / Yr
$38,745
Cap Rate
7.24%
Suggested Prices Based on Cap Rates
Cap Rate 5%
$774,900
$774.9K
Cap Rate 7%
$553,500
$553.5K
Cap Rate 9%
$430,500
$430.5K
Market Conditions
NOI Build-Up for 3,000 SF
Gross rent
$63.0K $21.00/SF
− Vacancy
−$11.3K −$3.78/SF
EGI
$51.7K $17.22/SF
− OpEx
−$12.9K −$4.31/SF
NOI
$38.7K $12.92/SF
Area
Louisville, KY
Vacancy
18.00%
Lease Rate
$21.00 /SF/Yr
Expense Ratio
25.00%
Simulate Cap Rate and NOI
Suggested Prices Based on Cap Rates
Cap Rate 5%
$774,900
Cap Rate 7%
$553,500
Cap Rate 9%
$430,500
Alternative Uses
Best Use
Office B
$553.5K
$484.3K – $645.8K
NOI $38,745 @ 7.0% cap · market cap 7.24%
Second Best
—
—
no second resolved use
Theoretical Best
Office A
$777.6K
$680.4K – $907.2K
NOI $54,432 @ 7.0% cap · market cap 10.17%
Zoning and permitted uses should be independently verified with authorities.
How Realmo checks its estimates
Property Analytics
Current Use
Lease Details
1
Office units
Location Intelligence
Trade Area within ½ mile
340
Businesses Nearby
Explore this area
Business Placement
Demographics for 40243, KY
11,521
Population
6,151
Households
1.9
Avg Household Size
44
Median Age
51%
College-Educated
97%
High-School Grad
4.1 sq mi
ZIP Area
2,810
Density / Sq Mi
$75,859
Median Household Income
$50,248
Median Earnings
$1,260
Median Rent
$297,900
Median Home Value
Market
Vacancy Rate% for Office in Louisville, KY


Frequently Asked Questions
What type of property is this?
Office units - Configured with reception, conference rooms, private offices, a break room, storage, and two restrooms.
Where is this office units located?
The property is located at 802 Lily Creek Rd Louisville, KY.
What is the asking price?
The asking price for this property is $535,000.
What are key features of this property?
This property features: 3,000 SF first‑floor office condominium; Eight offices, two conference rooms, reception area, break room, storage room, and two restrooms; Two HVAC systems serve the office interior


