Trinity Vicinity Triplex
For Sale
$375,000
801 W 9TH ST, Wilmington, DE 19801
Three 2-bedroom apartments in Wilmington's classical Trinity Vicinity.
Property Size2,875 SF
Price / SF$130.43
Days on Market192
Property Features for 801 W 9TH ST
General Information
Standard status
Active
Size
2,875 SF
Property subtype
Multi-family
Listing Agency:
Pantano Real Estate Inc
(302) 888-0300
Listed By:
Joseph P Hurley III · License #RS-0018346
(302) 740-5524
Source:
Careyrealtygroup
Added: Apr 9
Changed: Oct 13
Last Checked: Oct 16 at 9:05AM
Displayed information is deemed reliable but is not guaranteed and should be independently verified. All listing content including descriptions, pricing, images are the copyrighted material of Pantano Real Estate Inc

Ask AI about this property
Review the available facts, identify missing information and prepare questions for the agent.
Investment Insights
Based on property information with market context.
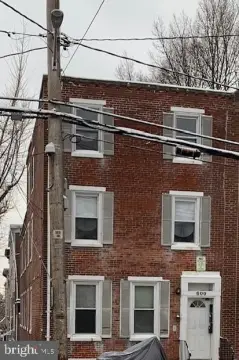
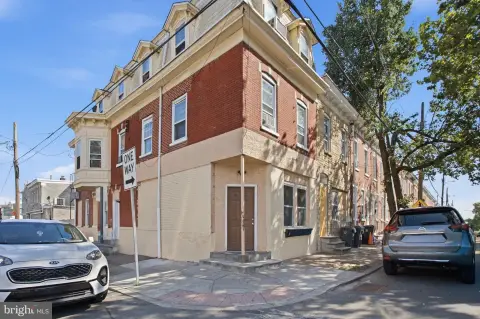
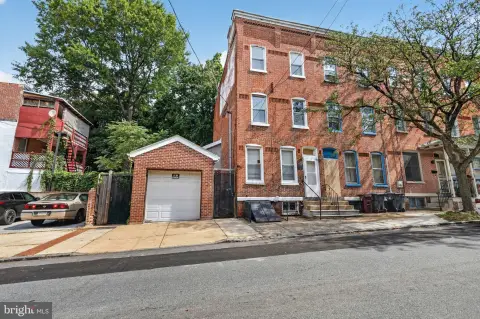
Located in Wilmington's Trinity Vicinity, this corner building features three 2-bedroom apartments with modern floorplans. The building was rebuilt approximately 15 years ago. The main floor has two private exterior entrances, while the second and third floor units are accessed via an interior stair system with an exterior fire escape. Each unit has separate HVAC systems with central air, hot water tanks, and electric panels, plus one electric panel for the common area, as well as separate gas meters. The exterior features brick covered in stucco and brick paver sidewalks with granite curbs. The property is located within walking distance to parks, places of worship, educational facilities, employment centers, and Market St nightlife. The transit score is 51, indicating good transit options. The bike score is 47, indicating it is somewhat bikeable. The walk score is 43, indicating it is car-dependent. This property presents an opportunity for investors to operate for cash flow.
Key Highlights
- Three separate 2‑bedroom apartments offer immediate rental income potential.
- Fully rebuilt within the last 15 years +/- with modern, separate mechanical systems (HVAC, hot water, electric, gas).
- Excellent location within walking distance to parks, places of worships, educational facilities, employment centers and Market St. nightlife.**
Financial Insights
Estimated NOI and Cap Rate
NOI / Yr
$30,483
Cap Rate
8.13%
Suggested Prices Based on Cap Rates
Cap Rate 5%
$609,660
$609.7K
Cap Rate 7%
$435,471
$435.5K
Cap Rate 9%
$338,700
$338.7K
Market Conditions
NOI Build-Up for 2,875 SF
Gross rent
$46.6K $16.20/SF
− Vacancy
−$3.0K −$1.05/SF
EGI
$43.5K $15.15/SF
− OpEx
−$13.1K −$4.54/SF
NOI
$30.5K $10.60/SF
Area
New Castle County, DE
Vacancy
6.50%
Lease Rate
$16.20 /SF/Yr
Expense Ratio
30.00%
Simulate Cap Rate and NOI
Suggested Prices Based on Cap Rates
Cap Rate 5%
$609,660
Cap Rate 7%
$435,471
Cap Rate 9%
$338,700
Alternative Uses
Best Use
Multifamily LT 5
$435.5K
$381.0K – $508.1K
NOI $30,483 @ 7.0% cap · market cap 8.13%
Second Best
Apartment 5plus
$389.0K
$340.4K – $453.9K
NOI $27,232 @ 7.0% cap · market cap 7.26%
Theoretical Best
Office A
$687.7K
$601.7K – $802.3K
NOI $48,137 @ 7.0% cap · market cap 12.84%
Zoning and permitted uses should be independently verified with authorities.
How Realmo checks its estimates
Property Analytics
Unlock full access to Insights
Subscribe to Realmo Intelligence
Open Analytics
Current Use
Location Intelligence
Trade Area within ½ mile
6,853
Businesses Nearby
Explore this area
Business Placement
Demographics for 19801, DE
16,219
Population
9,390
Households
1.7
Avg Household Size
34
Median Age
26%
College-Educated
85%
High-School Grad
4.4 sq mi
ZIP Area
3,686
Density / Sq Mi
$44,505
Median Household Income
$36,684
Median Earnings
$1,126
Median Rent
$196,000
Median Home Value
Check the figures for this property
Cap Rate, Value Estimation, Potential NOI and more
View Realmo Analytics
Market
Vacancy Rate% for Multifamily in South region






Frequently Asked Questions
What type of property is this?
Triplex - Three 2-bedroom apartments in Wilmington's classical Trinity Vicinity.
Where is this triplex located?
The property is located at 801 W 9TH ST Wilmington, DE.
What is the asking price?
The asking price for this property is $375,000.
What are key features of this property?
This property features: Three separate 2‑bedroom apartments offer immediate rental income potential.; Fully rebuilt within the last 15 years +/- with modern, separate mechanical systems (HVAC, hot water, electric, gas).; Excellent location within walking distance to parks, places of worships, educational facilities, employment centers and Market St. nightlife.**


