Office Unit with Existing
For Sale
$599,900
801-2840 Keller Springs Rd, Carrollton, TX 75006
Functional professional suite with private offices, conference space, reception, open work areas, and a kitchenette.
Property Size2,300 SF
Price / SF$260.83
Days on Market130
Property Features for 801-2840 Keller Springs Rd
General Information
Standard status
Active
Size
2,300 SF
Additional Details
Highway Access
Yes
Taxes and HOA fees
Annual Taxes
$6,319
Listing Agency:
OnDemand Realty
Listed By:
Johanna Rodriguez · License #0742982
(214) 772-4279
Source:
Exprealty
Added: Jun 9
Changed: Oct 11
Last Checked: Oct 15 at 12:56AM
Displayed information is deemed reliable but is not guaranteed and should be independently verified. All listing content including descriptions, pricing, images are the copyrighted material of OnDemand Realty

Ask AI about this property
Review the available facts, identify missing information and prepare questions for the agent.
Investment Insights
Based on property information with market context.
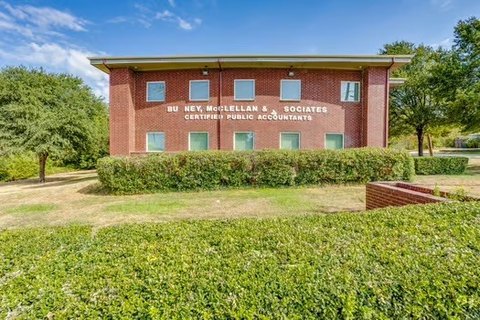
This approximately 2, 300 SF office unit is configured for an established business operation and currently serves as a home health services office. The interior includes a conference room, three private offices, a reception area, open workstations, and a kitchenette, creating a practical mix of collaborative and dedicated work areas.
The suite is located within Keller Springs Office Park in Carrollton, a professional business setting with ample parking. Access to the Dallas North Tollway, George Bush Turnpike, and I-35E connects the property with business districts throughout the Dallas-Fort Worth metroplex. An established tenant is in place under a renewed two-year lease term beginning July 1st.
The suite is located within Keller Springs Office Park in Carrollton, a professional business setting with ample parking. Access to the Dallas North Tollway, George Bush Turnpike, and I-35E connects the property with business districts throughout the Dallas-Fort Worth metroplex. An established tenant is in place under a renewed two-year lease term beginning July 1st.
Key Highlights
- Approximately 2, 300 SF office unit
- Established tenant in place with a renewed two‑year lease beginning July 1st
- Three private offices plus conference room, reception, open work areas, and kitchenette
Financial Insights
Estimated NOI and Cap Rate
NOI / Yr
$28,490
Cap Rate
4.75%
Suggested Prices Based on Cap Rates
Cap Rate 5%
$569,800
$569.8K
Cap Rate 7%
$407,000
$407.0K
Cap Rate 9%
$316,556
$316.6K
Market Conditions
NOI Build-Up for 2,300 SF
Gross rent
$50.8K $22.08/SF
− Vacancy
−$12.8K −$5.56/SF
EGI
$38.0K $16.52/SF
− OpEx
−$9.5K −$4.13/SF
NOI
$28.5K $12.39/SF
Area
Carrollton, TX
Vacancy
25.20%
Lease Rate
$22.08 /SF/Yr
Expense Ratio
25.00%
Simulate Cap Rate and NOI
Suggested Prices Based on Cap Rates
Cap Rate 5%
$569,800
Cap Rate 7%
$407,000
Cap Rate 9%
$316,556
Alternative Uses
Best Use
Office B
$407.0K
$356.1K – $474.8K
NOI $28,490 @ 7.0% cap · market cap 4.75%
Second Best
—
—
no second resolved use
Theoretical Best
Specialty Retail
$565.9K
$495.1K – $660.2K
NOI $39,610 @ 7.0% cap · market cap 6.60%
Zoning and permitted uses should be independently verified with authorities.
How Realmo checks its estimates
Property Analytics
Current Use
Lease Details
Yes
Highway access
Location Intelligence
Trade Area within ½ mile
640
Businesses Nearby
Explore this area
Business Placement
Demographics for 75006, TX
47,811
Population
19,549
Households
2.4
Avg Household Size
37
Median Age
33%
College-Educated
83%
High-School Grad
17.1 sq mi
ZIP Area
2,796
Density / Sq Mi
$79,466
Median Household Income
$43,403
Median Earnings
$1,528
Median Rent
$296,500
Median Home Value
Market
Vacancy Rate% for Office in South region




Frequently Asked Questions
What type of property is this?
Office units - Functional professional suite with private offices, conference space, reception, open work areas, and a kitchenette.
Where is this office units located?
The property is located at 801-2840 Keller Springs Rd Carrollton, TX.
What is the asking price?
The asking price for this property is $599,900.
What are key features of this property?
This property features: Approximately 2, 300 SF office unit; Established tenant in place with a renewed two‑year lease beginning July 1st; Three private offices plus conference room, reception, open work areas, and kitchenette


